
|
|||||
|
 | |
| |
| |
| |
| |
| |
|
Gene: BOLA2B |
Gene summary for BOLA2B |
| Gene information | Species | Human | Gene symbol | BOLA2B | Gene ID | 654483 |
| Gene name | bolA family member 2B | |
| Gene Alias | BOLA2 | |
| Cytomap | 16p11.2 | |
| Gene Type | protein-coding | GO ID | GO:0006790 | UniProtAcc | A0A087WZT3 |
Top |
Malignant transformation analysis |
| Identification of the aberrant gene expression in precancerous and cancerous lesions by comparing the gene expression of stem-like cells in diseased tissues with normal stem cells |
| Entrez ID | Symbol | Replicates | Species | Organ | Tissue | Adj P-value | Log2FC | Malignancy |
| 654483 | BOLA2B | HTA11_3410_2000001011 | Human | Colorectum | AD | 3.38e-10 | 2.03e-01 | 0.0155 |
| 654483 | BOLA2B | HTA11_2487_2000001011 | Human | Colorectum | SER | 1.30e-29 | 6.73e-01 | -0.1808 |
| 654483 | BOLA2B | HTA11_1938_2000001011 | Human | Colorectum | AD | 7.73e-09 | 3.61e-01 | -0.0811 |
| 654483 | BOLA2B | HTA11_347_2000001011 | Human | Colorectum | AD | 3.42e-16 | 3.40e-01 | -0.1954 |
| 654483 | BOLA2B | HTA11_411_2000001011 | Human | Colorectum | SER | 2.50e-11 | 7.18e-01 | -0.2602 |
| 654483 | BOLA2B | HTA11_2112_2000001011 | Human | Colorectum | SER | 3.88e-11 | 7.52e-01 | -0.2196 |
| 654483 | BOLA2B | HTA11_3361_2000001011 | Human | Colorectum | AD | 1.96e-16 | 5.11e-01 | -0.1207 |
| 654483 | BOLA2B | HTA11_83_2000001011 | Human | Colorectum | SER | 1.71e-21 | 6.36e-01 | -0.1526 |
| 654483 | BOLA2B | HTA11_696_2000001011 | Human | Colorectum | AD | 3.45e-30 | 5.72e-01 | -0.1464 |
| 654483 | BOLA2B | HTA11_866_2000001011 | Human | Colorectum | AD | 1.42e-14 | 3.12e-01 | -0.1001 |
| 654483 | BOLA2B | HTA11_1391_2000001011 | Human | Colorectum | AD | 2.25e-24 | 6.20e-01 | -0.059 |
| 654483 | BOLA2B | HTA11_2992_2000001011 | Human | Colorectum | SER | 2.24e-14 | 7.31e-01 | -0.1706 |
| 654483 | BOLA2B | HTA11_5212_2000001011 | Human | Colorectum | AD | 1.67e-10 | 4.21e-01 | -0.2061 |
| 654483 | BOLA2B | HTA11_5216_2000001011 | Human | Colorectum | SER | 2.17e-09 | 4.90e-01 | -0.1462 |
| 654483 | BOLA2B | HTA11_546_2000001011 | Human | Colorectum | AD | 4.83e-05 | 1.99e-01 | -0.0842 |
| 654483 | BOLA2B | HTA11_9341_2000001011 | Human | Colorectum | SER | 5.61e-03 | 2.55e-01 | -0.00410000000000005 |
| 654483 | BOLA2B | HTA11_7862_2000001011 | Human | Colorectum | AD | 5.15e-10 | 3.55e-01 | -0.0179 |
| 654483 | BOLA2B | HTA11_866_3004761011 | Human | Colorectum | AD | 1.77e-13 | 2.93e-01 | 0.096 |
| 654483 | BOLA2B | HTA11_4255_2000001011 | Human | Colorectum | SER | 3.34e-04 | 3.36e-01 | 0.0446 |
| 654483 | BOLA2B | HTA11_8622_2000001021 | Human | Colorectum | SER | 3.19e-02 | 1.62e-01 | 0.0528 |
| Page: 1 2 3 |
| Tissue | Expression Dynamics | Abbreviation |
| Colorectum (GSE201348) |  | FAP: Familial adenomatous polyposis |
| CRC: Colorectal cancer | ||
| Colorectum (HTA11) |  | AD: Adenomas |
| SER: Sessile serrated lesions | ||
| MSI-H: Microsatellite-high colorectal cancer | ||
| MSS: Microsatellite stable colorectal cancer | ||
| Oral Cavity | 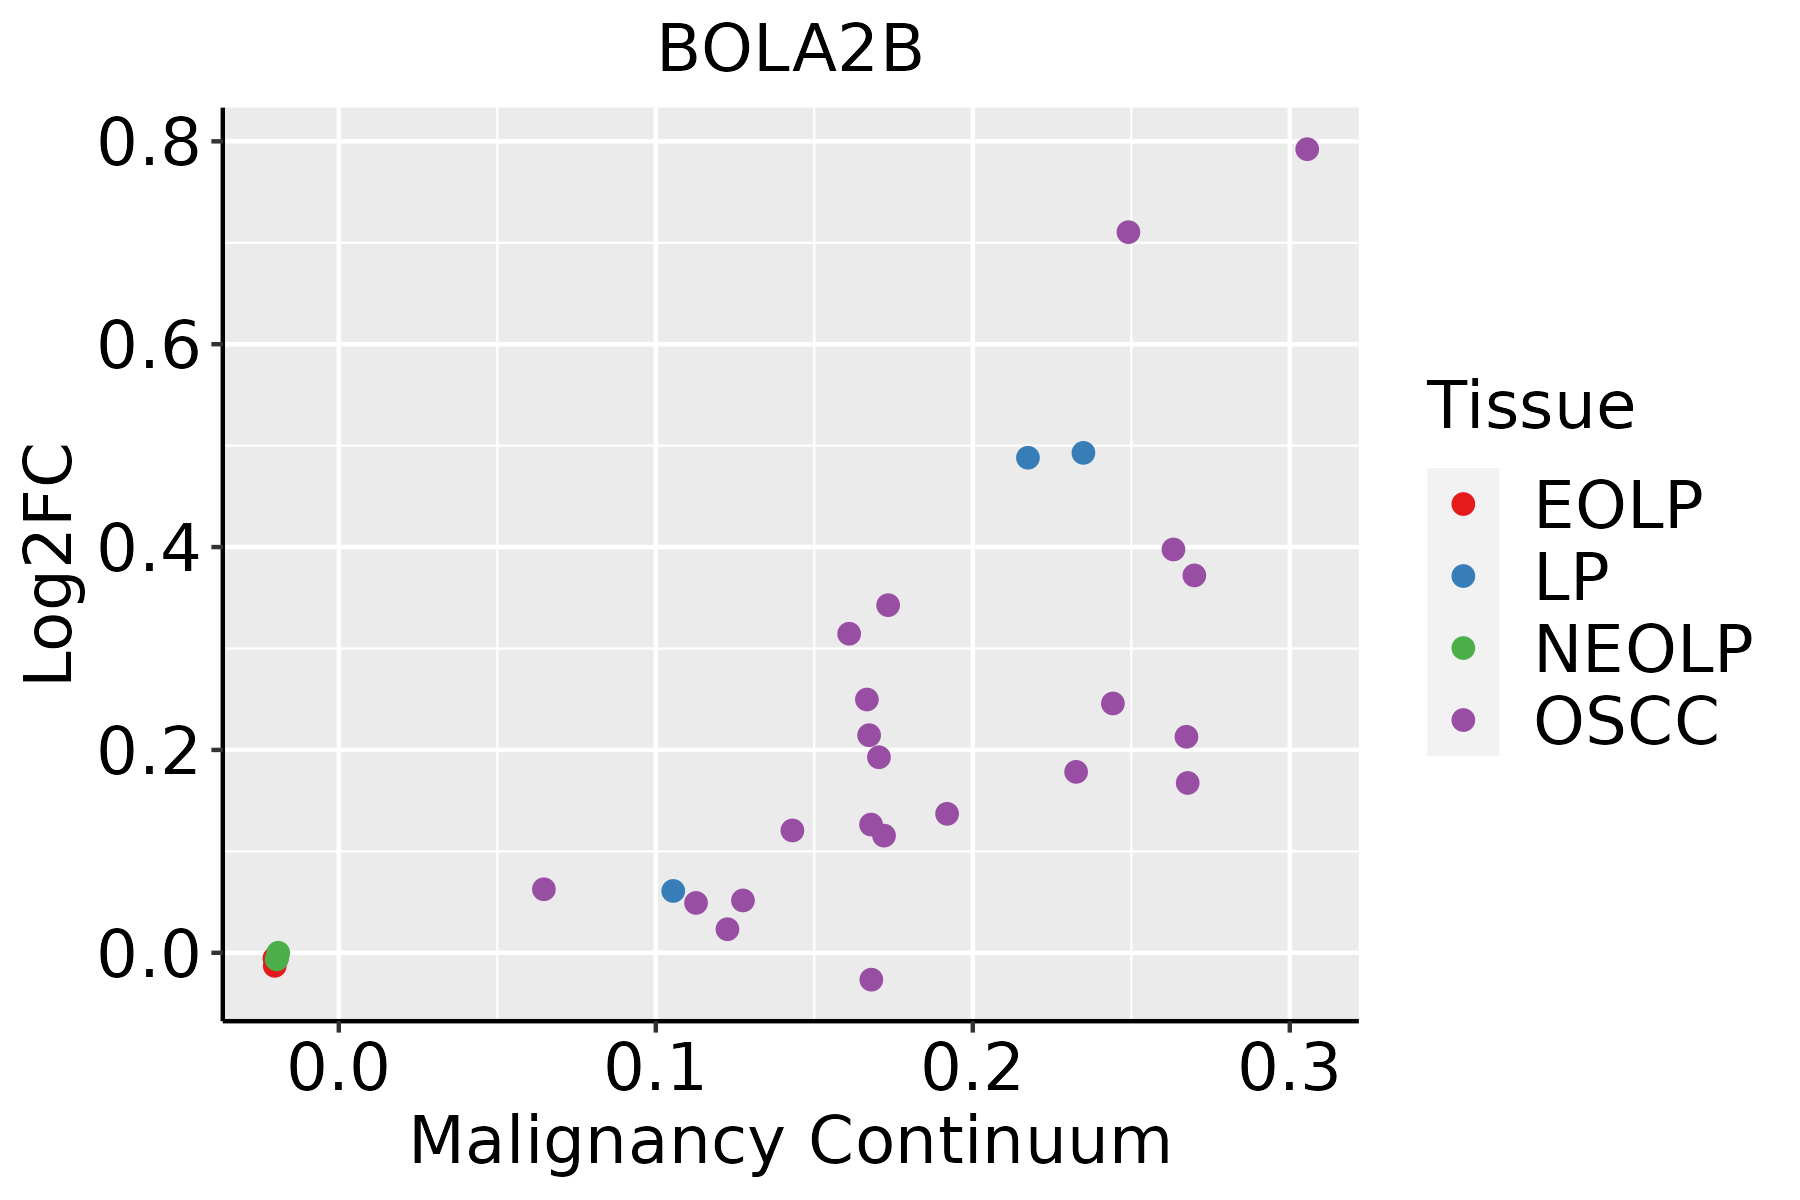 | EOLP: Erosive Oral lichen planus |
| LP: leukoplakia | ||
| NEOLP: Non-erosive oral lichen planus | ||
| OSCC: Oral squamous cell carcinoma |
| ∗log2FC in expression of this searched gene in stem-like cells from each diseased tissue sample relative to stem-like cells in normal samples in each tissue plotted against the malignancy continuum. Samples are colored based on if they are from different disease stage. |
Top |
Malignant transformation related pathway analysis |
| Find out the enriched GO biological processes and KEGG pathways involved in transition from healthy to precancer to cancer |
| Tissue | Disease Stage | Enriched GO biological Processes |
| Liver | Cyst |  |
| Lung | IAC |  |
| Lung | AIS |  |
| Lung | AAH |  |
| Lung | MIAC |  |
| ∗Top 15 enriched GO BP terms are showed in the bar plot of each disease state in each tissue. Each row represents a significant GO biological process which is colored according to the -log10(p.adjust). |
| Page: 1 2 3 4 5 6 7 8 9 |
| GO ID | Tissue | Disease Stage | Description | Gene Ratio | Bg Ratio | pvalue | p.adjust | Count |
| GO:0055076 | Colorectum | AD | transition metal ion homeostasis | 53/3918 | 138/18723 | 1.89e-06 | 5.65e-05 | 53 |
| GO:0046916 | Colorectum | AD | cellular transition metal ion homeostasis | 43/3918 | 115/18723 | 3.62e-05 | 6.56e-04 | 43 |
| GO:0006790 | Colorectum | AD | sulfur compound metabolic process | 101/3918 | 339/18723 | 6.46e-05 | 1.07e-03 | 101 |
| GO:0055072 | Colorectum | AD | iron ion homeostasis | 32/3918 | 85/18723 | 2.97e-04 | 3.60e-03 | 32 |
| GO:0051604 | Colorectum | AD | protein maturation | 85/3918 | 294/18723 | 6.73e-04 | 6.91e-03 | 85 |
| GO:0006879 | Colorectum | AD | cellular iron ion homeostasis | 25/3918 | 67/18723 | 1.51e-03 | 1.27e-02 | 25 |
| GO:00550761 | Colorectum | SER | transition metal ion homeostasis | 41/2897 | 138/18723 | 1.66e-05 | 5.05e-04 | 41 |
| GO:00516041 | Colorectum | SER | protein maturation | 73/2897 | 294/18723 | 1.82e-05 | 5.38e-04 | 73 |
| GO:00469161 | Colorectum | SER | cellular transition metal ion homeostasis | 33/2897 | 115/18723 | 2.20e-04 | 3.89e-03 | 33 |
| GO:00067901 | Colorectum | SER | sulfur compound metabolic process | 73/2897 | 339/18723 | 1.75e-03 | 1.81e-02 | 73 |
| GO:00550721 | Colorectum | SER | iron ion homeostasis | 24/2897 | 85/18723 | 1.91e-03 | 1.93e-02 | 24 |
| GO:00550762 | Colorectum | MSS | transition metal ion homeostasis | 45/3467 | 138/18723 | 4.99e-05 | 9.02e-04 | 45 |
| GO:00550722 | Colorectum | MSS | iron ion homeostasis | 29/3467 | 85/18723 | 4.44e-04 | 5.32e-03 | 29 |
| GO:00469162 | Colorectum | MSS | cellular transition metal ion homeostasis | 35/3467 | 115/18723 | 1.33e-03 | 1.26e-02 | 35 |
| GO:00067902 | Colorectum | MSS | sulfur compound metabolic process | 85/3467 | 339/18723 | 1.52e-03 | 1.39e-02 | 85 |
| GO:00516042 | Colorectum | MSS | protein maturation | 75/3467 | 294/18723 | 1.70e-03 | 1.53e-02 | 75 |
| GO:00068791 | Colorectum | MSS | cellular iron ion homeostasis | 22/3467 | 67/18723 | 3.57e-03 | 2.64e-02 | 22 |
| GO:00550763 | Colorectum | MSI-H | transition metal ion homeostasis | 20/1319 | 138/18723 | 1.62e-03 | 2.40e-02 | 20 |
| GO:00516043 | Colorectum | MSI-H | protein maturation | 34/1319 | 294/18723 | 3.02e-03 | 3.80e-02 | 34 |
| GO:005160410 | Oral cavity | OSCC | protein maturation | 170/7305 | 294/18723 | 3.97e-11 | 1.28e-09 | 170 |
| Page: 1 2 |
| Pathway ID | Tissue | Disease Stage | Description | Gene Ratio | Bg Ratio | pvalue | p.adjust | qvalue | Count |
| Page: 1 |
Top |
Cell-cell communication analysis |
| Identification of potential cell-cell interactions between two cell types and their ligand-receptor pairs for different disease states |
| Ligand | Receptor | LRpair | Pathway | Tissue | Disease Stage |
| Page: 1 |
Top |
Single-cell gene regulatory network inference analysis |
| Find out the significant the regulons (TFs) and the target genes of each regulon across cell types for different disease states |
| TF | Cell Type | Tissue | Disease Stage | Target Gene | RSS | Regulon Activity |
| ∗The dot plots of a searched regulon are shown for all cell subpopulations in each disease state of each tissue based on the regulon specific score inferred using pySCENIC and by calculating the average expression. |
| Page: 1 |
Top |
Somatic mutation of malignant transformation related genes |
| Annotation of somatic variants for genes involved in malignant transformation |
| Hugo Symbol | Variant Class | Variant Classification | dbSNP RS | HGVSc | HGVSp | HGVSp Short | SWISSPROT | BIOTYPE | SIFT | PolyPhen | Tumor Sample Barcode | Tissue | Histology | Sex | Age | Stage | Therapy Types | Drugs | Outcome |
| Page: 1 |
Top |
Related drugs of malignant transformation related genes |
| Identification of chemicals and drugs interact with genes involved in malignant transfromation |
| (DGIdb 4.0) |
| Entrez ID | Symbol | Category | Interaction Types | Drug Claim Name | Drug Name | PMIDs |
| Page: 1 |

Copyright 2023-Present -The University of Texas Health Science Center at Houston |