
|
|||||
|
 | |
| |
| |
| |
| |
| |
|
Gene: ACAT2 |
Gene summary for ACAT2 |
| Gene information | Species | Human | Gene symbol | ACAT2 | Gene ID | 39 |
| Gene name | acetyl-CoA acetyltransferase 2 | |
| Gene Alias | ACAT2 | |
| Cytomap | 6q25.3 | |
| Gene Type | protein-coding | GO ID | GO:0006082 | UniProtAcc | Q9BWD1 |
Top |
Malignant transformation analysis |
| Identification of the aberrant gene expression in precancerous and cancerous lesions by comparing the gene expression of stem-like cells in diseased tissues with normal stem cells |
| Entrez ID | Symbol | Replicates | Species | Organ | Tissue | Adj P-value | Log2FC | Malignancy |
| 39 | ACAT2 | GSM4909296 | Human | Breast | IDC | 7.71e-04 | -1.42e-01 | 0.1524 |
| 39 | ACAT2 | GSM4909297 | Human | Breast | IDC | 1.31e-08 | -1.23e-01 | 0.1517 |
| 39 | ACAT2 | GSM4909301 | Human | Breast | IDC | 1.15e-03 | -1.32e-01 | 0.1577 |
| 39 | ACAT2 | GSM4909311 | Human | Breast | IDC | 3.26e-13 | -1.99e-01 | 0.1534 |
| 39 | ACAT2 | GSM4909312 | Human | Breast | IDC | 2.89e-05 | -1.09e-01 | 0.1552 |
| 39 | ACAT2 | GSM4909315 | Human | Breast | IDC | 3.04e-13 | -2.06e-01 | 0.21 |
| 39 | ACAT2 | GSM4909319 | Human | Breast | IDC | 4.53e-16 | -1.55e-01 | 0.1563 |
| 39 | ACAT2 | GSM4909321 | Human | Breast | IDC | 4.71e-07 | -1.66e-01 | 0.1559 |
| 39 | ACAT2 | brca1 | Human | Breast | Precancer | 1.41e-08 | 4.81e-01 | -0.0338 |
| 39 | ACAT2 | brca2 | Human | Breast | Precancer | 4.81e-14 | 4.77e-01 | -0.024 |
| 39 | ACAT2 | M2 | Human | Breast | IDC | 1.09e-10 | 7.23e-01 | 0.21 |
| 39 | ACAT2 | NCCBC3 | Human | Breast | DCIS | 7.21e-03 | -1.11e-01 | 0.1198 |
| 39 | ACAT2 | P1 | Human | Breast | IDC | 2.16e-03 | -1.14e-01 | 0.1527 |
| 39 | ACAT2 | P2 | Human | Breast | IDC | 3.62e-10 | 5.31e-01 | 0.21 |
| 39 | ACAT2 | DCIS2 | Human | Breast | DCIS | 1.23e-26 | -1.59e-03 | 0.0085 |
| 39 | ACAT2 | LZE4T | Human | Esophagus | ESCC | 5.60e-08 | 4.10e-01 | 0.0811 |
| 39 | ACAT2 | LZE7T | Human | Esophagus | ESCC | 5.97e-04 | 9.84e-01 | 0.0667 |
| 39 | ACAT2 | LZE20T | Human | Esophagus | ESCC | 2.55e-04 | -6.69e-02 | 0.0662 |
| 39 | ACAT2 | LZE24T | Human | Esophagus | ESCC | 1.89e-09 | 2.93e-01 | 0.0596 |
| 39 | ACAT2 | LZE6T | Human | Esophagus | ESCC | 3.94e-09 | 4.04e-01 | 0.0845 |
| Page: 1 2 3 4 5 6 |
| Tissue | Expression Dynamics | Abbreviation |
| Breast | 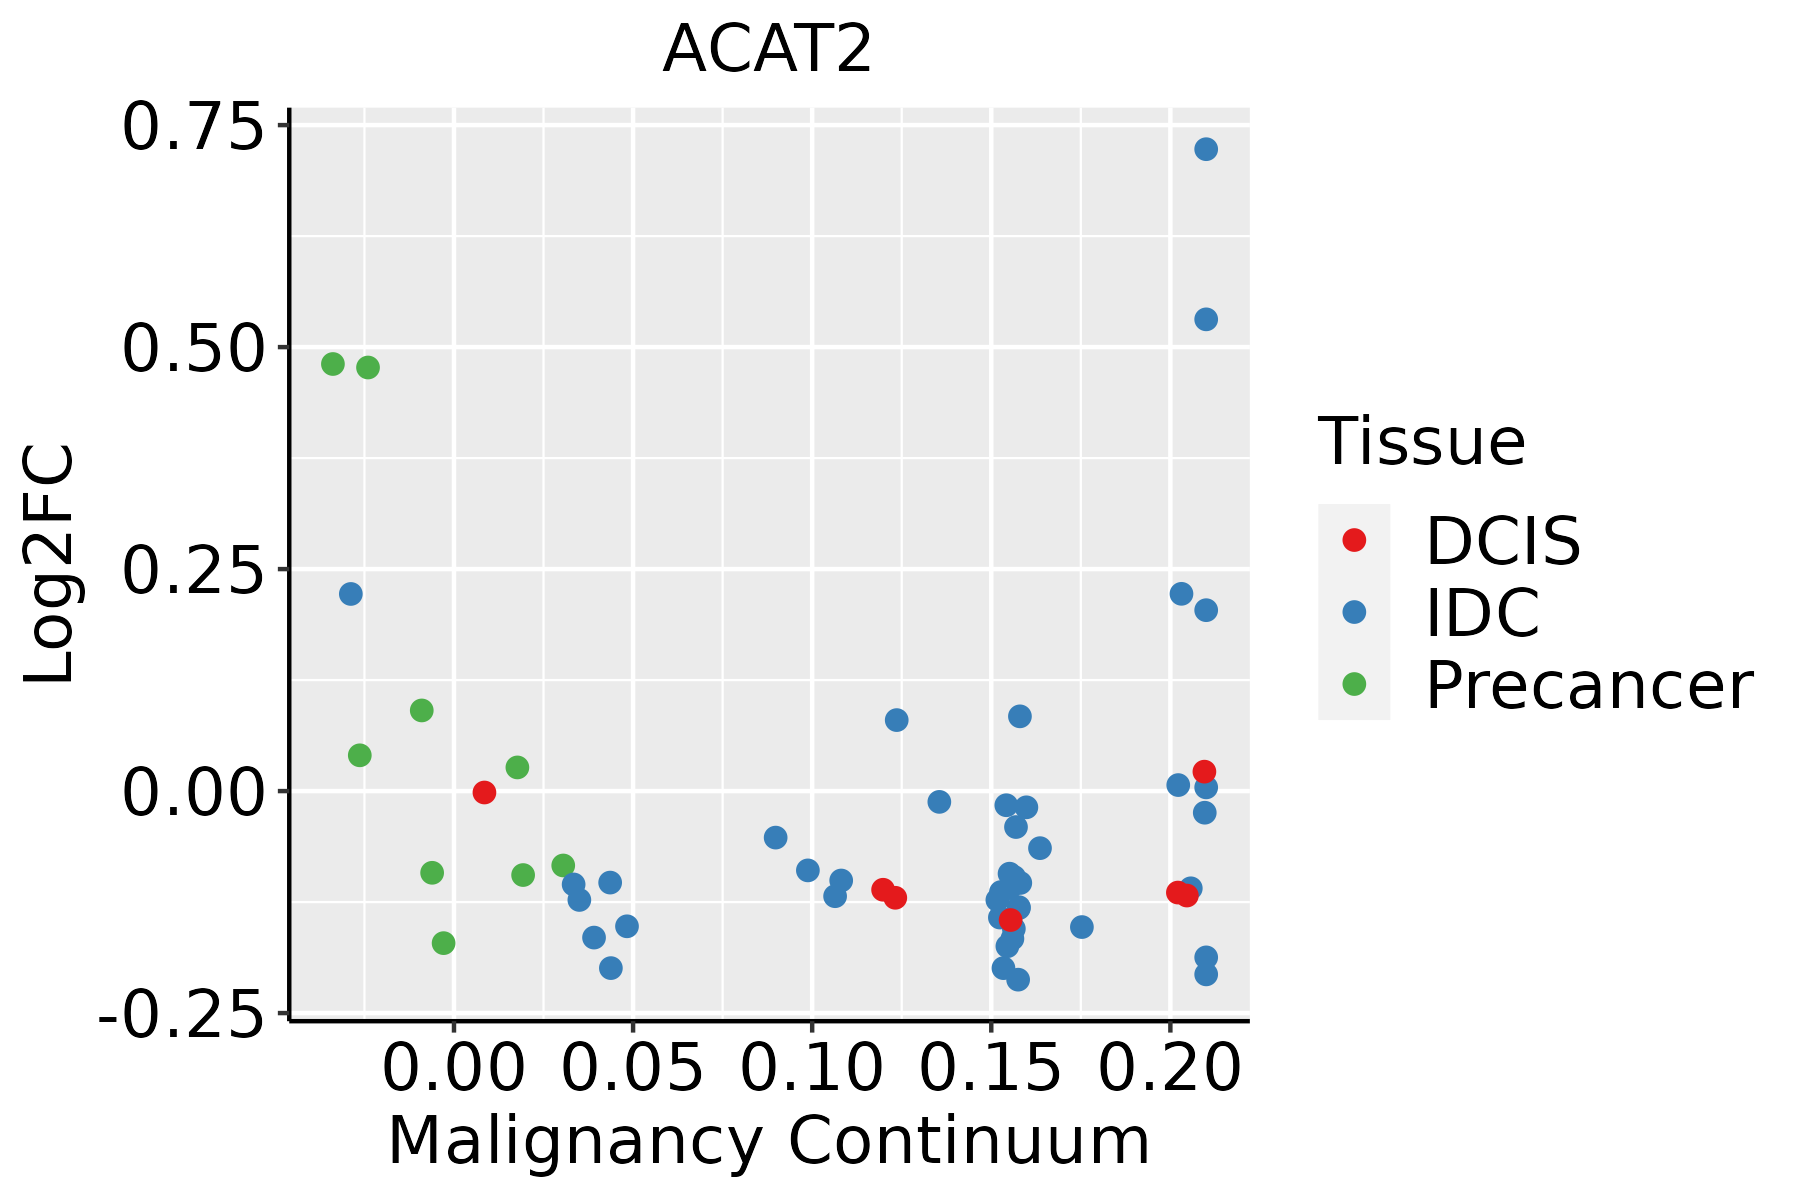 | IDC: Invasive ductal carcinoma |
| DCIS: Ductal carcinoma in situ | ||
| Precancer(BRCA1-mut): Precancerous lesion from BRCA1 mutation carriers | ||
| Esophagus | 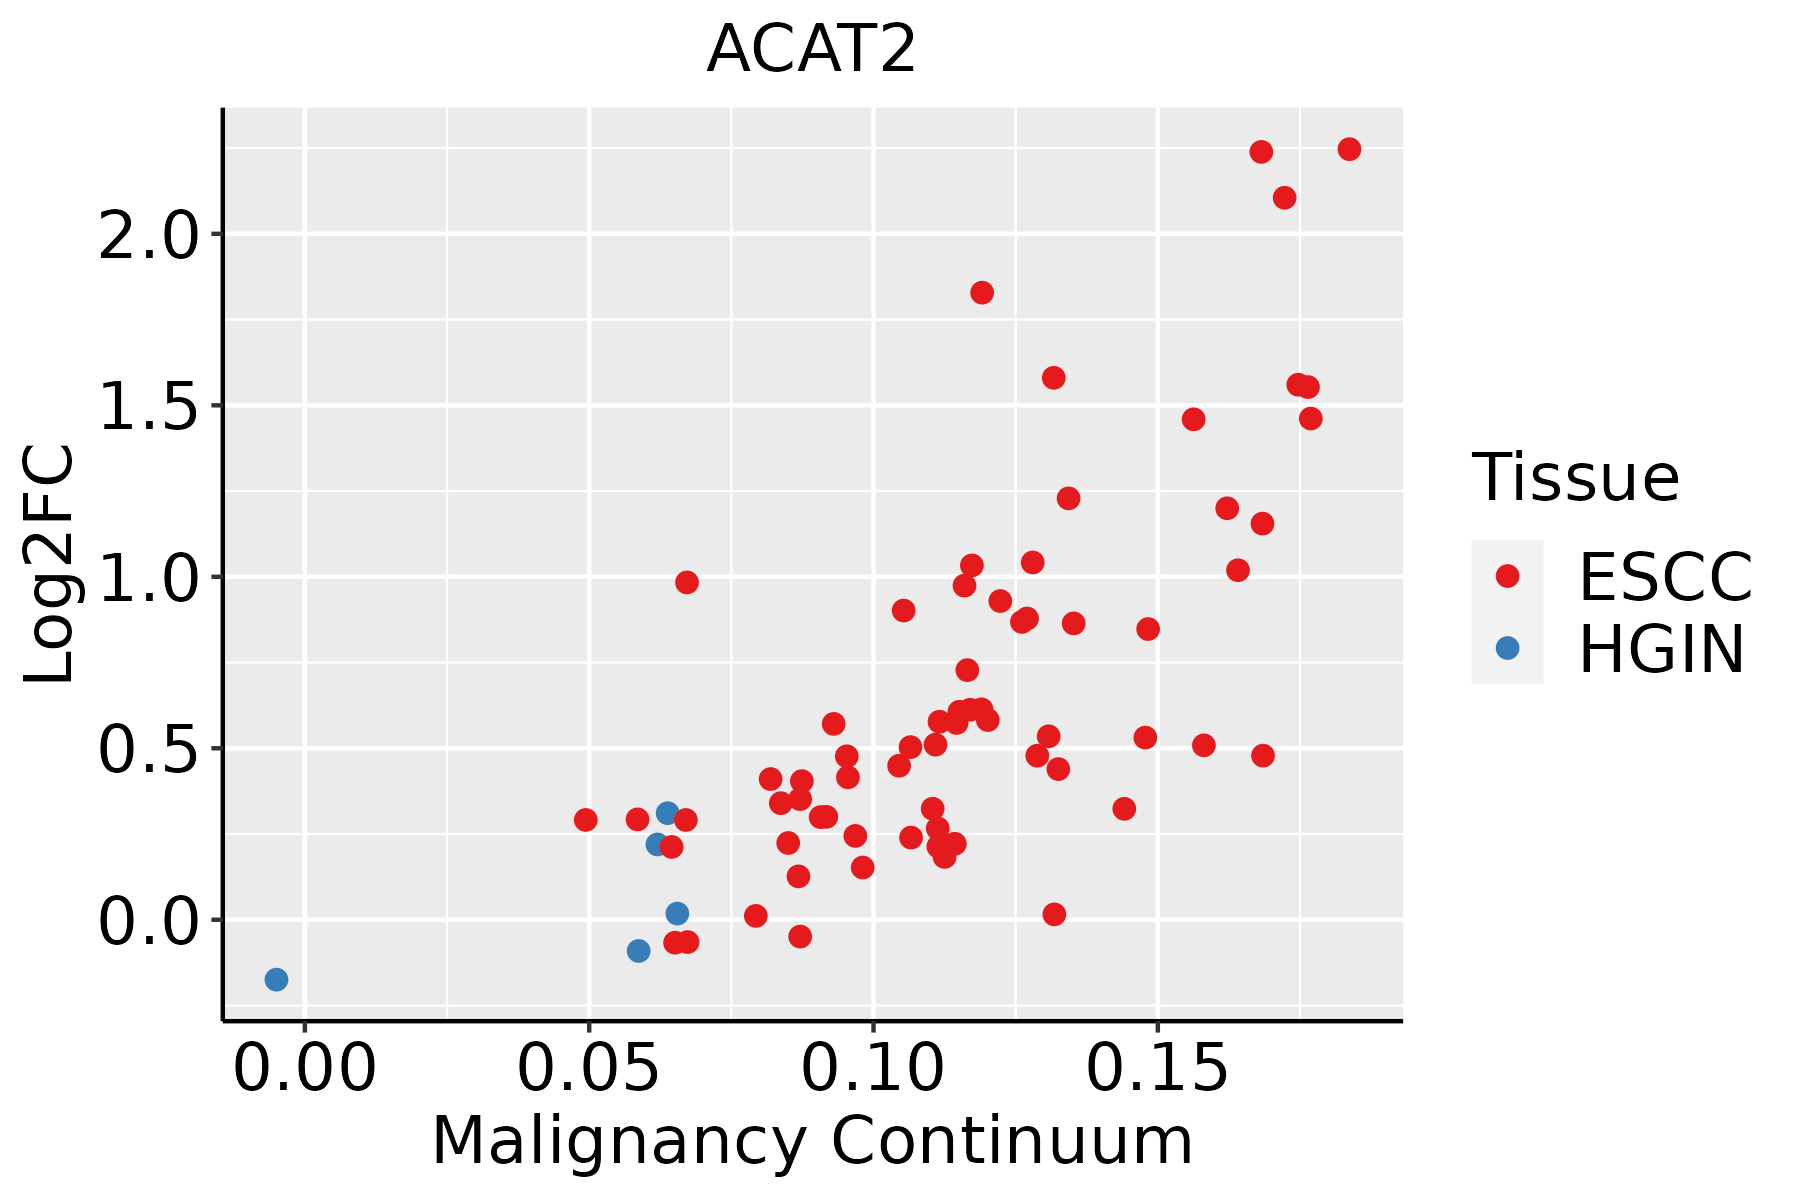 | ESCC: Esophageal squamous cell carcinoma |
| HGIN: High-grade intraepithelial neoplasias | ||
| LGIN: Low-grade intraepithelial neoplasias | ||
| Liver |  | HCC: Hepatocellular carcinoma |
| NAFLD: Non-alcoholic fatty liver disease | ||
| Oral Cavity |  | EOLP: Erosive Oral lichen planus |
| LP: leukoplakia | ||
| NEOLP: Non-erosive oral lichen planus | ||
| OSCC: Oral squamous cell carcinoma | ||
| Skin | 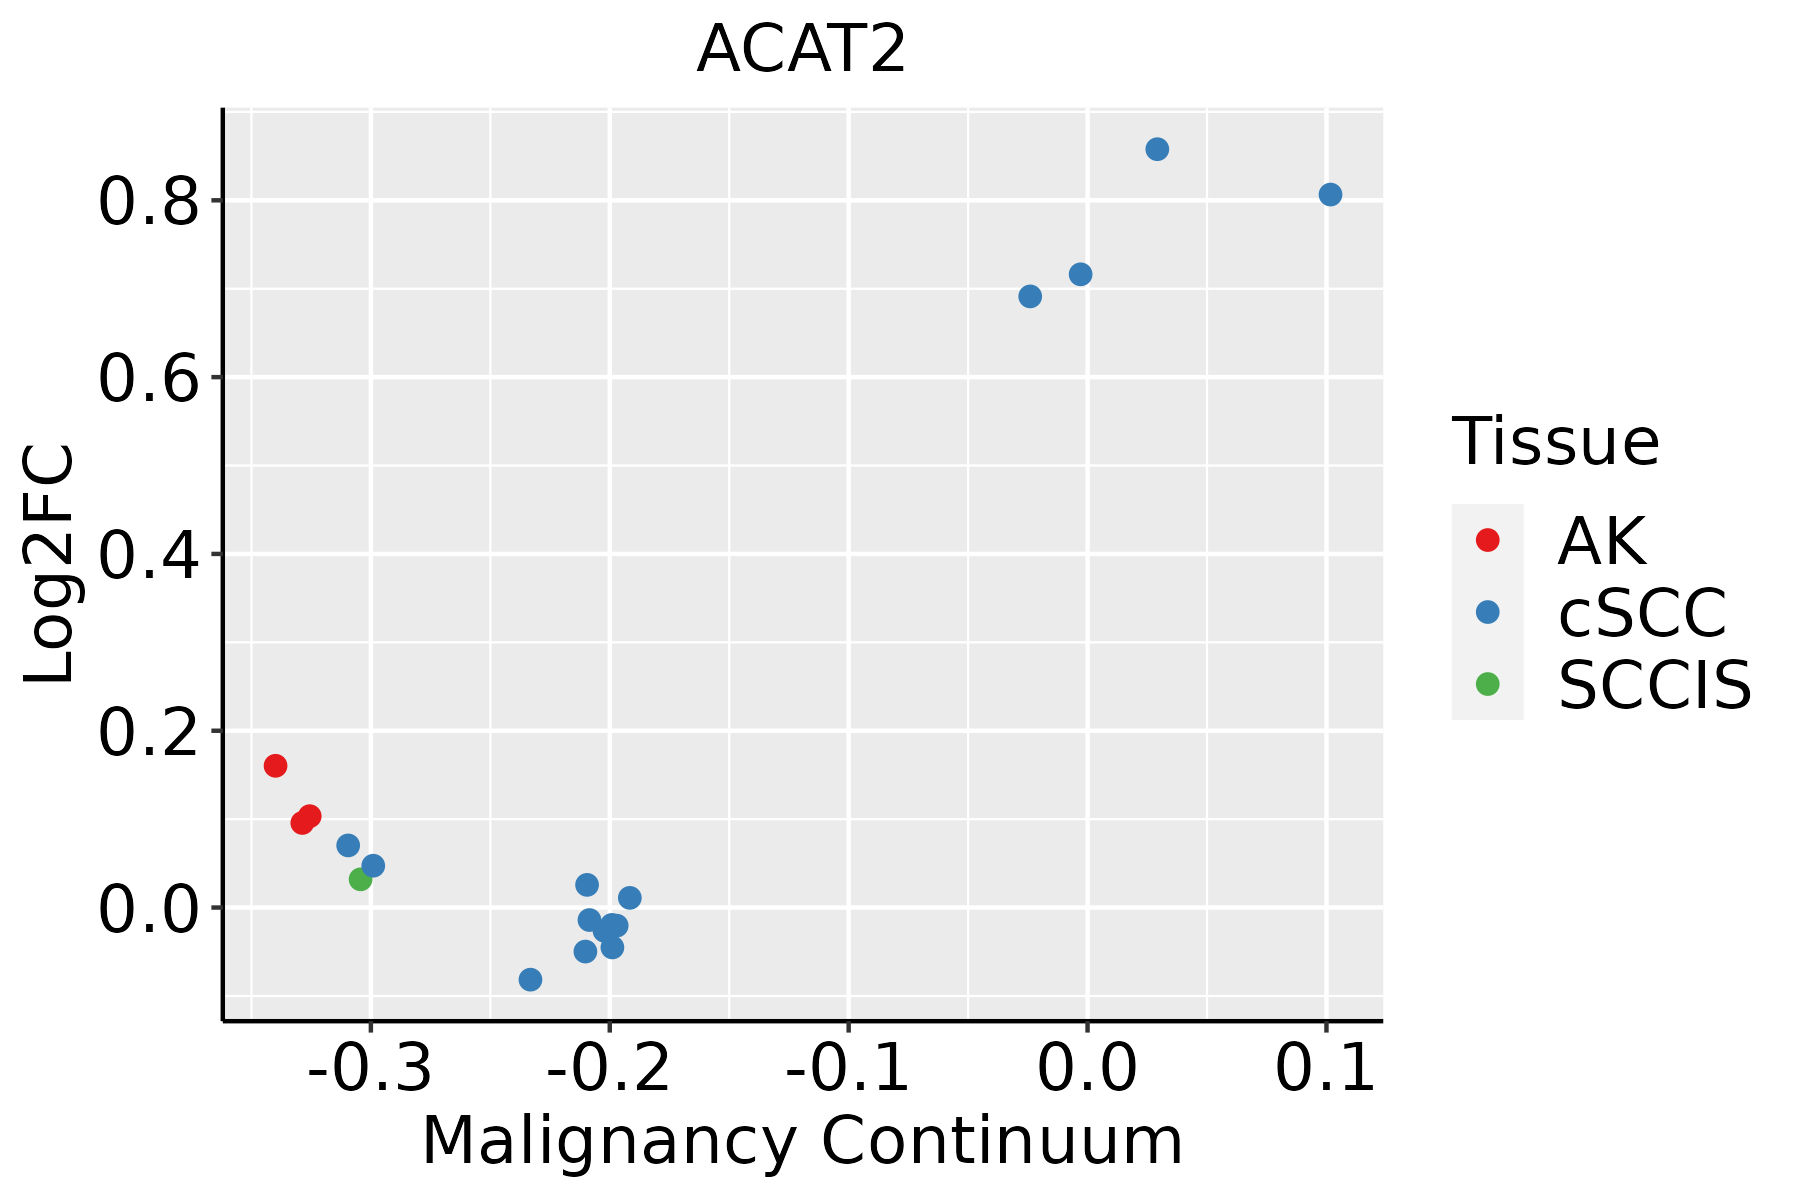 | AK: Actinic keratosis |
| cSCC: Cutaneous squamous cell carcinoma | ||
| SCCIS:squamous cell carcinoma in situ |
| ∗log2FC in expression of this searched gene in stem-like cells from each diseased tissue sample relative to stem-like cells in normal samples in each tissue plotted against the malignancy continuum. Samples are colored based on if they are from different disease stage. |
Top |
Malignant transformation related pathway analysis |
| Find out the enriched GO biological processes and KEGG pathways involved in transition from healthy to precancer to cancer |
| Tissue | Disease Stage | Enriched GO biological Processes |
| Liver | Cyst |  |
| Lung | IAC |  |
| Lung | AIS |  |
| Lung | AAH |  |
| Lung | MIAC |  |
| ∗Top 15 enriched GO BP terms are showed in the bar plot of each disease state in each tissue. Each row represents a significant GO biological process which is colored according to the -log10(p.adjust). |
| Page: 1 2 3 4 5 6 7 8 9 |
| GO ID | Tissue | Disease Stage | Description | Gene Ratio | Bg Ratio | pvalue | p.adjust | Count |
| GO:00193958 | Esophagus | ESCC | fatty acid oxidation | 69/8552 | 103/18723 | 9.95e-06 | 9.44e-05 | 69 |
| GO:00344407 | Esophagus | ESCC | lipid oxidation | 71/8552 | 108/18723 | 2.00e-05 | 1.74e-04 | 71 |
| GO:00090628 | Esophagus | ESCC | fatty acid catabolic process | 66/8552 | 100/18723 | 3.21e-05 | 2.66e-04 | 66 |
| GO:00066318 | Esophagus | ESCC | fatty acid metabolic process | 217/8552 | 390/18723 | 4.21e-05 | 3.39e-04 | 217 |
| GO:00066358 | Esophagus | ESCC | fatty acid beta-oxidation | 50/8552 | 74/18723 | 1.16e-04 | 8.04e-04 | 50 |
| GO:00723297 | Esophagus | ESCC | monocarboxylic acid catabolic process | 74/8552 | 122/18723 | 6.03e-04 | 3.27e-03 | 74 |
| GO:00442427 | Esophagus | ESCC | cellular lipid catabolic process | 121/8552 | 214/18723 | 8.63e-04 | 4.43e-03 | 121 |
| GO:00442827 | Esophagus | ESCC | small molecule catabolic process | 201/8552 | 376/18723 | 1.35e-03 | 6.41e-03 | 201 |
| GO:00302586 | Esophagus | ESCC | lipid modification | 116/8552 | 212/18723 | 4.90e-03 | 1.89e-02 | 116 |
| GO:00160427 | Esophagus | ESCC | lipid catabolic process | 168/8552 | 320/18723 | 7.97e-03 | 2.84e-02 | 168 |
| GO:000663112 | Liver | Cirrhotic | fatty acid metabolic process | 165/4634 | 390/18723 | 1.29e-14 | 1.26e-12 | 165 |
| GO:004428211 | Liver | Cirrhotic | small molecule catabolic process | 151/4634 | 376/18723 | 2.20e-11 | 1.34e-09 | 151 |
| GO:001605411 | Liver | Cirrhotic | organic acid catabolic process | 104/4634 | 240/18723 | 1.91e-10 | 9.53e-09 | 104 |
| GO:004639511 | Liver | Cirrhotic | carboxylic acid catabolic process | 102/4634 | 236/18723 | 3.41e-10 | 1.63e-08 | 102 |
| GO:001939512 | Liver | Cirrhotic | fatty acid oxidation | 53/4634 | 103/18723 | 4.73e-09 | 1.88e-07 | 53 |
| GO:003444011 | Liver | Cirrhotic | lipid oxidation | 53/4634 | 108/18723 | 3.85e-08 | 1.27e-06 | 53 |
| GO:007232911 | Liver | Cirrhotic | monocarboxylic acid catabolic process | 56/4634 | 122/18723 | 2.87e-07 | 7.01e-06 | 56 |
| GO:000906211 | Liver | Cirrhotic | fatty acid catabolic process | 48/4634 | 100/18723 | 3.87e-07 | 9.13e-06 | 48 |
| GO:000663512 | Liver | Cirrhotic | fatty acid beta-oxidation | 38/4634 | 74/18723 | 7.41e-07 | 1.57e-05 | 38 |
| GO:004424212 | Liver | Cirrhotic | cellular lipid catabolic process | 82/4634 | 214/18723 | 6.91e-06 | 1.08e-04 | 82 |
| Page: 1 2 3 |
| Pathway ID | Tissue | Disease Stage | Description | Gene Ratio | Bg Ratio | pvalue | p.adjust | qvalue | Count |
| hsa0120012 | Breast | Precancer | Carbon metabolism | 18/684 | 115/8465 | 4.79e-03 | 2.75e-02 | 2.11e-02 | 18 |
| hsa0120013 | Breast | Precancer | Carbon metabolism | 18/684 | 115/8465 | 4.79e-03 | 2.75e-02 | 2.11e-02 | 18 |
| hsa0120023 | Esophagus | ESCC | Carbon metabolism | 79/4205 | 115/8465 | 2.50e-05 | 1.21e-04 | 6.22e-05 | 79 |
| hsa009005 | Esophagus | ESCC | Terpenoid backbone biosynthesis | 20/4205 | 23/8465 | 2.14e-04 | 7.87e-04 | 4.03e-04 | 20 |
| hsa012129 | Esophagus | ESCC | Fatty acid metabolism | 41/4205 | 57/8465 | 5.13e-04 | 1.75e-03 | 8.98e-04 | 41 |
| hsa002809 | Esophagus | ESCC | Valine, leucine and isoleucine degradation | 34/4205 | 48/8465 | 2.34e-03 | 6.54e-03 | 3.35e-03 | 34 |
| hsa0062023 | Esophagus | ESCC | Pyruvate metabolism | 32/4205 | 47/8465 | 8.11e-03 | 1.94e-02 | 9.94e-03 | 32 |
| hsa0031010 | Esophagus | ESCC | Lysine degradation | 41/4205 | 63/8465 | 9.63e-03 | 2.27e-02 | 1.16e-02 | 41 |
| hsa006306 | Esophagus | ESCC | Glyoxylate and dicarboxylate metabolism | 21/4205 | 30/8465 | 1.95e-02 | 4.35e-02 | 2.23e-02 | 21 |
| hsa0120033 | Esophagus | ESCC | Carbon metabolism | 79/4205 | 115/8465 | 2.50e-05 | 1.21e-04 | 6.22e-05 | 79 |
| hsa0090012 | Esophagus | ESCC | Terpenoid backbone biosynthesis | 20/4205 | 23/8465 | 2.14e-04 | 7.87e-04 | 4.03e-04 | 20 |
| hsa0121214 | Esophagus | ESCC | Fatty acid metabolism | 41/4205 | 57/8465 | 5.13e-04 | 1.75e-03 | 8.98e-04 | 41 |
| hsa0028014 | Esophagus | ESCC | Valine, leucine and isoleucine degradation | 34/4205 | 48/8465 | 2.34e-03 | 6.54e-03 | 3.35e-03 | 34 |
| hsa0062033 | Esophagus | ESCC | Pyruvate metabolism | 32/4205 | 47/8465 | 8.11e-03 | 1.94e-02 | 9.94e-03 | 32 |
| hsa0031013 | Esophagus | ESCC | Lysine degradation | 41/4205 | 63/8465 | 9.63e-03 | 2.27e-02 | 1.16e-02 | 41 |
| hsa0063013 | Esophagus | ESCC | Glyoxylate and dicarboxylate metabolism | 21/4205 | 30/8465 | 1.95e-02 | 4.35e-02 | 2.23e-02 | 21 |
| hsa0120021 | Liver | Cirrhotic | Carbon metabolism | 64/2530 | 115/8465 | 6.37e-09 | 1.18e-07 | 7.26e-08 | 64 |
| hsa0007121 | Liver | Cirrhotic | Fatty acid degradation | 29/2530 | 43/8465 | 3.87e-07 | 4.95e-06 | 3.05e-06 | 29 |
| hsa006208 | Liver | Cirrhotic | Pyruvate metabolism | 29/2530 | 47/8465 | 5.90e-06 | 5.95e-05 | 3.67e-05 | 29 |
| hsa012122 | Liver | Cirrhotic | Fatty acid metabolism | 32/2530 | 57/8465 | 3.12e-05 | 2.47e-04 | 1.52e-04 | 32 |
| Page: 1 2 3 4 |
Top |
Cell-cell communication analysis |
| Identification of potential cell-cell interactions between two cell types and their ligand-receptor pairs for different disease states |
| Ligand | Receptor | LRpair | Pathway | Tissue | Disease Stage |
| Page: 1 |
Top |
Single-cell gene regulatory network inference analysis |
| Find out the significant the regulons (TFs) and the target genes of each regulon across cell types for different disease states |
| TF | Cell Type | Tissue | Disease Stage | Target Gene | RSS | Regulon Activity |
| ∗The dot plots of a searched regulon are shown for all cell subpopulations in each disease state of each tissue based on the regulon specific score inferred using pySCENIC and by calculating the average expression. |
| Page: 1 |
Top |
Somatic mutation of malignant transformation related genes |
| Annotation of somatic variants for genes involved in malignant transformation |
| Hugo Symbol | Variant Class | Variant Classification | dbSNP RS | HGVSc | HGVSp | HGVSp Short | SWISSPROT | BIOTYPE | SIFT | PolyPhen | Tumor Sample Barcode | Tissue | Histology | Sex | Age | Stage | Therapy Types | Drugs | Outcome |
| ACAT2 | insertion | Nonsense_Mutation | novel | c.792_793insTGTATTTTTCCAGTACCAGAAACTCCCAATACCTCCTTGTGAAGCCC | p.Lys265CysfsTer14 | p.K265Cfs*14 | Q9BWD1 | protein_coding | TCGA-A8-A0A1-01 | Breast | breast invasive carcinoma | Female | >=65 | I/II | Hormone Therapy | tamoxiphen | SD | ||
| ACAT2 | insertion | Nonsense_Mutation | novel | c.42_43insTCCCACTTCAGGCTTCCGAGTACCTGAGACTATAGGCATATACTA | p.Ala14_Arg15insSerHisPheArgLeuProSerThrTerAspTyrArgHisIleLeu | p.A14_R15insSHFRLPST*DYRHIL | Q9BWD1 | protein_coding | TCGA-BH-A0EB-01 | Breast | breast invasive carcinoma | Female | >=65 | I/II | Hormone Therapy | arimidex | SD | ||
| ACAT2 | SNV | Missense_Mutation | c.63N>A | p.Phe21Leu | p.F21L | Q9BWD1 | protein_coding | tolerated(0.06) | benign(0.006) | TCGA-EK-A2PG-01 | Cervix | cervical & endocervical cancer | Female | >=65 | I/II | Unknown | Unknown | SD | |
| ACAT2 | SNV | Missense_Mutation | c.985N>T | p.Ala329Ser | p.A329S | Q9BWD1 | protein_coding | deleterious(0.01) | benign(0.125) | TCGA-AA-3715-01 | Colorectum | colon adenocarcinoma | Male | >=65 | I/II | Unknown | Unknown | PD | |
| ACAT2 | SNV | Missense_Mutation | c.1087N>A | p.Leu363Ile | p.L363I | Q9BWD1 | protein_coding | deleterious(0.01) | possibly_damaging(0.477) | TCGA-AA-A010-01 | Colorectum | colon adenocarcinoma | Female | <65 | I/II | Chemotherapy | folinic | CR | |
| ACAT2 | SNV | Missense_Mutation | rs774247391 | c.874N>G | p.Ile292Val | p.I292V | Q9BWD1 | protein_coding | tolerated(0.33) | benign(0.007) | TCGA-AD-6889-01 | Colorectum | colon adenocarcinoma | Male | >=65 | I/II | Chemotherapy | xeloda | PD |
| ACAT2 | SNV | Missense_Mutation | novel | c.1181T>C | p.Val394Ala | p.V394A | Q9BWD1 | protein_coding | deleterious(0.01) | probably_damaging(0.971) | TCGA-CM-6674-01 | Colorectum | colon adenocarcinoma | Male | <65 | I/II | Unknown | Unknown | SD |
| ACAT2 | SNV | Missense_Mutation | rs748574249 | c.838N>G | p.Ile280Val | p.I280V | Q9BWD1 | protein_coding | tolerated(0.07) | benign(0.033) | TCGA-D5-6540-01 | Colorectum | colon adenocarcinoma | Male | >=65 | I/II | Unknown | Unknown | SD |
| ACAT2 | SNV | Missense_Mutation | c.655G>C | p.Asp219His | p.D219H | Q9BWD1 | protein_coding | deleterious(0) | probably_damaging(1) | TCGA-CI-6619-01 | Colorectum | rectum adenocarcinoma | Male | <65 | III/IV | Unknown | Unknown | SD | |
| ACAT2 | insertion | Frame_Shift_Ins | novel | c.890_891insG | p.Ile298AsnfsTer19 | p.I298Nfs*19 | Q9BWD1 | protein_coding | TCGA-AA-3821-01 | Colorectum | colon adenocarcinoma | Female | >=65 | I/II | Unknown | Unknown | SD |
| Page: 1 2 3 4 |
Top |
Related drugs of malignant transformation related genes |
| Identification of chemicals and drugs interact with genes involved in malignant transfromation |
| (DGIdb 4.0) |
| Entrez ID | Symbol | Category | Interaction Types | Drug Claim Name | Drug Name | PMIDs |
| 39 | ACAT2 | ENZYME | inhibitor | 381118860 |
| Page: 1 |

Copyright 2023-Present -The University of Texas Health Science Center at Houston |