
|
|||||
|
 | |
| |
| |
| |
| |
| |
|
Gene: TENT5A |
Gene summary for TENT5A |
| Gene information | Species | Human | Gene symbol | TENT5A | Gene ID | 55603 |
| Gene name | terminal nucleotidyltransferase 5A | |
| Gene Alias | C6orf37 | |
| Cytomap | 6q14.1 | |
| Gene Type | protein-coding | GO ID | GO:0006139 | UniProtAcc | Q96IP4 |
Top |
Malignant transformation analysis |
| Identification of the aberrant gene expression in precancerous and cancerous lesions by comparing the gene expression of stem-like cells in diseased tissues with normal stem cells |
| Entrez ID | Symbol | Replicates | Species | Organ | Tissue | Adj P-value | Log2FC | Malignancy |
| 55603 | TENT5A | LZE7T | Human | Esophagus | ESCC | 6.33e-03 | 1.95e-01 | 0.0667 |
| 55603 | TENT5A | LZE8T | Human | Esophagus | ESCC | 2.53e-15 | 5.59e-01 | 0.067 |
| 55603 | TENT5A | LZE20T | Human | Esophagus | ESCC | 1.28e-30 | 1.15e+00 | 0.0662 |
| 55603 | TENT5A | LZE22T | Human | Esophagus | ESCC | 1.54e-04 | 4.90e-01 | 0.068 |
| 55603 | TENT5A | LZE24T | Human | Esophagus | ESCC | 5.01e-24 | 7.46e-01 | 0.0596 |
| 55603 | TENT5A | LZE22D3 | Human | Esophagus | HGIN | 1.28e-05 | 6.52e-01 | 0.0653 |
| 55603 | TENT5A | LZE6T | Human | Esophagus | ESCC | 9.07e-08 | 4.91e-01 | 0.0845 |
| 55603 | TENT5A | NAFLD1 | Human | Liver | NAFLD | 6.54e-09 | 7.77e-01 | -0.04 |
| 55603 | TENT5A | HCC1_Meng | Human | Liver | HCC | 4.33e-03 | -1.30e-01 | 0.0246 |
| 55603 | TENT5A | cirrhotic1 | Human | Liver | Cirrhotic | 9.14e-03 | -1.30e-01 | 0.0202 |
| 55603 | TENT5A | cirrhotic2 | Human | Liver | Cirrhotic | 4.33e-03 | -1.30e-01 | 0.0201 |
| 55603 | TENT5A | Pt13.a | Human | Liver | HCC | 4.33e-03 | -1.30e-01 | 0.021 |
| 55603 | TENT5A | Pt14.d | Human | Liver | HCC | 4.33e-03 | -1.30e-01 | 0.0143 |
| 55603 | TENT5A | S014 | Human | Liver | HCC | 2.08e-09 | 5.82e-01 | 0.2254 |
| 55603 | TENT5A | S015 | Human | Liver | HCC | 7.06e-07 | 4.59e-01 | 0.2375 |
| 55603 | TENT5A | S016 | Human | Liver | HCC | 1.23e-03 | 2.55e-01 | 0.2243 |
| 55603 | TENT5A | S027 | Human | Liver | HCC | 3.43e-09 | 9.46e-01 | 0.2446 |
| 55603 | TENT5A | S028 | Human | Liver | HCC | 1.76e-18 | 8.94e-01 | 0.2503 |
| 55603 | TENT5A | S029 | Human | Liver | HCC | 5.76e-17 | 1.11e+00 | 0.2581 |
| 55603 | TENT5A | TD9 | Human | Lung | IAC | 8.30e-17 | 1.42e+00 | 0.088 |
| Page: 1 2 3 4 5 |
| Tissue | Expression Dynamics | Abbreviation |
| Esophagus | 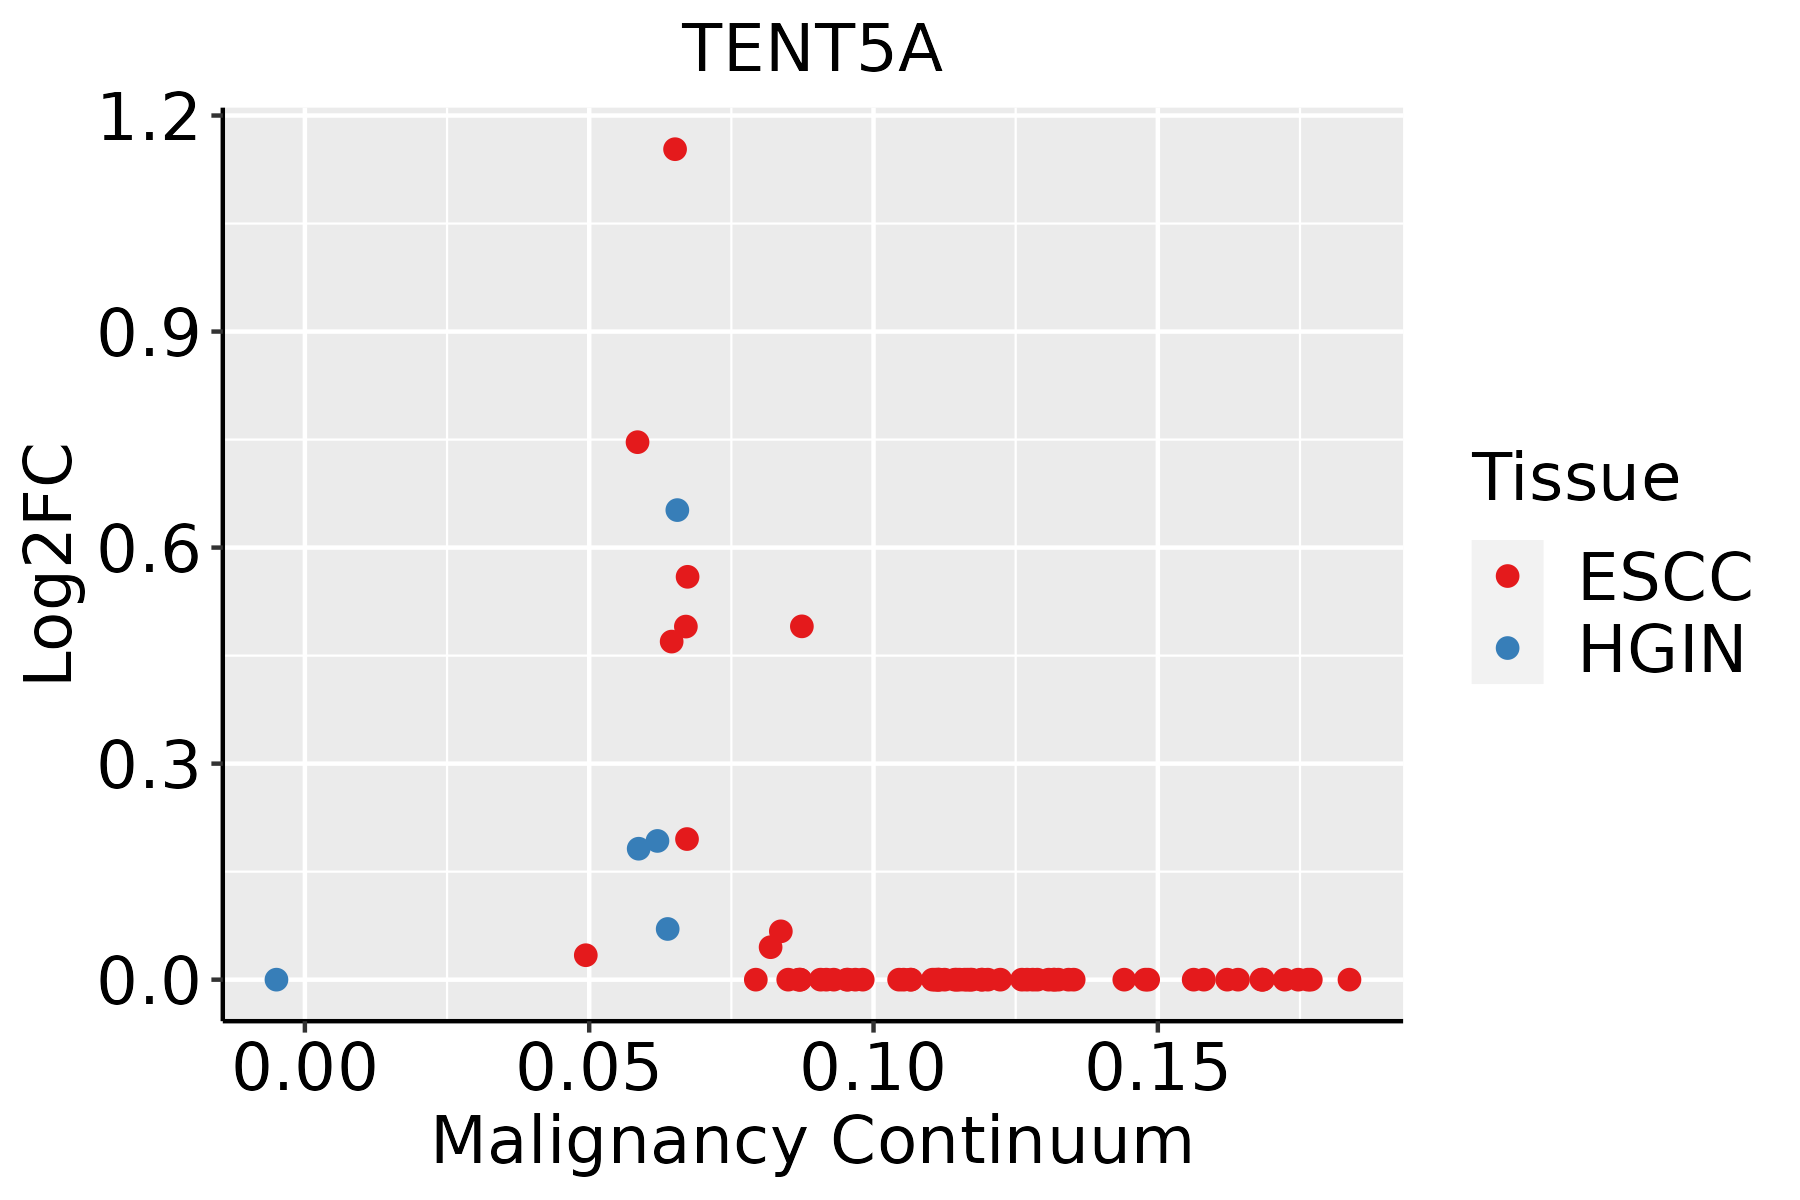 | ESCC: Esophageal squamous cell carcinoma |
| HGIN: High-grade intraepithelial neoplasias | ||
| LGIN: Low-grade intraepithelial neoplasias | ||
| GC |  | CAG: Chronic atrophic gastritis |
| CAG with IM: Chronic atrophic gastritis with intestinal metaplasia | ||
| CSG: Chronic superficial gastritis | ||
| GC: Gastric cancer | ||
| SIM: Severe intestinal metaplasia | ||
| WIM: Wild intestinal metaplasia | ||
| Liver | 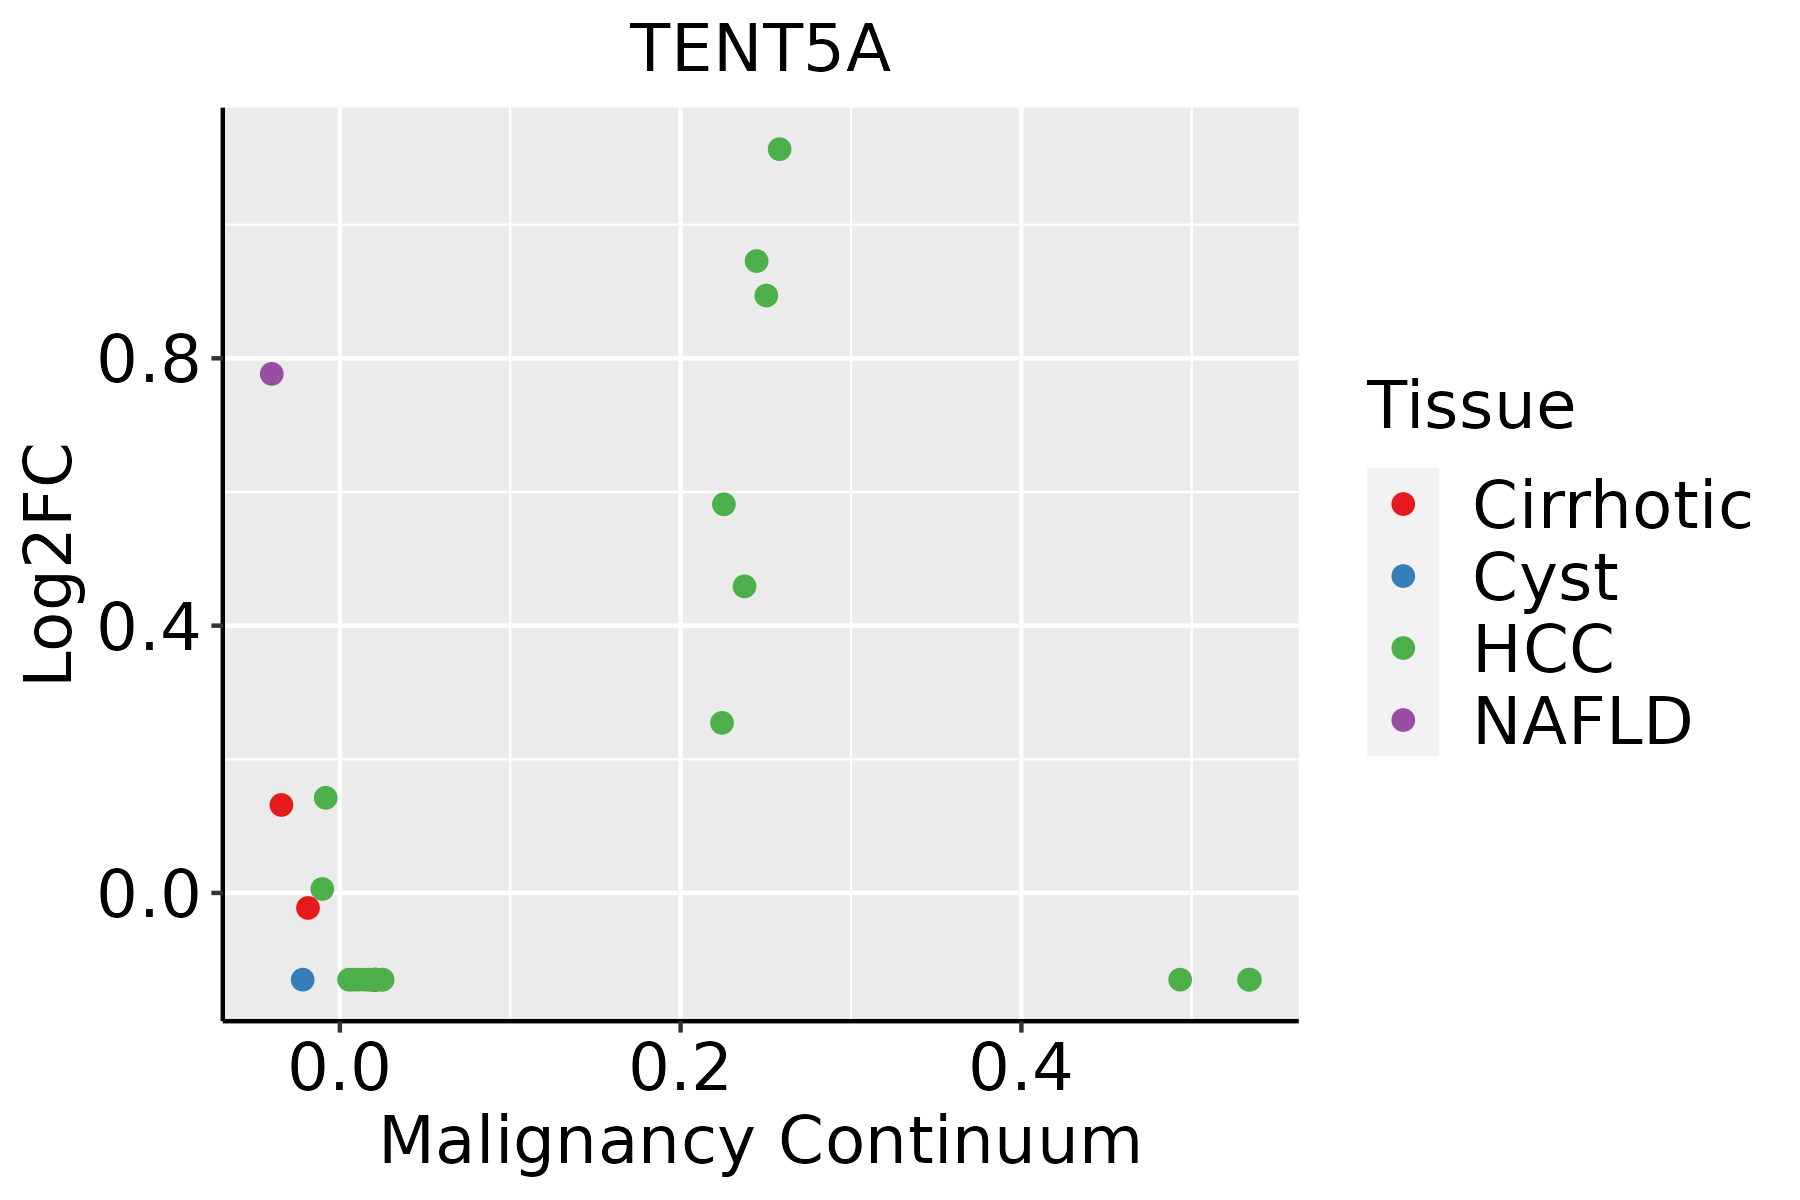 | HCC: Hepatocellular carcinoma |
| NAFLD: Non-alcoholic fatty liver disease | ||
| Lung |  | AAH: Atypical adenomatous hyperplasia |
| AIS: Adenocarcinoma in situ | ||
| IAC: Invasive lung adenocarcinoma | ||
| MIA: Minimally invasive adenocarcinoma | ||
| Oral Cavity | 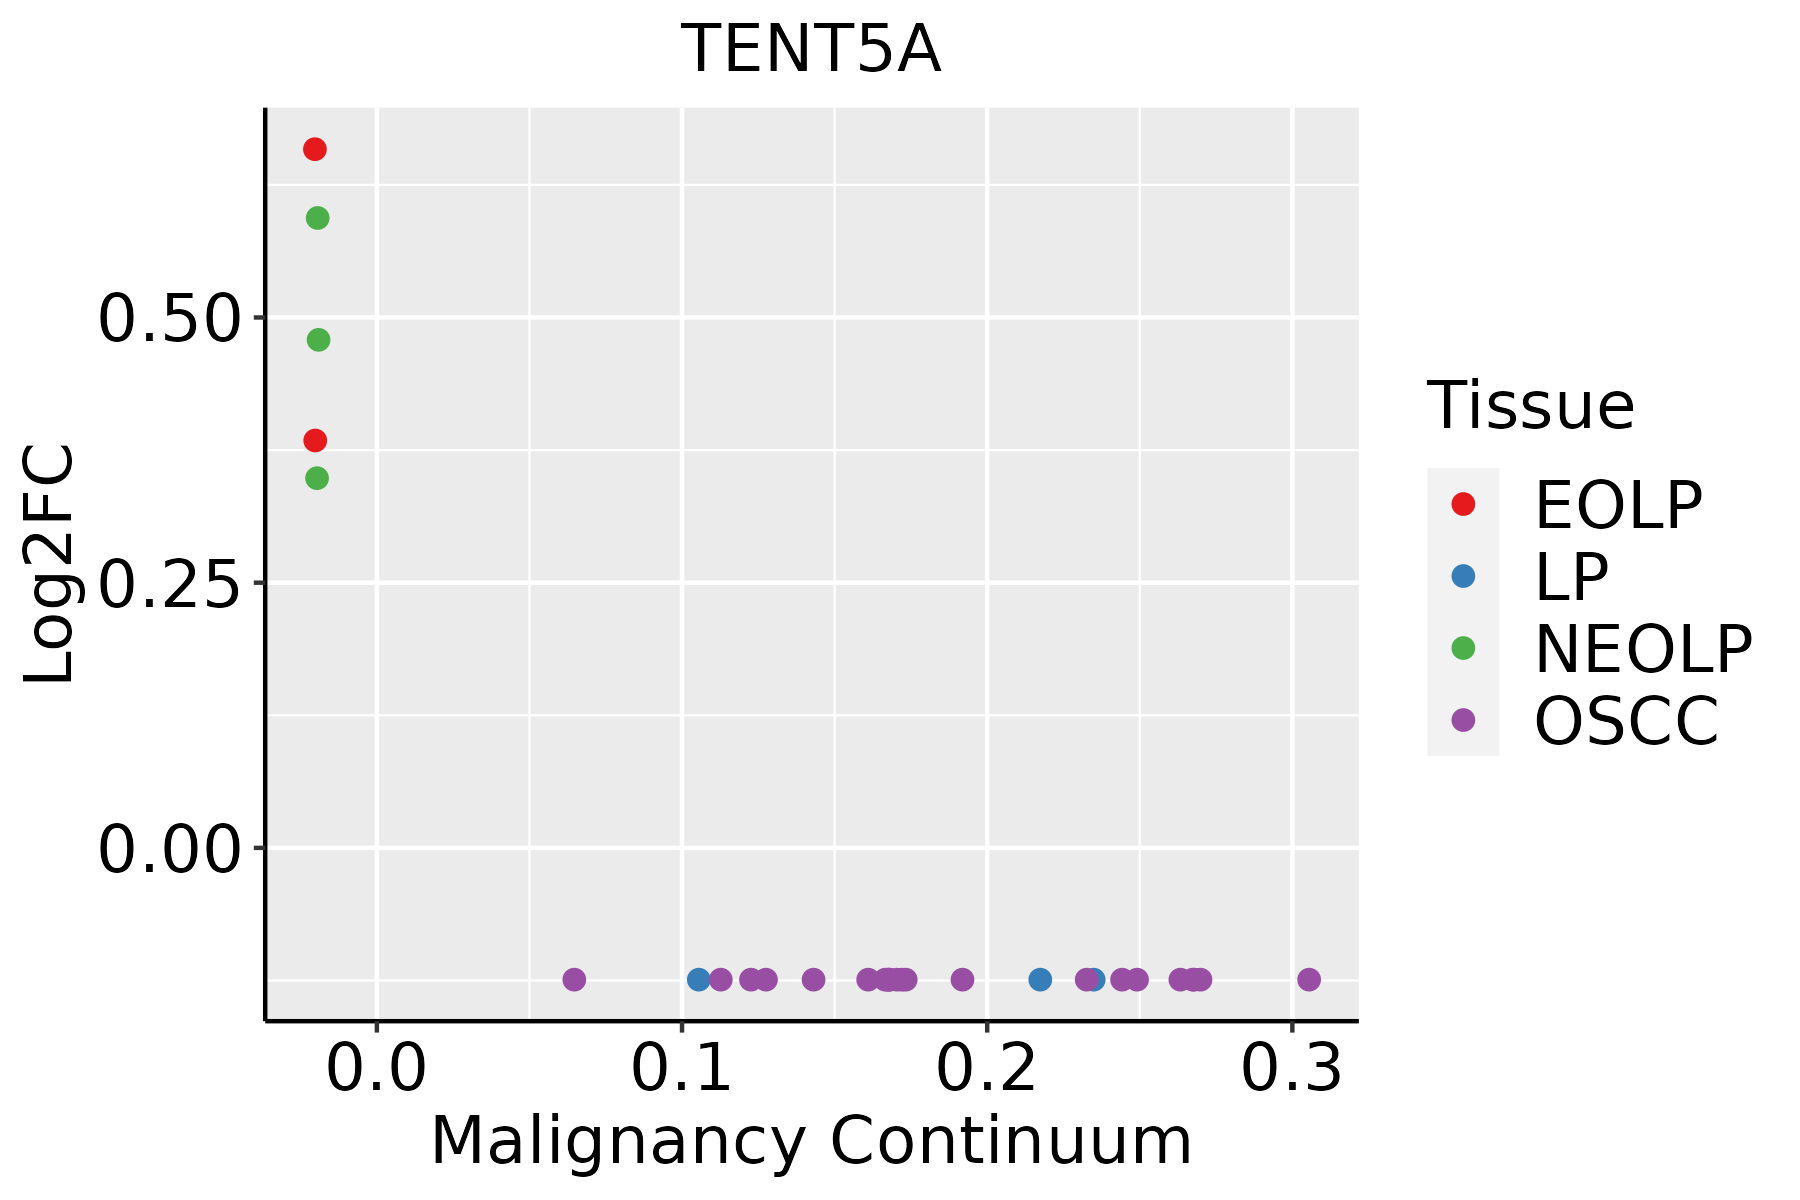 | EOLP: Erosive Oral lichen planus |
| LP: leukoplakia | ||
| NEOLP: Non-erosive oral lichen planus | ||
| OSCC: Oral squamous cell carcinoma | ||
| Thyroid |  | ATC: Anaplastic thyroid cancer |
| HT: Hashimoto's thyroiditis | ||
| PTC: Papillary thyroid cancer |
| ∗log2FC in expression of this searched gene in stem-like cells from each diseased tissue sample relative to stem-like cells in normal samples in each tissue plotted against the malignancy continuum. Samples are colored based on if they are from different disease stage. |
Top |
Malignant transformation related pathway analysis |
| Find out the enriched GO biological processes and KEGG pathways involved in transition from healthy to precancer to cancer |
| Tissue | Disease Stage | Enriched GO biological Processes |
| Stomach | WIM |  |
| Stomach | SIM |  |
| Liver | NAFLD |  |
| Liver | Cirrhotic |  |
| Liver | HCC |  |
| ∗Top 15 enriched GO BP terms are showed in the bar plot of each disease state in each tissue. Each row represents a significant GO biological process which is colored according to the -log10(p.adjust). |
| Page: 1 2 3 4 5 6 7 8 9 |
| GO ID | Tissue | Disease Stage | Description | Gene Ratio | Bg Ratio | pvalue | p.adjust | Count |
| GO:190331120 | Esophagus | HGIN | regulation of mRNA metabolic process | 91/2587 | 288/18723 | 5.06e-15 | 9.78e-13 | 91 |
| GO:000989520 | Esophagus | HGIN | negative regulation of catabolic process | 87/2587 | 320/18723 | 1.74e-10 | 1.68e-08 | 87 |
| GO:003133026 | Esophagus | HGIN | negative regulation of cellular catabolic process | 74/2587 | 262/18723 | 6.27e-10 | 5.30e-08 | 74 |
| GO:000640120 | Esophagus | HGIN | RNA catabolic process | 77/2587 | 278/18723 | 7.63e-10 | 6.36e-08 | 77 |
| GO:000640220 | Esophagus | HGIN | mRNA catabolic process | 67/2587 | 232/18723 | 1.47e-09 | 1.13e-07 | 67 |
| GO:003465519 | Esophagus | HGIN | nucleobase-containing compound catabolic process | 98/2587 | 407/18723 | 1.44e-08 | 8.94e-07 | 98 |
| GO:004670017 | Esophagus | HGIN | heterocycle catabolic process | 103/2587 | 445/18723 | 5.44e-08 | 2.99e-06 | 103 |
| GO:004427018 | Esophagus | HGIN | cellular nitrogen compound catabolic process | 103/2587 | 451/18723 | 1.10e-07 | 5.56e-06 | 103 |
| GO:001943917 | Esophagus | HGIN | aromatic compound catabolic process | 105/2587 | 467/18723 | 1.89e-07 | 9.31e-06 | 105 |
| GO:190136117 | Esophagus | HGIN | organic cyclic compound catabolic process | 106/2587 | 495/18723 | 1.94e-06 | 7.13e-05 | 106 |
| GO:190331226 | Esophagus | HGIN | negative regulation of mRNA metabolic process | 29/2587 | 92/18723 | 1.01e-05 | 2.92e-04 | 29 |
| GO:006101318 | Esophagus | HGIN | regulation of mRNA catabolic process | 43/2587 | 166/18723 | 2.48e-05 | 6.53e-04 | 43 |
| GO:004348818 | Esophagus | HGIN | regulation of mRNA stability | 37/2587 | 158/18723 | 7.53e-04 | 9.97e-03 | 37 |
| GO:004348718 | Esophagus | HGIN | regulation of RNA stability | 39/2587 | 170/18723 | 8.42e-04 | 1.09e-02 | 39 |
| GO:190236915 | Esophagus | HGIN | negative regulation of RNA catabolic process | 21/2587 | 75/18723 | 9.58e-04 | 1.21e-02 | 21 |
| GO:190237314 | Esophagus | HGIN | negative regulation of mRNA catabolic process | 17/2587 | 63/18723 | 4.29e-03 | 3.82e-02 | 17 |
| GO:1903311110 | Esophagus | ESCC | regulation of mRNA metabolic process | 210/8552 | 288/18723 | 3.25e-21 | 5.56e-19 | 210 |
| GO:0006401110 | Esophagus | ESCC | RNA catabolic process | 204/8552 | 278/18723 | 3.39e-21 | 5.66e-19 | 204 |
| GO:0034655110 | Esophagus | ESCC | nucleobase-containing compound catabolic process | 272/8552 | 407/18723 | 2.92e-18 | 2.90e-16 | 272 |
| GO:0006402110 | Esophagus | ESCC | mRNA catabolic process | 170/8552 | 232/18723 | 8.70e-18 | 8.00e-16 | 170 |
| Page: 1 2 3 4 5 6 7 8 9 10 |
| Pathway ID | Tissue | Disease Stage | Description | Gene Ratio | Bg Ratio | pvalue | p.adjust | qvalue | Count |
| Page: 1 |
Top |
Cell-cell communication analysis |
| Identification of potential cell-cell interactions between two cell types and their ligand-receptor pairs for different disease states |
| Ligand | Receptor | LRpair | Pathway | Tissue | Disease Stage |
| Page: 1 |
Top |
Single-cell gene regulatory network inference analysis |
| Find out the significant the regulons (TFs) and the target genes of each regulon across cell types for different disease states |
| TF | Cell Type | Tissue | Disease Stage | Target Gene | RSS | Regulon Activity |
| ∗The dot plots of a searched regulon are shown for all cell subpopulations in each disease state of each tissue based on the regulon specific score inferred using pySCENIC and by calculating the average expression. |
| Page: 1 |
Top |
Somatic mutation of malignant transformation related genes |
| Annotation of somatic variants for genes involved in malignant transformation |
| Hugo Symbol | Variant Class | Variant Classification | dbSNP RS | HGVSc | HGVSp | HGVSp Short | SWISSPROT | BIOTYPE | SIFT | PolyPhen | Tumor Sample Barcode | Tissue | Histology | Sex | Age | Stage | Therapy Types | Drugs | Outcome |
| Page: 1 |
Top |
Related drugs of malignant transformation related genes |
| Identification of chemicals and drugs interact with genes involved in malignant transfromation |
| (DGIdb 4.0) |
| Entrez ID | Symbol | Category | Interaction Types | Drug Claim Name | Drug Name | PMIDs |
| Page: 1 |

Copyright 2023-Present -The University of Texas Health Science Center at Houston |