
|
|||||
|
 | |
| |
| |
| |
| |
| |
|
Gene: SLURP2 |
Gene summary for SLURP2 |
| Gene information | Species | Human | Gene symbol | SLURP2 | Gene ID | 432355 |
| Gene name | secreted LY6/PLAUR domain containing 2 | |
| Gene Alias | SLURP-2 | |
| Cytomap | 8q24.3 | |
| Gene Type | protein-coding | GO ID | GO:0007154 | UniProtAcc | P0DP57 |
Top |
Malignant transformation analysis |
| Identification of the aberrant gene expression in precancerous and cancerous lesions by comparing the gene expression of stem-like cells in diseased tissues with normal stem cells |
| Entrez ID | Symbol | Replicates | Species | Organ | Tissue | Adj P-value | Log2FC | Malignancy |
| 432355 | SLURP2 | HSIL_HPV_2 | Human | Cervix | HSIL_HPV | 1.81e-04 | 1.46e-01 | 0.0208 |
| 432355 | SLURP2 | sample3 | Human | Cervix | CC | 5.79e-157 | 1.95e+00 | 0.1387 |
| 432355 | SLURP2 | H2 | Human | Cervix | HSIL_HPV | 6.70e-14 | 3.67e-01 | 0.0632 |
| 432355 | SLURP2 | L1 | Human | Cervix | CC | 4.08e-11 | 4.65e-01 | 0.0802 |
| 432355 | SLURP2 | T3 | Human | Cervix | CC | 3.82e-154 | 1.98e+00 | 0.1389 |
| 432355 | SLURP2 | AEH-subject1 | Human | Endometrium | AEH | 8.53e-06 | 2.73e-01 | -0.3059 |
| 432355 | SLURP2 | AEH-subject2 | Human | Endometrium | AEH | 2.17e-18 | 5.66e-01 | -0.2525 |
| 432355 | SLURP2 | EEC-subject2 | Human | Endometrium | EEC | 1.73e-27 | 6.42e-01 | -0.2607 |
| Page: 1 |
| Tissue | Expression Dynamics | Abbreviation |
| Cervix | 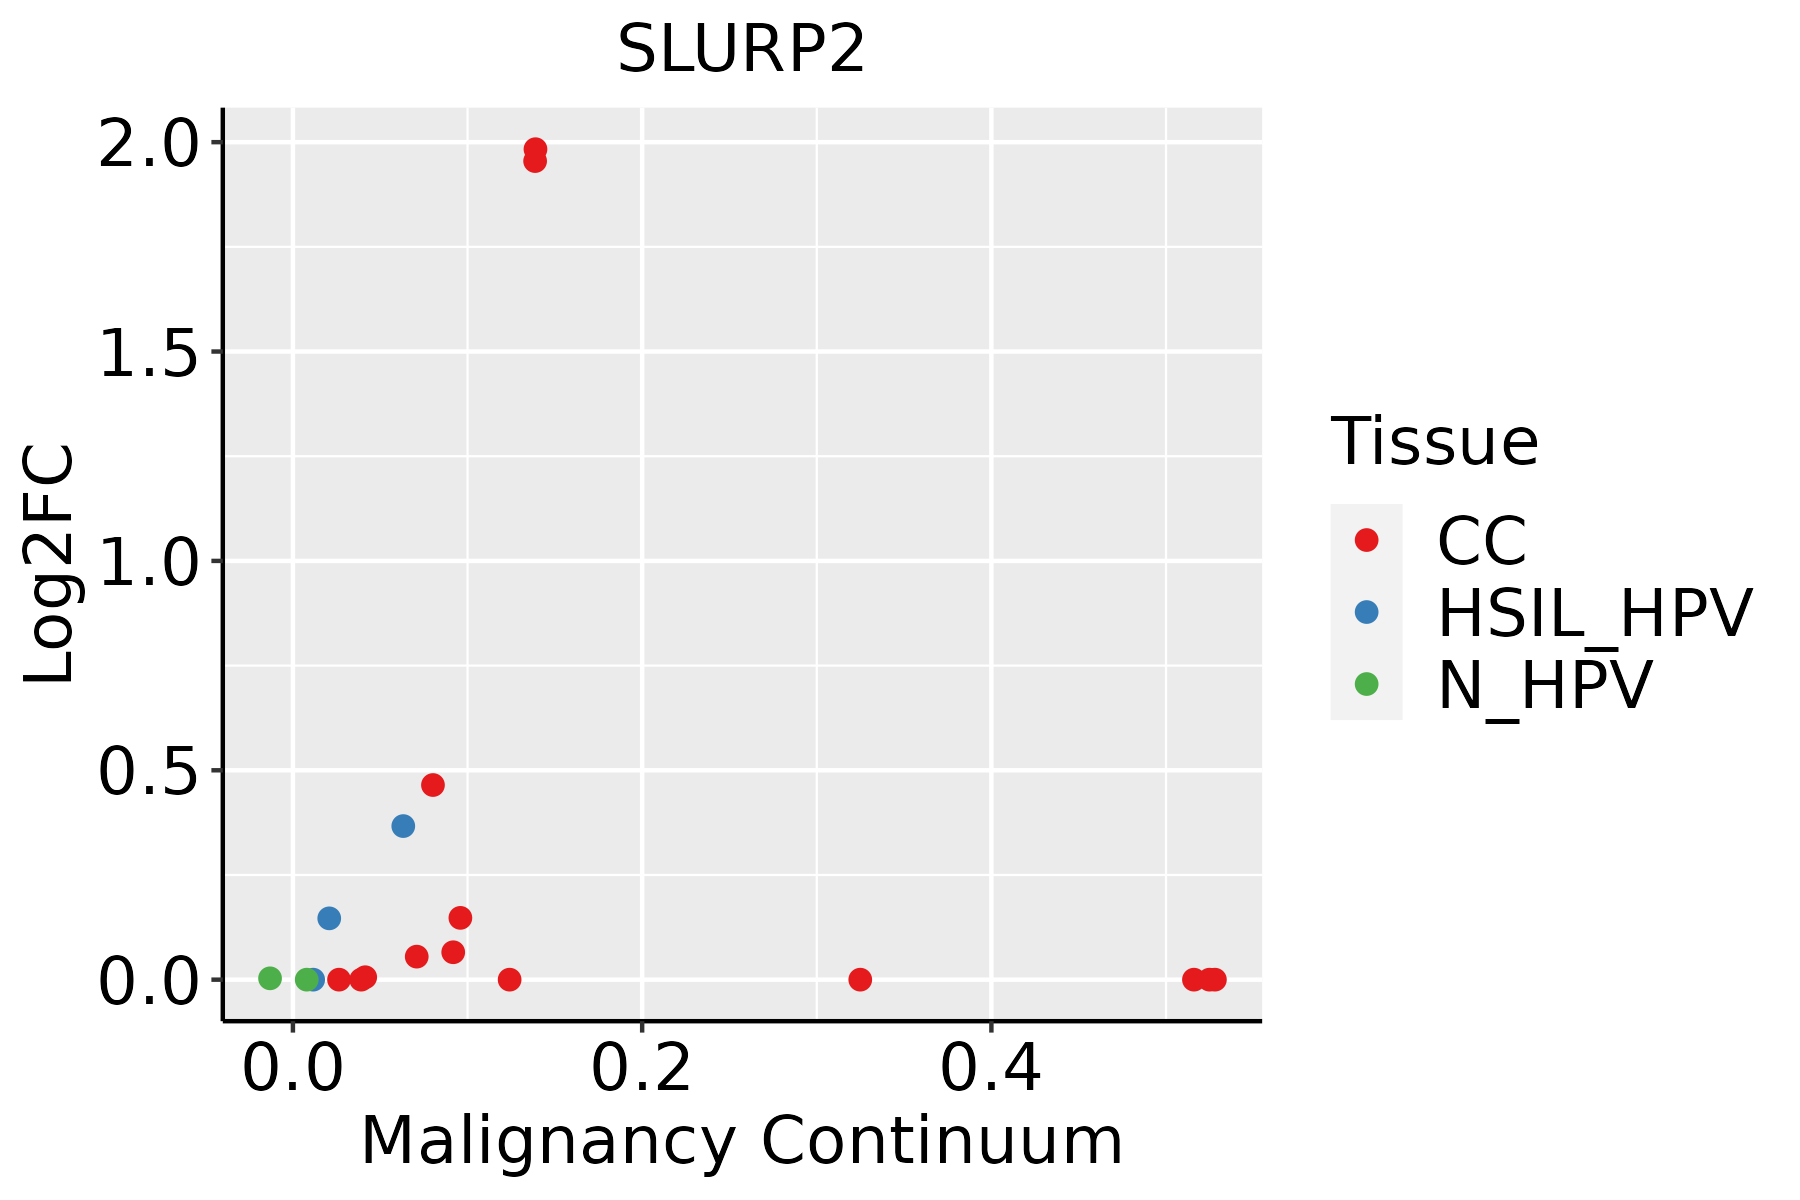 | CC: Cervix cancer |
| HSIL_HPV: HPV-infected high-grade squamous intraepithelial lesions | ||
| N_HPV: HPV-infected normal cervix | ||
| Endometrium | 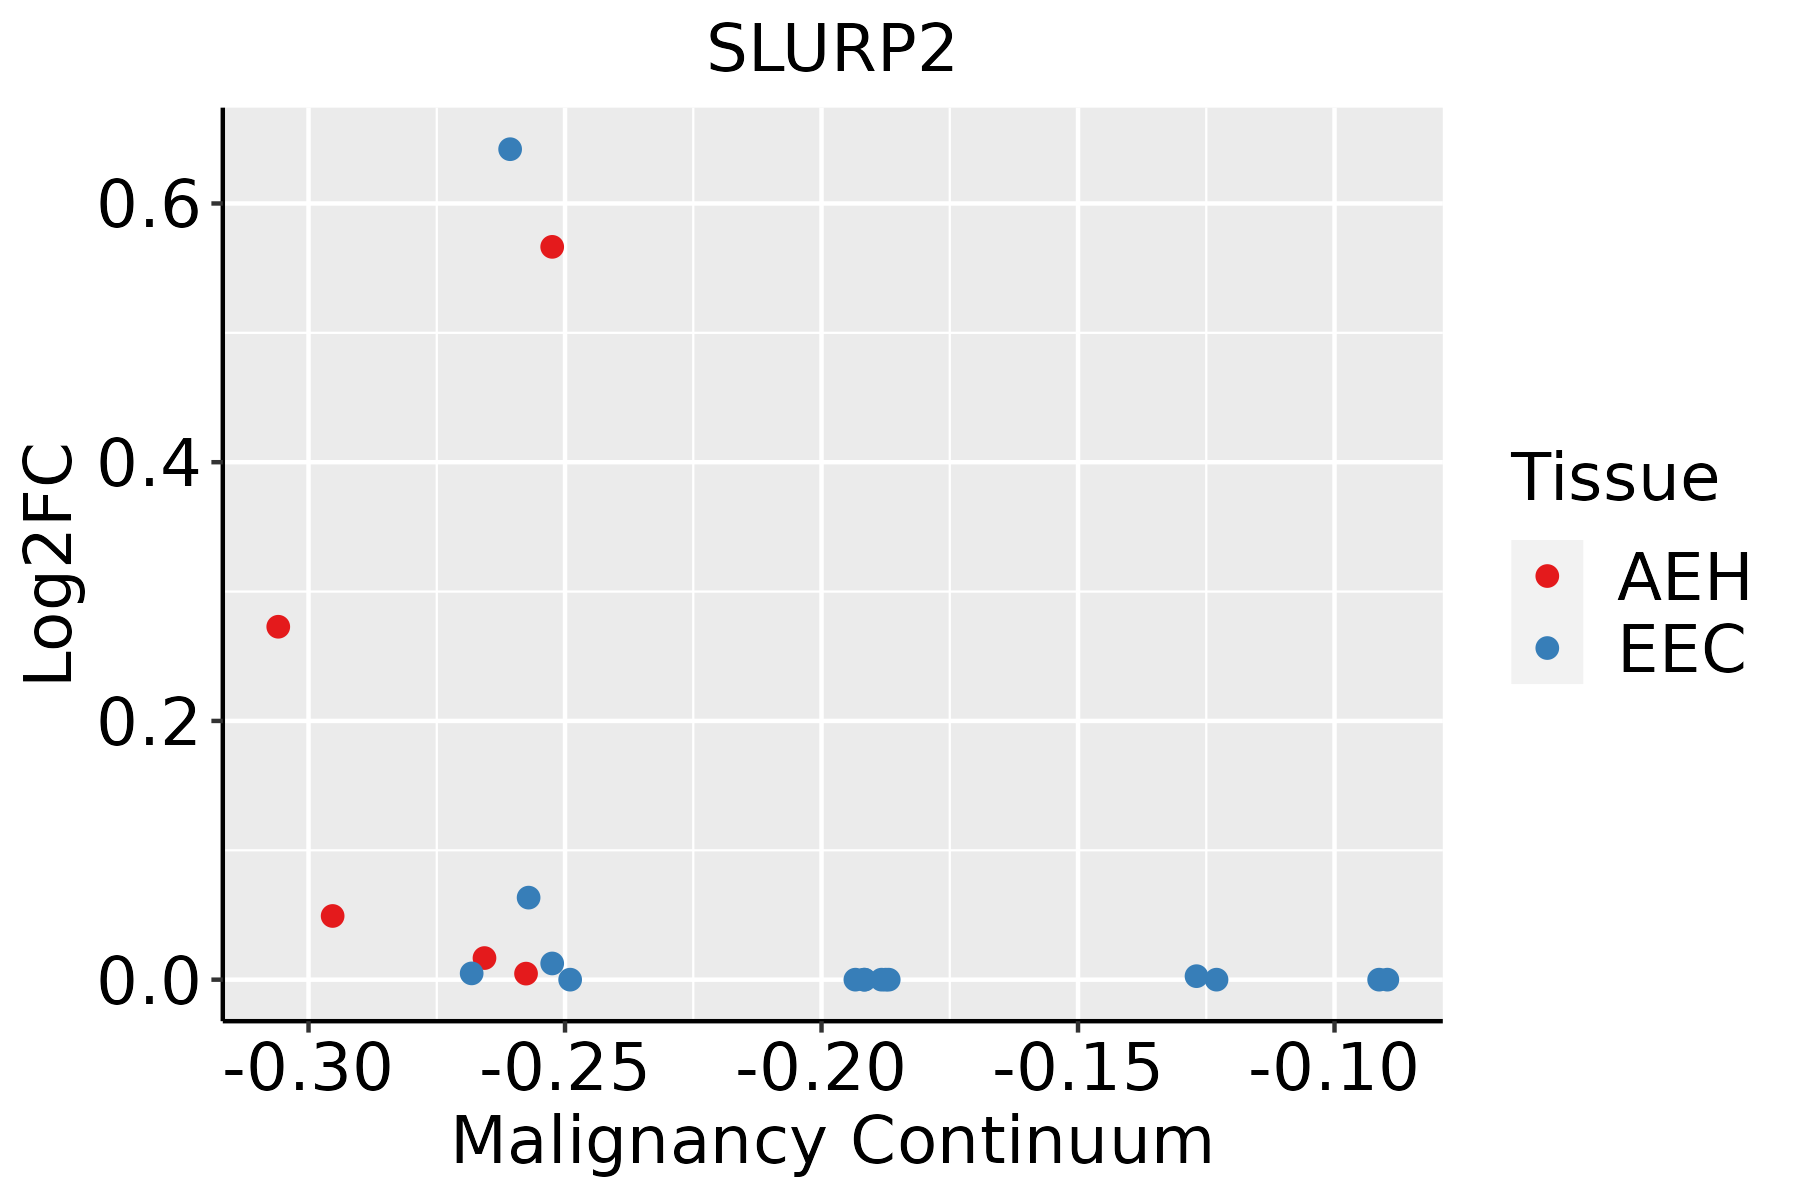 | AEH: Atypical endometrial hyperplasia |
| EEC: Endometrioid Cancer |
| ∗log2FC in expression of this searched gene in stem-like cells from each diseased tissue sample relative to stem-like cells in normal samples in each tissue plotted against the malignancy continuum. Samples are colored based on if they are from different disease stage. |
Top |
Malignant transformation related pathway analysis |
| Find out the enriched GO biological processes and KEGG pathways involved in transition from healthy to precancer to cancer |
| Tissue | Disease Stage | Enriched GO biological Processes |
| Stomach | WIM |  |
| Stomach | SIM |  |
| Liver | NAFLD |  |
| Liver | Cirrhotic |  |
| Liver | HCC |  |
| ∗Top 15 enriched GO BP terms are showed in the bar plot of each disease state in each tissue. Each row represents a significant GO biological process which is colored according to the -log10(p.adjust). |
| Page: 1 2 3 4 5 6 7 8 9 |
| GO ID | Tissue | Disease Stage | Description | Gene Ratio | Bg Ratio | pvalue | p.adjust | Count |
| GO:1905144 | Cervix | CC | response to acetylcholine | 9/2311 | 31/18723 | 1.04e-02 | 4.97e-02 | 9 |
| GO:1905145 | Cervix | CC | cellular response to acetylcholine | 9/2311 | 31/18723 | 1.04e-02 | 4.97e-02 | 9 |
| Page: 1 |
| Pathway ID | Tissue | Disease Stage | Description | Gene Ratio | Bg Ratio | pvalue | p.adjust | qvalue | Count |
| Page: 1 |
Top |
Cell-cell communication analysis |
| Identification of potential cell-cell interactions between two cell types and their ligand-receptor pairs for different disease states |
| Ligand | Receptor | LRpair | Pathway | Tissue | Disease Stage |
| Page: 1 |
Top |
Single-cell gene regulatory network inference analysis |
| Find out the significant the regulons (TFs) and the target genes of each regulon across cell types for different disease states |
| TF | Cell Type | Tissue | Disease Stage | Target Gene | RSS | Regulon Activity |
| ∗The dot plots of a searched regulon are shown for all cell subpopulations in each disease state of each tissue based on the regulon specific score inferred using pySCENIC and by calculating the average expression. |
| Page: 1 |
Top |
Somatic mutation of malignant transformation related genes |
| Annotation of somatic variants for genes involved in malignant transformation |
| Hugo Symbol | Variant Class | Variant Classification | dbSNP RS | HGVSc | HGVSp | HGVSp Short | SWISSPROT | BIOTYPE | SIFT | PolyPhen | Tumor Sample Barcode | Tissue | Histology | Sex | Age | Stage | Therapy Types | Drugs | Outcome |
| Page: 1 |
Top |
Related drugs of malignant transformation related genes |
| Identification of chemicals and drugs interact with genes involved in malignant transfromation |
| (DGIdb 4.0) |
| Entrez ID | Symbol | Category | Interaction Types | Drug Claim Name | Drug Name | PMIDs |
| Page: 1 |

Copyright 2023-Present -The University of Texas Health Science Center at Houston |