
|
|||||
|
 | |
| |
| |
| |
| |
| |
|
Gene: SCIMP |
Gene summary for SCIMP |
| Gene information | Species | Human | Gene symbol | SCIMP | Gene ID | 388325 |
| Gene name | SLP adaptor and CSK interacting membrane protein | |
| Gene Alias | C17orf87 | |
| Cytomap | 17p13.2 | |
| Gene Type | protein-coding | GO ID | GO:0000165 | UniProtAcc | Q6UWF3 |
Top |
Malignant transformation analysis |
| Identification of the aberrant gene expression in precancerous and cancerous lesions by comparing the gene expression of stem-like cells in diseased tissues with normal stem cells |
| Entrez ID | Symbol | Replicates | Species | Organ | Tissue | Adj P-value | Log2FC | Malignancy |
| 388325 | SCIMP | HCC1 | Human | Liver | HCC | 3.26e-03 | 6.27e-01 | 0.5336 |
| 388325 | SCIMP | HCC2 | Human | Liver | HCC | 1.23e-10 | 1.85e+00 | 0.5341 |
| 388325 | SCIMP | HCC5 | Human | Liver | HCC | 1.88e-04 | 5.70e-01 | 0.4932 |
| Page: 1 |
| Tissue | Expression Dynamics | Abbreviation |
| Liver | 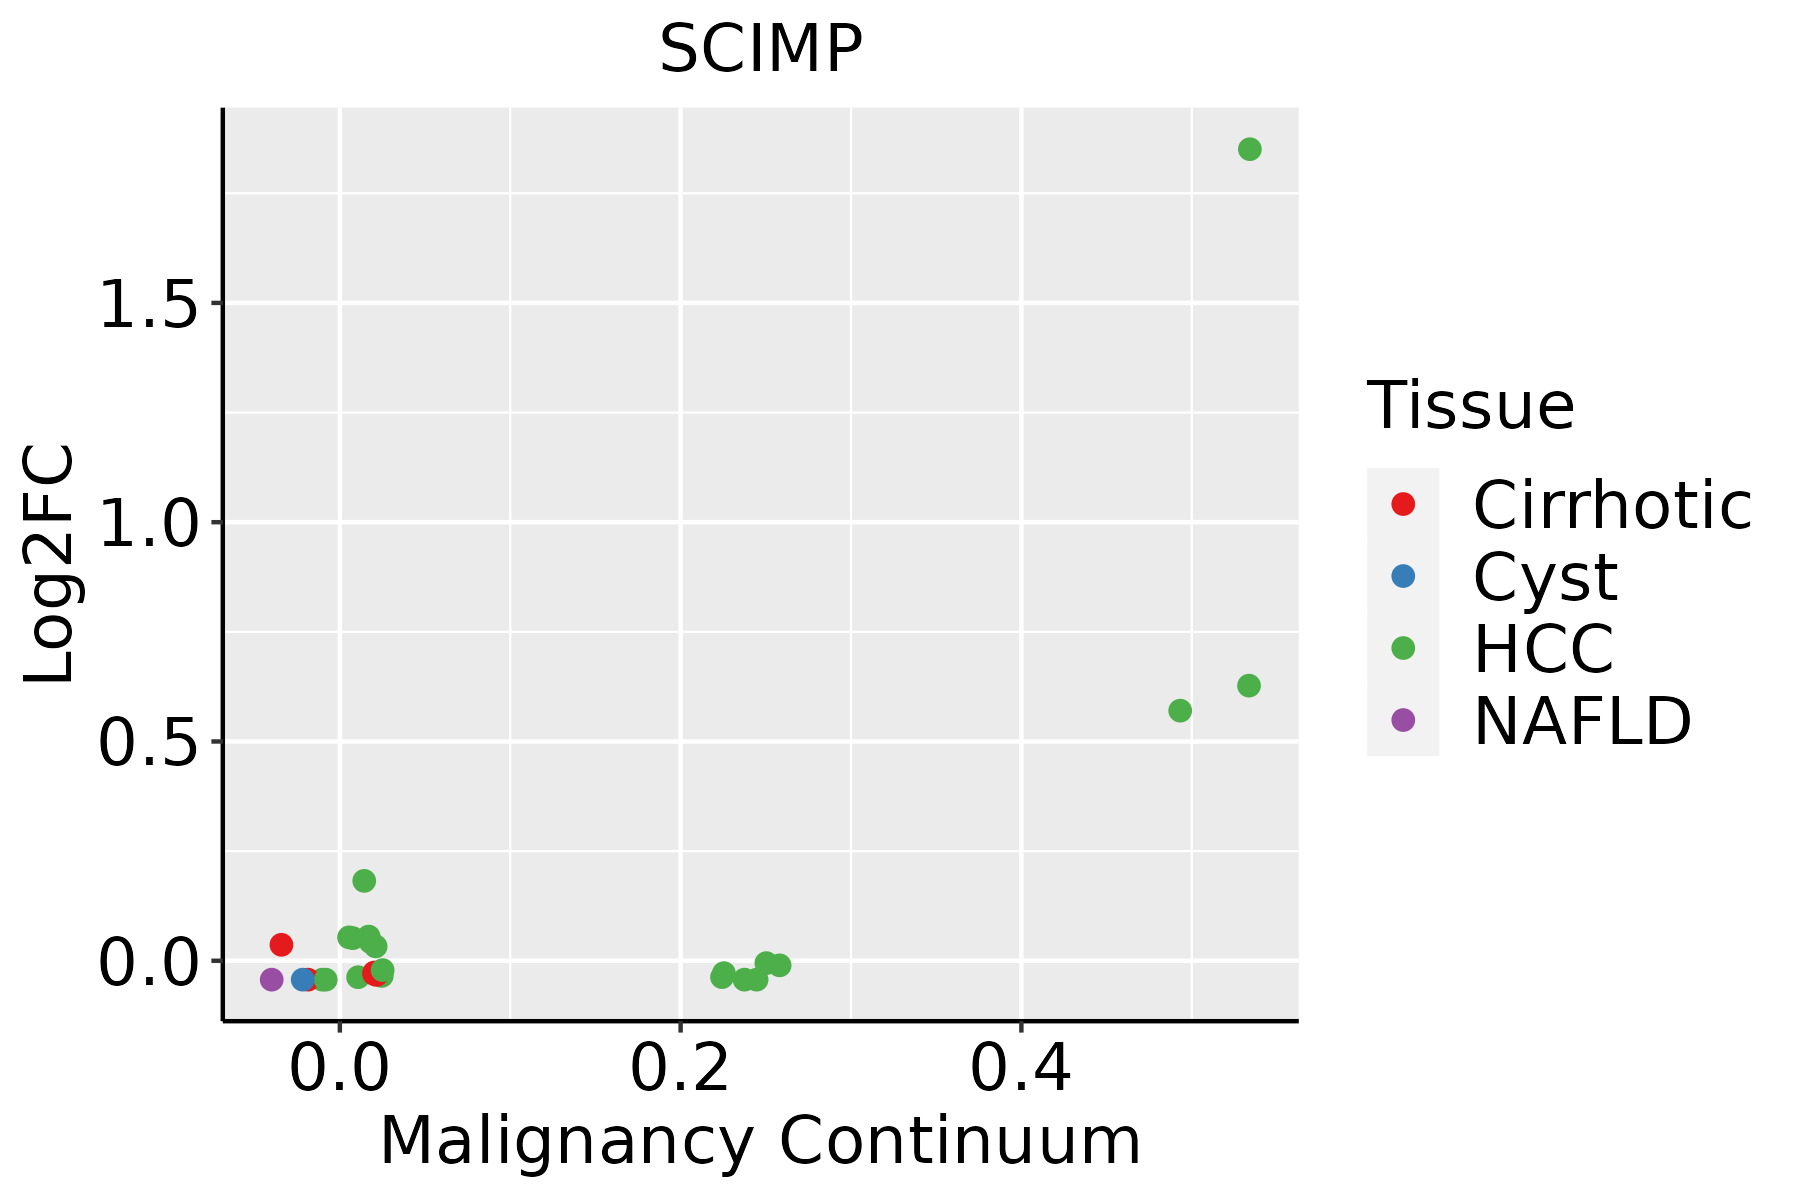 | HCC: Hepatocellular carcinoma |
| NAFLD: Non-alcoholic fatty liver disease |
| ∗log2FC in expression of this searched gene in stem-like cells from each diseased tissue sample relative to stem-like cells in normal samples in each tissue plotted against the malignancy continuum. Samples are colored based on if they are from different disease stage. |
Top |
Malignant transformation related pathway analysis |
| Find out the enriched GO biological processes and KEGG pathways involved in transition from healthy to precancer to cancer |
| Tissue | Disease Stage | Enriched GO biological Processes |
| Stomach | WIM |  |
| Stomach | SIM |  |
| Liver | NAFLD |  |
| Liver | Cirrhotic |  |
| Liver | HCC |  |
| ∗Top 15 enriched GO BP terms are showed in the bar plot of each disease state in each tissue. Each row represents a significant GO biological process which is colored according to the -log10(p.adjust). |
| Page: 1 2 3 4 5 6 7 8 9 |
| GO ID | Tissue | Disease Stage | Description | Gene Ratio | Bg Ratio | pvalue | p.adjust | Count |
| GO:00022211 | Liver | HCC | pattern recognition receptor signaling pathway | 107/7958 | 172/18723 | 1.37e-07 | 2.58e-06 | 107 |
| GO:003109822 | Liver | HCC | stress-activated protein kinase signaling cascade | 138/7958 | 247/18723 | 1.43e-05 | 1.57e-04 | 138 |
| GO:005140322 | Liver | HCC | stress-activated MAPK cascade | 134/7958 | 239/18723 | 1.50e-05 | 1.64e-04 | 134 |
| GO:00028312 | Liver | HCC | regulation of response to biotic stimulus | 173/7958 | 327/18723 | 8.55e-05 | 7.48e-04 | 173 |
| GO:007030222 | Liver | HCC | regulation of stress-activated protein kinase signaling cascade | 105/7958 | 195/18723 | 8.79e-04 | 5.20e-03 | 105 |
| GO:003249611 | Liver | HCC | response to lipopolysaccharide | 174/7958 | 343/18723 | 1.19e-03 | 6.62e-03 | 174 |
| GO:00712166 | Liver | HCC | cellular response to biotic stimulus | 128/7958 | 246/18723 | 1.53e-03 | 8.10e-03 | 128 |
| GO:003287222 | Liver | HCC | regulation of stress-activated MAPK cascade | 102/7958 | 192/18723 | 1.86e-03 | 9.49e-03 | 102 |
| GO:00712226 | Liver | HCC | cellular response to lipopolysaccharide | 110/7958 | 209/18723 | 1.92e-03 | 9.77e-03 | 110 |
| GO:000223711 | Liver | HCC | response to molecule of bacterial origin | 181/7958 | 363/18723 | 2.58e-03 | 1.24e-02 | 181 |
| GO:0002224 | Liver | HCC | toll-like receptor signaling pathway | 67/7958 | 121/18723 | 2.87e-03 | 1.34e-02 | 67 |
| GO:0031663 | Liver | HCC | lipopolysaccharide-mediated signaling pathway | 36/7958 | 60/18723 | 4.68e-03 | 2.01e-02 | 36 |
| GO:00712196 | Liver | HCC | cellular response to molecule of bacterial origin | 113/7958 | 221/18723 | 5.73e-03 | 2.38e-02 | 113 |
| Page: 1 |
| Pathway ID | Tissue | Disease Stage | Description | Gene Ratio | Bg Ratio | pvalue | p.adjust | qvalue | Count |
| Page: 1 |
Top |
Cell-cell communication analysis |
| Identification of potential cell-cell interactions between two cell types and their ligand-receptor pairs for different disease states |
| Ligand | Receptor | LRpair | Pathway | Tissue | Disease Stage |
| Page: 1 |
Top |
Single-cell gene regulatory network inference analysis |
| Find out the significant the regulons (TFs) and the target genes of each regulon across cell types for different disease states |
| TF | Cell Type | Tissue | Disease Stage | Target Gene | RSS | Regulon Activity |
| ∗The dot plots of a searched regulon are shown for all cell subpopulations in each disease state of each tissue based on the regulon specific score inferred using pySCENIC and by calculating the average expression. |
| Page: 1 |
Top |
Somatic mutation of malignant transformation related genes |
| Annotation of somatic variants for genes involved in malignant transformation |
| Hugo Symbol | Variant Class | Variant Classification | dbSNP RS | HGVSc | HGVSp | HGVSp Short | SWISSPROT | BIOTYPE | SIFT | PolyPhen | Tumor Sample Barcode | Tissue | Histology | Sex | Age | Stage | Therapy Types | Drugs | Outcome |
| SCIMP | SNV | Missense_Mutation | novel | c.307N>T | p.Pro103Ser | p.P103S | Q6UWF3 | protein_coding | tolerated(0.16) | benign(0.045) | TCGA-AA-3984-01 | Colorectum | colon adenocarcinoma | Female | <65 | I/II | Unknown | Unknown | SD |
| SCIMP | SNV | Missense_Mutation | c.248N>C | p.Leu83Pro | p.L83P | Q6UWF3 | protein_coding | deleterious(0) | probably_damaging(0.999) | TCGA-AG-4008-01 | Colorectum | rectum adenocarcinoma | Male | <65 | I/II | Chemotherapy | 5-fluorouracil | CR | |
| SCIMP | SNV | Missense_Mutation | rs201961696 | c.397G>A | p.Asp133Asn | p.D133N | Q6UWF3 | protein_coding | deleterious_low_confidence(0) | probably_damaging(0.999) | TCGA-AP-A0LM-01 | Endometrium | uterine corpus endometrioid carcinoma | Female | <65 | III/IV | Chemotherapy | cisplatin | SD |
| SCIMP | SNV | Missense_Mutation | rs201982608 | c.143N>A | p.Arg48Gln | p.R48Q | Q6UWF3 | protein_coding | tolerated(1) | benign(0) | TCGA-FI-A2D5-01 | Endometrium | uterine corpus endometrioid carcinoma | Female | <65 | III/IV | Chemotherapy | carboplatinum | PD |
| SCIMP | SNV | Missense_Mutation | novel | c.283N>C | p.Ser95Pro | p.S95P | Q6UWF3 | protein_coding | tolerated(0.17) | possibly_damaging(0.698) | TCGA-97-8172-01 | Lung | lung adenocarcinoma | Female | >=65 | I/II | Unknown | Unknown | SD |
| SCIMP | SNV | Missense_Mutation | novel | c.208N>A | p.Glu70Lys | p.E70K | Q6UWF3 | protein_coding | deleterious(0) | probably_damaging(0.996) | TCGA-T2-A6WX-01 | Oral cavity | head & neck squamous cell carcinoma | Female | >=65 | I/II | Chemotherapy | carboplatin | PD |
| Page: 1 |
Top |
Related drugs of malignant transformation related genes |
| Identification of chemicals and drugs interact with genes involved in malignant transfromation |
| (DGIdb 4.0) |
| Entrez ID | Symbol | Category | Interaction Types | Drug Claim Name | Drug Name | PMIDs |
| Page: 1 |

Copyright 2023-Present -The University of Texas Health Science Center at Houston |