
|
|||||
|
 | |
| |
| |
| |
| |
| |
|
Gene: SCG2 |
Gene summary for SCG2 |
| Gene information | Species | Human | Gene symbol | SCG2 | Gene ID | 7857 |
| Gene name | secretogranin II | |
| Gene Alias | CHGC | |
| Cytomap | 2q36.1 | |
| Gene Type | protein-coding | GO ID | GO:0000165 | UniProtAcc | P13521 |
Top |
Malignant transformation analysis |
| Identification of the aberrant gene expression in precancerous and cancerous lesions by comparing the gene expression of stem-like cells in diseased tissues with normal stem cells |
| Entrez ID | Symbol | Replicates | Species | Organ | Tissue | Adj P-value | Log2FC | Malignancy |
| 7857 | SCG2 | S014 | Human | Liver | HCC | 9.31e-08 | 4.79e-01 | 0.2254 |
| 7857 | SCG2 | S015 | Human | Liver | HCC | 9.93e-11 | 9.40e-01 | 0.2375 |
| 7857 | SCG2 | S016 | Human | Liver | HCC | 1.96e-21 | 1.04e+00 | 0.2243 |
| 7857 | SCG2 | HTA12-15-2 | Human | Pancreas | PDAC | 4.09e-08 | 6.12e-01 | 0.2315 |
| 7857 | SCG2 | HTA12-23-1 | Human | Pancreas | PDAC | 3.41e-03 | 3.89e-01 | 0.3405 |
| 7857 | SCG2 | HTA12-26-1 | Human | Pancreas | PDAC | 2.67e-04 | 2.70e-01 | 0.3728 |
| 7857 | SCG2 | HTA12-29-1 | Human | Pancreas | PDAC | 4.78e-07 | 2.18e-01 | 0.3722 |
| 7857 | SCG2 | HTA12-9-3 | Human | Pancreas | PDAC | 4.13e-07 | 7.85e-01 | 0.2045 |
| 7857 | SCG2 | ATC12 | Human | Thyroid | ATC | 2.61e-10 | 3.33e-01 | 0.34 |
| 7857 | SCG2 | ATC2 | Human | Thyroid | ATC | 3.34e-11 | 1.51e+00 | 0.34 |
| 7857 | SCG2 | ATC3 | Human | Thyroid | ATC | 6.22e-03 | 2.68e-01 | 0.338 |
| 7857 | SCG2 | ATC4 | Human | Thyroid | ATC | 2.02e-12 | 4.30e-01 | 0.34 |
| Page: 1 |
| Tissue | Expression Dynamics | Abbreviation |
| Liver | 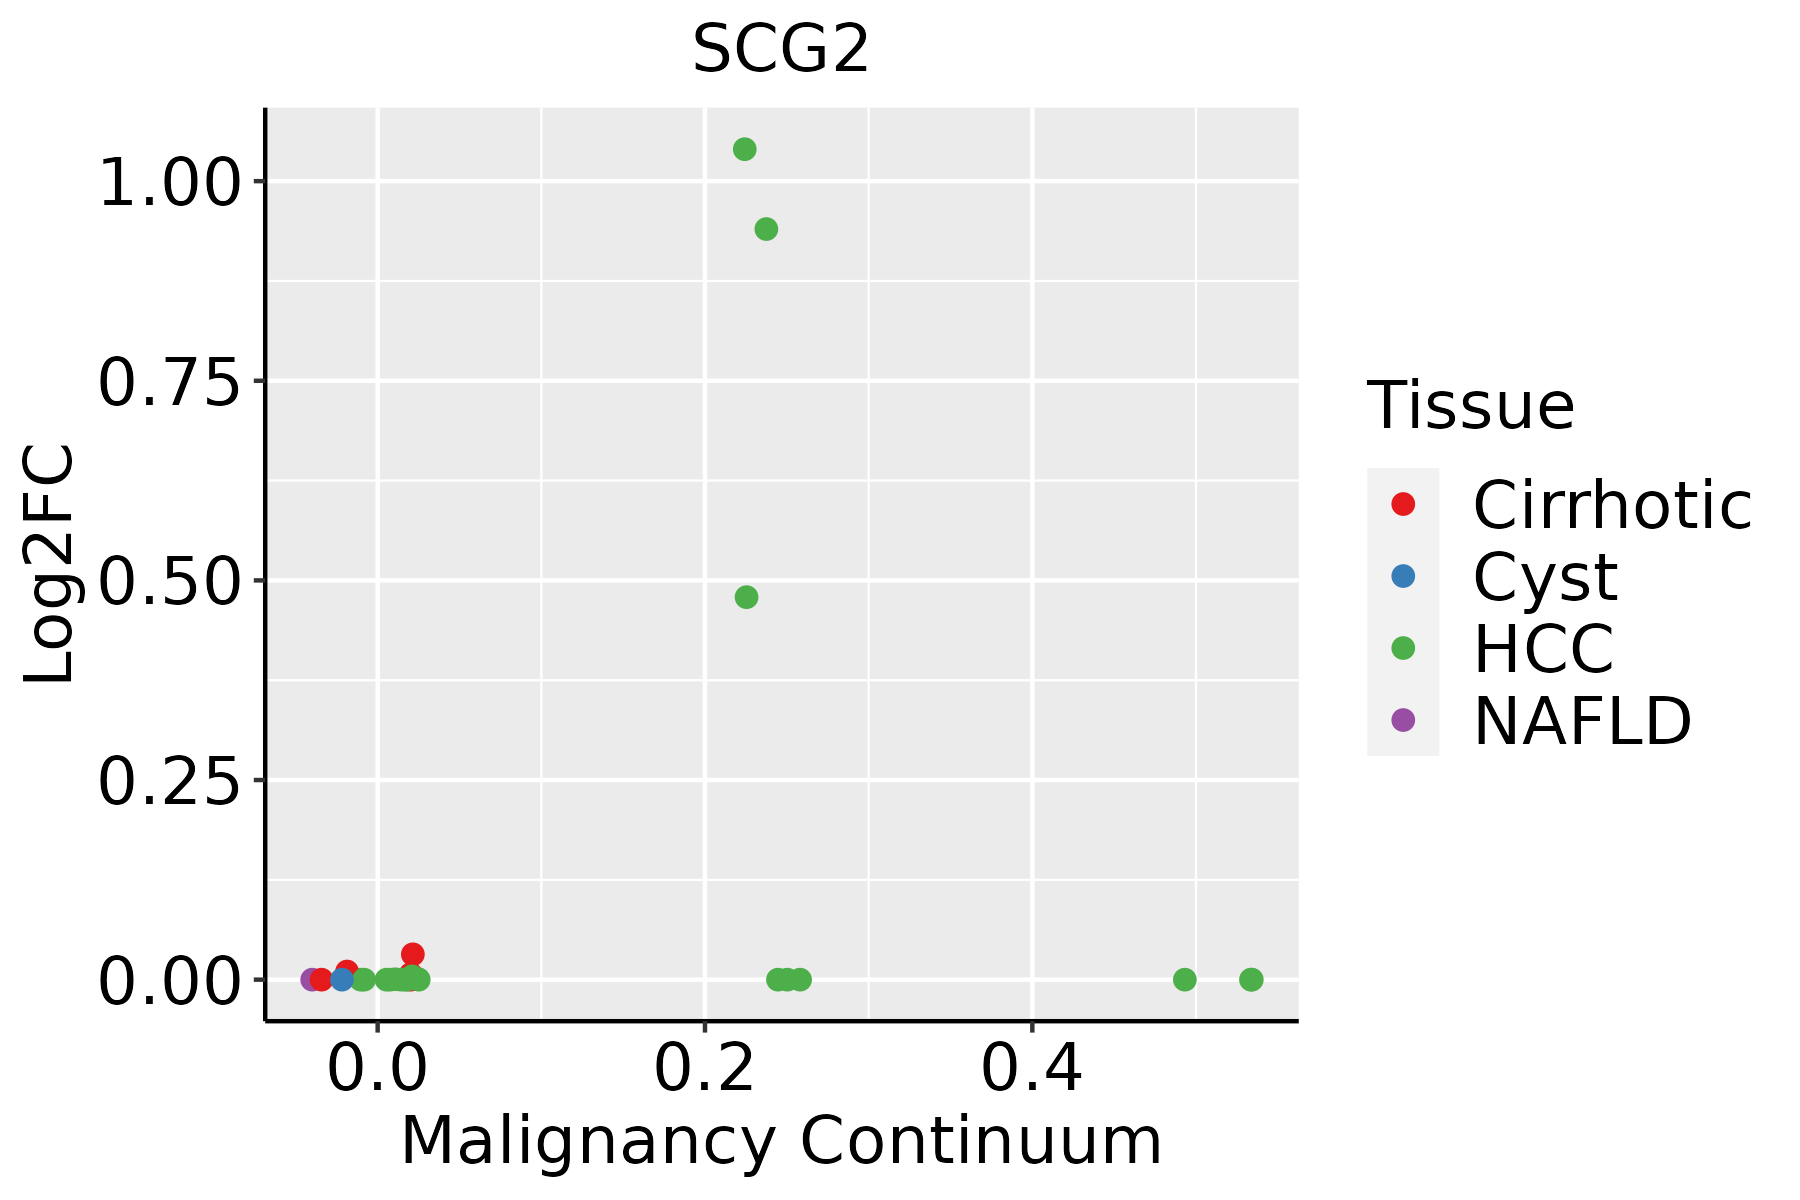 | HCC: Hepatocellular carcinoma |
| NAFLD: Non-alcoholic fatty liver disease | ||
| Thyroid | 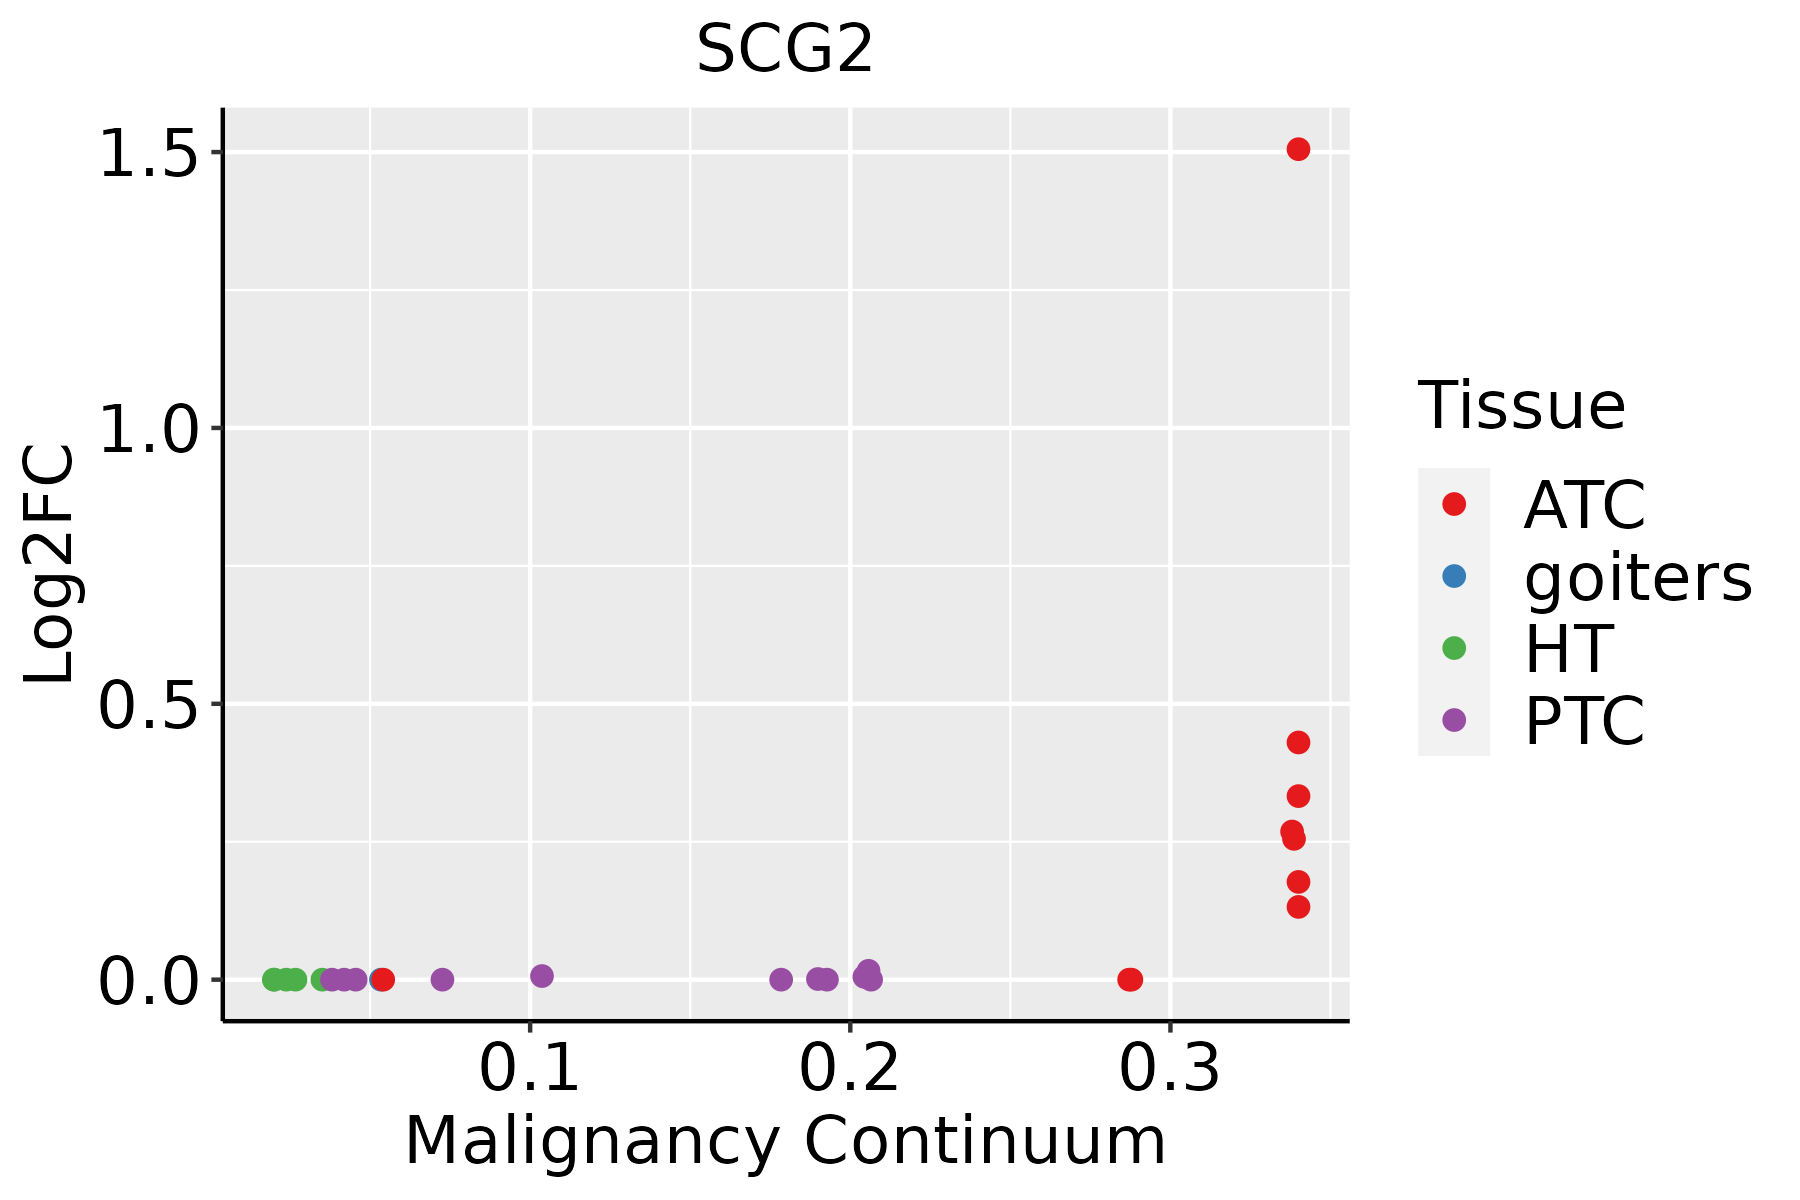 | ATC: Anaplastic thyroid cancer |
| HT: Hashimoto's thyroiditis | ||
| PTC: Papillary thyroid cancer |
| ∗log2FC in expression of this searched gene in stem-like cells from each diseased tissue sample relative to stem-like cells in normal samples in each tissue plotted against the malignancy continuum. Samples are colored based on if they are from different disease stage. |
Top |
Malignant transformation related pathway analysis |
| Find out the enriched GO biological processes and KEGG pathways involved in transition from healthy to precancer to cancer |
| Tissue | Disease Stage | Enriched GO biological Processes |
| Stomach | WIM |  |
| Stomach | SIM |  |
| Liver | NAFLD |  |
| Liver | Cirrhotic |  |
| Liver | HCC |  |
| ∗Top 15 enriched GO BP terms are showed in the bar plot of each disease state in each tissue. Each row represents a significant GO biological process which is colored according to the -log10(p.adjust). |
| Page: 1 2 3 4 5 6 7 8 9 |
| GO ID | Tissue | Disease Stage | Description | Gene Ratio | Bg Ratio | pvalue | p.adjust | Count |
| GO:200123322 | Liver | HCC | regulation of apoptotic signaling pathway | 226/7958 | 356/18723 | 7.26e-16 | 5.68e-14 | 226 |
| GO:009719122 | Liver | HCC | extrinsic apoptotic signaling pathway | 143/7958 | 219/18723 | 6.99e-12 | 2.97e-10 | 143 |
| GO:200123412 | Liver | HCC | negative regulation of apoptotic signaling pathway | 145/7958 | 224/18723 | 1.33e-11 | 5.36e-10 | 145 |
| GO:200123621 | Liver | HCC | regulation of extrinsic apoptotic signaling pathway | 98/7958 | 151/18723 | 2.17e-08 | 5.08e-07 | 98 |
| GO:200123712 | Liver | HCC | negative regulation of extrinsic apoptotic signaling pathway | 62/7958 | 97/18723 | 1.67e-05 | 1.81e-04 | 62 |
| GO:003559212 | Liver | HCC | establishment of protein localization to extracellular region | 176/7958 | 360/18723 | 7.96e-03 | 3.15e-02 | 176 |
| GO:000930612 | Liver | HCC | protein secretion | 175/7958 | 359/18723 | 9.32e-03 | 3.57e-02 | 175 |
| GO:000166721 | Liver | HCC | ameboidal-type cell migration | 226/7958 | 475/18723 | 1.35e-02 | 4.81e-02 | 226 |
| GO:200123335 | Thyroid | ATC | regulation of apoptotic signaling pathway | 206/6293 | 356/18723 | 2.81e-21 | 5.92e-19 | 206 |
| GO:2001234210 | Thyroid | ATC | negative regulation of apoptotic signaling pathway | 129/6293 | 224/18723 | 1.26e-13 | 6.46e-12 | 129 |
| GO:0097191210 | Thyroid | ATC | extrinsic apoptotic signaling pathway | 125/6293 | 219/18723 | 7.19e-13 | 3.16e-11 | 125 |
| GO:000166731 | Thyroid | ATC | ameboidal-type cell migration | 228/6293 | 475/18723 | 3.72e-11 | 1.22e-09 | 228 |
| GO:2001236210 | Thyroid | ATC | regulation of extrinsic apoptotic signaling pathway | 89/6293 | 151/18723 | 1.43e-10 | 4.40e-09 | 89 |
| GO:001063131 | Thyroid | ATC | epithelial cell migration | 169/6293 | 357/18723 | 4.21e-08 | 7.69e-07 | 169 |
| GO:009013031 | Thyroid | ATC | tissue migration | 171/6293 | 365/18723 | 8.55e-08 | 1.47e-06 | 171 |
| GO:009013231 | Thyroid | ATC | epithelium migration | 169/6293 | 360/18723 | 8.57e-08 | 1.47e-06 | 169 |
| GO:200123729 | Thyroid | ATC | negative regulation of extrinsic apoptotic signaling pathway | 54/6293 | 97/18723 | 6.41e-06 | 6.68e-05 | 54 |
| GO:004354231 | Thyroid | ATC | endothelial cell migration | 127/6293 | 279/18723 | 2.14e-05 | 1.91e-04 | 127 |
| GO:005092123 | Thyroid | ATC | positive regulation of chemotaxis | 70/6293 | 141/18723 | 5.77e-05 | 4.43e-04 | 70 |
| GO:003210324 | Thyroid | ATC | positive regulation of response to external stimulus | 178/6293 | 427/18723 | 2.61e-04 | 1.67e-03 | 178 |
| Page: 1 2 |
| Pathway ID | Tissue | Disease Stage | Description | Gene Ratio | Bg Ratio | pvalue | p.adjust | qvalue | Count |
| Page: 1 |
Top |
Cell-cell communication analysis |
| Identification of potential cell-cell interactions between two cell types and their ligand-receptor pairs for different disease states |
| Ligand | Receptor | LRpair | Pathway | Tissue | Disease Stage |
| Page: 1 |
Top |
Single-cell gene regulatory network inference analysis |
| Find out the significant the regulons (TFs) and the target genes of each regulon across cell types for different disease states |
| TF | Cell Type | Tissue | Disease Stage | Target Gene | RSS | Regulon Activity |
| ∗The dot plots of a searched regulon are shown for all cell subpopulations in each disease state of each tissue based on the regulon specific score inferred using pySCENIC and by calculating the average expression. |
| Page: 1 |
Top |
Somatic mutation of malignant transformation related genes |
| Annotation of somatic variants for genes involved in malignant transformation |
| Hugo Symbol | Variant Class | Variant Classification | dbSNP RS | HGVSc | HGVSp | HGVSp Short | SWISSPROT | BIOTYPE | SIFT | PolyPhen | Tumor Sample Barcode | Tissue | Histology | Sex | Age | Stage | Therapy Types | Drugs | Outcome |
| SCG2 | SNV | Missense_Mutation | c.1765C>G | p.Leu589Val | p.L589V | P13521 | protein_coding | deleterious(0.02) | benign(0.13) | TCGA-A1-A0SI-01 | Breast | breast invasive carcinoma | Female | <65 | I/II | Unknown | Unknown | SD | |
| SCG2 | SNV | Missense_Mutation | c.533N>A | p.Pro178His | p.P178H | P13521 | protein_coding | deleterious(0) | probably_damaging(0.964) | TCGA-D8-A1JK-01 | Breast | breast invasive carcinoma | Female | >=65 | I/II | Unknown | Unknown | SD | |
| SCG2 | SNV | Missense_Mutation | rs141189708 | c.1424N>T | p.Ser475Leu | p.S475L | P13521 | protein_coding | tolerated(0.25) | benign(0) | TCGA-FU-A3HZ-01 | Cervix | cervical & endocervical cancer | Female | <65 | I/II | Chemotherapy | cisplatin | CR |
| SCG2 | SNV | Missense_Mutation | rs769298378 | c.208C>A | p.His70Asn | p.H70N | P13521 | protein_coding | tolerated(1) | benign(0) | TCGA-IR-A3LA-01 | Cervix | cervical & endocervical cancer | Female | <65 | I/II | Chemotherapy | cisplatin | CR |
| SCG2 | SNV | Missense_Mutation | c.244C>G | p.Gln82Glu | p.Q82E | P13521 | protein_coding | tolerated(0.13) | possibly_damaging(0.735) | TCGA-IR-A3LL-01 | Cervix | cervical & endocervical cancer | Female | <65 | I/II | Chemotherapy | cisplatin | CR | |
| SCG2 | SNV | Missense_Mutation | c.676T>C | p.Tyr226His | p.Y226H | P13521 | protein_coding | deleterious(0.02) | probably_damaging(0.994) | TCGA-A6-6141-01 | Colorectum | colon adenocarcinoma | Male | <65 | I/II | Chemotherapy | 5-fu | SD | |
| SCG2 | SNV | Missense_Mutation | rs777727782 | c.464N>C | p.Gln155Pro | p.Q155P | P13521 | protein_coding | tolerated(0.43) | possibly_damaging(0.629) | TCGA-A6-6653-01 | Colorectum | colon adenocarcinoma | Male | >=65 | I/II | Unknown | Unknown | SD |
| SCG2 | SNV | Missense_Mutation | novel | c.820A>C | p.Lys274Gln | p.K274Q | P13521 | protein_coding | deleterious(0.02) | benign(0.043) | TCGA-AA-3984-01 | Colorectum | colon adenocarcinoma | Female | <65 | I/II | Unknown | Unknown | SD |
| SCG2 | SNV | Missense_Mutation | c.1429N>A | p.Gln477Lys | p.Q477K | P13521 | protein_coding | tolerated(0.58) | benign(0.061) | TCGA-AA-A02Y-01 | Colorectum | colon adenocarcinoma | Male | >=65 | I/II | Unknown | Unknown | SD | |
| SCG2 | SNV | Missense_Mutation | novel | c.1238N>T | p.Ser413Ile | p.S413I | P13521 | protein_coding | deleterious(0.05) | benign(0.305) | TCGA-AZ-4315-01 | Colorectum | colon adenocarcinoma | Male | <65 | I/II | Unknown | Unknown | SD |
| Page: 1 2 3 4 5 6 7 8 9 |
Top |
Related drugs of malignant transformation related genes |
| Identification of chemicals and drugs interact with genes involved in malignant transfromation |
| (DGIdb 4.0) |
| Entrez ID | Symbol | Category | Interaction Types | Drug Claim Name | Drug Name | PMIDs |
| Page: 1 |

Copyright 2023-Present -The University of Texas Health Science Center at Houston |