
|
|||||
|
 | |
| |
| |
| |
| |
| |
|
Gene: RRAGD |
Gene summary for RRAGD |
| Gene information | Species | Human | Gene symbol | RRAGD | Gene ID | 58528 |
| Gene name | Ras related GTP binding D | |
| Gene Alias | RAGD | |
| Cytomap | 6q15 | |
| Gene Type | protein-coding | GO ID | GO:0001101 | UniProtAcc | Q9NQL2 |
Top |
Malignant transformation analysis |
| Identification of the aberrant gene expression in precancerous and cancerous lesions by comparing the gene expression of stem-like cells in diseased tissues with normal stem cells |
| Entrez ID | Symbol | Replicates | Species | Organ | Tissue | Adj P-value | Log2FC | Malignancy |
| 58528 | RRAGD | HCC1_Meng | Human | Liver | HCC | 1.65e-49 | 1.21e-01 | 0.0246 |
| 58528 | RRAGD | HCC1 | Human | Liver | HCC | 2.10e-06 | 2.30e+00 | 0.5336 |
| 58528 | RRAGD | HCC2 | Human | Liver | HCC | 9.30e-43 | 4.38e+00 | 0.5341 |
| 58528 | RRAGD | S014 | Human | Liver | HCC | 1.17e-24 | 5.50e-01 | 0.2254 |
| 58528 | RRAGD | S015 | Human | Liver | HCC | 2.75e-17 | 5.28e-01 | 0.2375 |
| 58528 | RRAGD | S016 | Human | Liver | HCC | 2.78e-22 | 5.07e-01 | 0.2243 |
| 58528 | RRAGD | S027 | Human | Liver | HCC | 2.91e-17 | 9.70e-01 | 0.2446 |
| 58528 | RRAGD | S028 | Human | Liver | HCC | 6.15e-41 | 1.31e+00 | 0.2503 |
| 58528 | RRAGD | S029 | Human | Liver | HCC | 2.27e-41 | 1.24e+00 | 0.2581 |
| Page: 1 |
| Tissue | Expression Dynamics | Abbreviation |
| Liver | 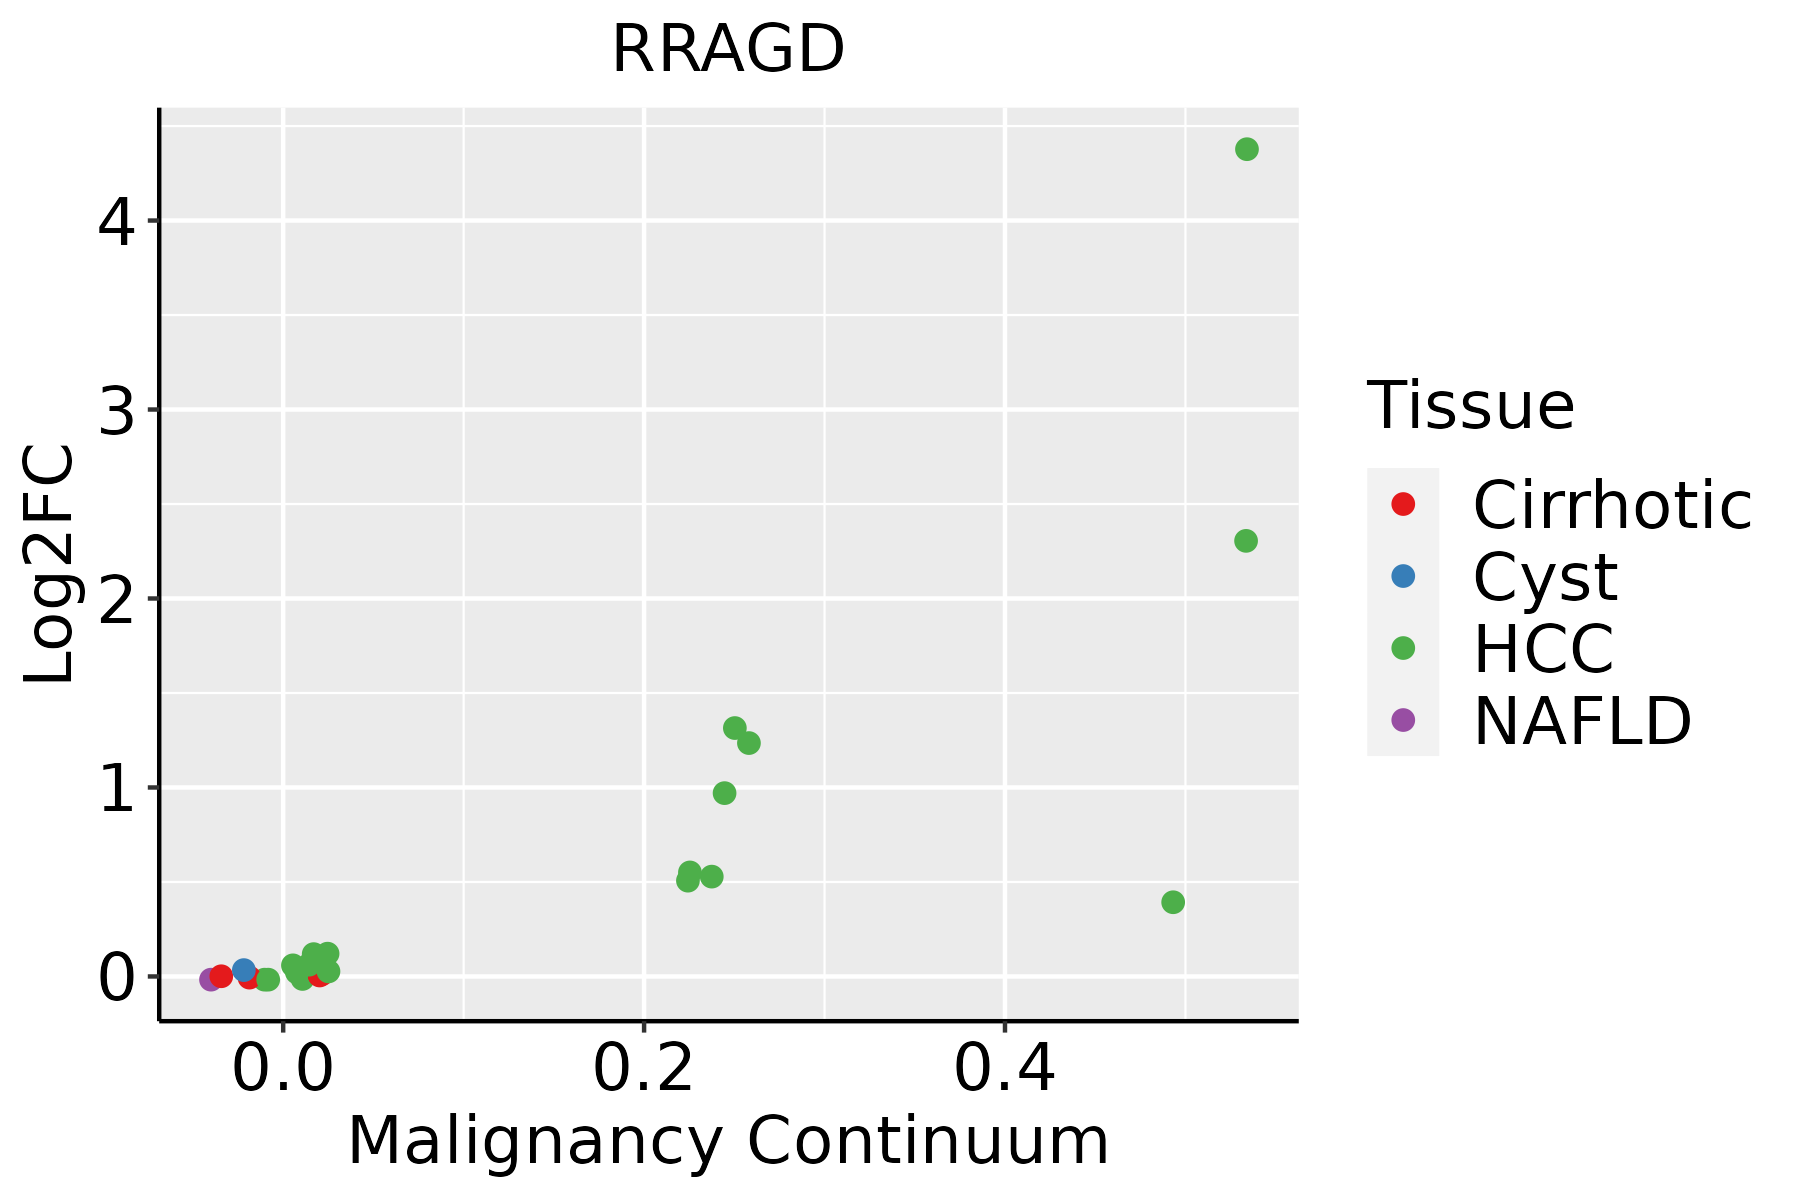 | HCC: Hepatocellular carcinoma |
| NAFLD: Non-alcoholic fatty liver disease |
| ∗log2FC in expression of this searched gene in stem-like cells from each diseased tissue sample relative to stem-like cells in normal samples in each tissue plotted against the malignancy continuum. Samples are colored based on if they are from different disease stage. |
Top |
Malignant transformation related pathway analysis |
| Find out the enriched GO biological processes and KEGG pathways involved in transition from healthy to precancer to cancer |
| Tissue | Disease Stage | Enriched GO biological Processes |
| Stomach | WIM |  |
| Stomach | SIM |  |
| Liver | NAFLD |  |
| Liver | Cirrhotic |  |
| Liver | HCC |  |
| ∗Top 15 enriched GO BP terms are showed in the bar plot of each disease state in each tissue. Each row represents a significant GO biological process which is colored according to the -log10(p.adjust). |
| Page: 1 2 3 4 5 6 7 8 9 |
| GO ID | Tissue | Disease Stage | Description | Gene Ratio | Bg Ratio | pvalue | p.adjust | Count |
| GO:001050621 | Liver | HCC | regulation of autophagy | 210/7958 | 317/18723 | 7.59e-18 | 8.45e-16 | 210 |
| GO:003166722 | Liver | HCC | response to nutrient levels | 276/7958 | 474/18723 | 2.30e-12 | 1.08e-10 | 276 |
| GO:007149622 | Liver | HCC | cellular response to external stimulus | 191/7958 | 320/18723 | 3.40e-10 | 1.13e-08 | 191 |
| GO:003166812 | Liver | HCC | cellular response to extracellular stimulus | 149/7958 | 246/18723 | 7.35e-09 | 1.86e-07 | 149 |
| GO:004259421 | Liver | HCC | response to starvation | 121/7958 | 197/18723 | 6.08e-08 | 1.28e-06 | 121 |
| GO:003166912 | Liver | HCC | cellular response to nutrient levels | 130/7958 | 215/18723 | 7.52e-08 | 1.51e-06 | 130 |
| GO:000926712 | Liver | HCC | cellular response to starvation | 94/7958 | 156/18723 | 5.61e-06 | 6.95e-05 | 94 |
| GO:00319291 | Liver | HCC | TOR signaling | 78/7958 | 126/18723 | 8.49e-06 | 9.97e-05 | 78 |
| GO:000110111 | Liver | HCC | response to acid chemical | 79/7958 | 135/18723 | 1.24e-04 | 1.03e-03 | 79 |
| GO:0032006 | Liver | HCC | regulation of TOR signaling | 63/7958 | 104/18723 | 1.50e-04 | 1.20e-03 | 63 |
| GO:004320011 | Liver | HCC | response to amino acid | 68/7958 | 116/18723 | 3.31e-04 | 2.33e-03 | 68 |
| GO:19909281 | Liver | HCC | response to amino acid starvation | 33/7958 | 49/18723 | 3.86e-04 | 2.62e-03 | 33 |
| GO:0032008 | Liver | HCC | positive regulation of TOR signaling | 31/7958 | 47/18723 | 9.90e-04 | 5.71e-03 | 31 |
| GO:00341981 | Liver | HCC | cellular response to amino acid starvation | 30/7958 | 46/18723 | 1.56e-03 | 8.23e-03 | 30 |
| GO:00712291 | Liver | HCC | cellular response to acid chemical | 45/7958 | 80/18723 | 9.02e-03 | 3.48e-02 | 45 |
| GO:1904263 | Liver | HCC | positive regulation of TORC1 signaling | 14/7958 | 20/18723 | 1.21e-02 | 4.41e-02 | 14 |
| Page: 1 |
| Pathway ID | Tissue | Disease Stage | Description | Gene Ratio | Bg Ratio | pvalue | p.adjust | qvalue | Count |
| hsa0414021 | Liver | HCC | Autophagy - animal | 99/4020 | 141/8465 | 3.08e-08 | 4.70e-07 | 2.61e-07 | 99 |
| hsa0513142 | Liver | HCC | Shigellosis | 150/4020 | 247/8465 | 1.53e-05 | 1.04e-04 | 5.81e-05 | 150 |
| hsa041502 | Liver | HCC | mTOR signaling pathway | 95/4020 | 156/8465 | 4.70e-04 | 1.99e-03 | 1.11e-03 | 95 |
| hsa0414031 | Liver | HCC | Autophagy - animal | 99/4020 | 141/8465 | 3.08e-08 | 4.70e-07 | 2.61e-07 | 99 |
| hsa0513152 | Liver | HCC | Shigellosis | 150/4020 | 247/8465 | 1.53e-05 | 1.04e-04 | 5.81e-05 | 150 |
| hsa0415011 | Liver | HCC | mTOR signaling pathway | 95/4020 | 156/8465 | 4.70e-04 | 1.99e-03 | 1.11e-03 | 95 |
| Page: 1 |
Top |
Cell-cell communication analysis |
| Identification of potential cell-cell interactions between two cell types and their ligand-receptor pairs for different disease states |
| Ligand | Receptor | LRpair | Pathway | Tissue | Disease Stage |
| Page: 1 |
Top |
Single-cell gene regulatory network inference analysis |
| Find out the significant the regulons (TFs) and the target genes of each regulon across cell types for different disease states |
| TF | Cell Type | Tissue | Disease Stage | Target Gene | RSS | Regulon Activity |
| ∗The dot plots of a searched regulon are shown for all cell subpopulations in each disease state of each tissue based on the regulon specific score inferred using pySCENIC and by calculating the average expression. |
| Page: 1 |
Top |
Somatic mutation of malignant transformation related genes |
| Annotation of somatic variants for genes involved in malignant transformation |
| Hugo Symbol | Variant Class | Variant Classification | dbSNP RS | HGVSc | HGVSp | HGVSp Short | SWISSPROT | BIOTYPE | SIFT | PolyPhen | Tumor Sample Barcode | Tissue | Histology | Sex | Age | Stage | Therapy Types | Drugs | Outcome |
| RRAGD | SNV | Missense_Mutation | c.734N>G | p.Glu245Gly | p.E245G | Q9NQL2 | protein_coding | deleterious(0) | probably_damaging(0.999) | TCGA-A8-A08P-01 | Breast | breast invasive carcinoma | Female | >=65 | III/IV | Chemotherapy | 5-fluorouracil | CR | |
| RRAGD | SNV | Missense_Mutation | rs753650418 | c.305N>A | p.Arg102Gln | p.R102Q | Q9NQL2 | protein_coding | tolerated(0.08) | benign(0.029) | TCGA-BH-A1FC-01 | Breast | breast invasive carcinoma | Female | >=65 | I/II | Unknown | Unknown | SD |
| RRAGD | insertion | Frame_Shift_Ins | novel | c.1071_1072insGGTACAATCATAGCTCACTGTTACCTCTTGGGCTCAAGGGATC | p.His358GlyfsTer23 | p.H358Gfs*23 | Q9NQL2 | protein_coding | TCGA-A2-A0ER-01 | Breast | breast invasive carcinoma | Female | <65 | I/II | Chemotherapy | cytoxan | SD | ||
| RRAGD | insertion | Frame_Shift_Ins | novel | c.814_815insTTAGACACACA | p.Ala272ValfsTer22 | p.A272Vfs*22 | Q9NQL2 | protein_coding | TCGA-AO-A03T-01 | Breast | breast invasive carcinoma | Female | <65 | I/II | Chemotherapy | cyclophosphamide | SD | ||
| RRAGD | insertion | In_Frame_Ins | novel | c.812_813insCGGATTCTCTCTGTTAAC | p.Ile271_Ala272insGlyPheSerLeuLeuThr | p.I271_A272insGFSLLT | Q9NQL2 | protein_coding | TCGA-AO-A03T-01 | Breast | breast invasive carcinoma | Female | <65 | I/II | Chemotherapy | cyclophosphamide | SD | ||
| RRAGD | insertion | In_Frame_Ins | novel | c.670_671insTTAACAATAAAGTGAGCTACAGAGAAGAAATTA | p.His224delinsLeuAsnAsnLysValSerTyrArgGluGluIleAsn | p.H224delinsLNNKVSYREEIN | Q9NQL2 | protein_coding | TCGA-AO-A0J9-01 | Breast | breast invasive carcinoma | Female | <65 | III/IV | Chemotherapy | cyclophosphamide | PD | ||
| RRAGD | SNV | Missense_Mutation | novel | c.59A>G | p.Glu20Gly | p.E20G | Q9NQL2 | protein_coding | tolerated_low_confidence(0.09) | possibly_damaging(0.727) | TCGA-2W-A8YY-01 | Cervix | cervical & endocervical cancer | Female | <65 | I/II | Chemotherapy | cisplatin | CR |
| RRAGD | SNV | Missense_Mutation | c.1072N>A | p.His358Asn | p.H358N | Q9NQL2 | protein_coding | tolerated(0.54) | benign(0.148) | TCGA-AZ-4315-01 | Colorectum | colon adenocarcinoma | Male | <65 | I/II | Unknown | Unknown | SD | |
| RRAGD | SNV | Missense_Mutation | c.345T>G | p.Ile115Met | p.I115M | Q9NQL2 | protein_coding | deleterious(0) | probably_damaging(0.985) | TCGA-F5-6814-01 | Colorectum | rectum adenocarcinoma | Male | <65 | I/II | Unknown | Unknown | SD | |
| RRAGD | SNV | Missense_Mutation | novel | c.830N>T | p.Pro277Leu | p.P277L | Q9NQL2 | protein_coding | deleterious(0.03) | probably_damaging(0.993) | TCGA-A5-A0G1-01 | Endometrium | uterine corpus endometrioid carcinoma | Female | >=65 | I/II | Unknown | Unknown | SD |
| Page: 1 2 3 4 5 |
Top |
Related drugs of malignant transformation related genes |
| Identification of chemicals and drugs interact with genes involved in malignant transfromation |
| (DGIdb 4.0) |
| Entrez ID | Symbol | Category | Interaction Types | Drug Claim Name | Drug Name | PMIDs |
| Page: 1 |

Copyright 2023-Present -The University of Texas Health Science Center at Houston |