
|
|||||
|
 | |
| |
| |
| |
| |
| |
|
Gene: RGS4 |
Gene summary for RGS4 |
| Gene information | Species | Human | Gene symbol | RGS4 | Gene ID | 5999 |
| Gene name | regulator of G protein signaling 4 | |
| Gene Alias | RGP4 | |
| Cytomap | 1q23.3 | |
| Gene Type | protein-coding | GO ID | GO:0001558 | UniProtAcc | P49798 |
Top |
Malignant transformation analysis |
| Identification of the aberrant gene expression in precancerous and cancerous lesions by comparing the gene expression of stem-like cells in diseased tissues with normal stem cells |
| Entrez ID | Symbol | Replicates | Species | Organ | Tissue | Adj P-value | Log2FC | Malignancy |
| 5999 | RGS4 | PTC06 | Human | Thyroid | PTC | 5.78e-05 | 4.58e-01 | 0.2057 |
| 5999 | RGS4 | ATC11 | Human | Thyroid | ATC | 3.34e-11 | 1.33e+00 | 0.3386 |
| 5999 | RGS4 | ATC12 | Human | Thyroid | ATC | 5.43e-04 | 1.28e-01 | 0.34 |
| 5999 | RGS4 | ATC13 | Human | Thyroid | ATC | 6.38e-17 | 3.36e-01 | 0.34 |
| 5999 | RGS4 | ATC3 | Human | Thyroid | ATC | 9.90e-24 | 1.53e+00 | 0.338 |
| 5999 | RGS4 | ATC4 | Human | Thyroid | ATC | 3.76e-06 | 1.88e-01 | 0.34 |
| 5999 | RGS4 | ATC5 | Human | Thyroid | ATC | 2.31e-12 | 3.62e-01 | 0.34 |
| Page: 1 |
| Tissue | Expression Dynamics | Abbreviation |
| Thyroid | 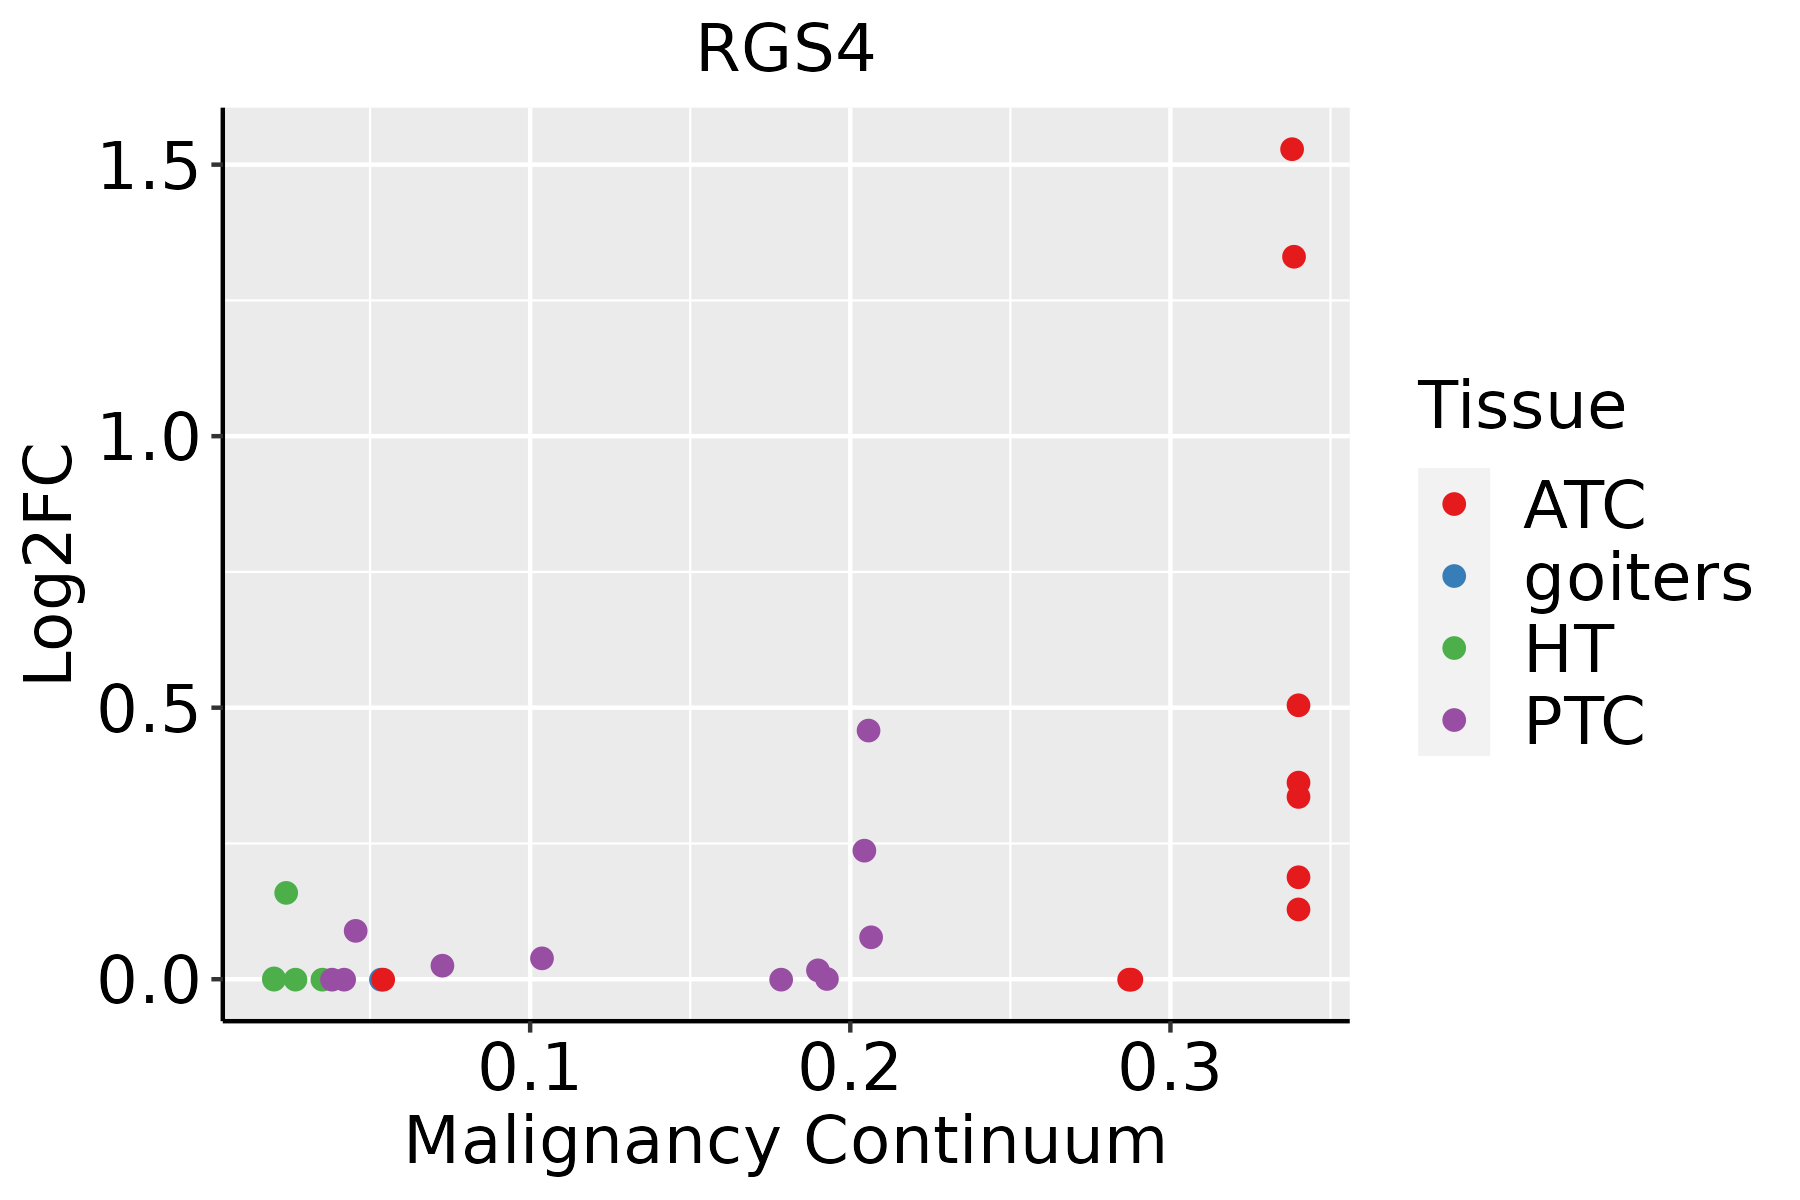 | ATC: Anaplastic thyroid cancer |
| HT: Hashimoto's thyroiditis | ||
| PTC: Papillary thyroid cancer |
| ∗log2FC in expression of this searched gene in stem-like cells from each diseased tissue sample relative to stem-like cells in normal samples in each tissue plotted against the malignancy continuum. Samples are colored based on if they are from different disease stage. |
Top |
Malignant transformation related pathway analysis |
| Find out the enriched GO biological processes and KEGG pathways involved in transition from healthy to precancer to cancer |
| Tissue | Disease Stage | Enriched GO biological Processes |
| Stomach | WIM |  |
| Stomach | SIM |  |
| Liver | NAFLD |  |
| Liver | Cirrhotic |  |
| Liver | HCC |  |
| ∗Top 15 enriched GO BP terms are showed in the bar plot of each disease state in each tissue. Each row represents a significant GO biological process which is colored according to the -log10(p.adjust). |
| Page: 1 2 3 4 5 6 7 8 9 |
| GO ID | Tissue | Disease Stage | Description | Gene Ratio | Bg Ratio | pvalue | p.adjust | Count |
| GO:1902903113 | Thyroid | PTC | regulation of supramolecular fiber organization | 202/5968 | 383/18723 | 1.16e-17 | 1.15e-15 | 202 |
| GO:0007015112 | Thyroid | PTC | actin filament organization | 225/5968 | 442/18723 | 3.76e-17 | 3.44e-15 | 225 |
| GO:0032956113 | Thyroid | PTC | regulation of actin cytoskeleton organization | 182/5968 | 358/18723 | 4.64e-14 | 2.79e-12 | 182 |
| GO:0032970113 | Thyroid | PTC | regulation of actin filament-based process | 197/5968 | 397/18723 | 8.91e-14 | 4.89e-12 | 197 |
| GO:0110053112 | Thyroid | PTC | regulation of actin filament organization | 146/5968 | 278/18723 | 5.87e-13 | 2.85e-11 | 146 |
| GO:0016049112 | Thyroid | PTC | cell growth | 225/5968 | 482/18723 | 4.75e-12 | 2.07e-10 | 225 |
| GO:0001558111 | Thyroid | PTC | regulation of cell growth | 188/5968 | 414/18723 | 4.13e-09 | 1.09e-07 | 188 |
| GO:004858819 | Thyroid | PTC | developmental cell growth | 106/5968 | 234/18723 | 1.07e-05 | 1.19e-04 | 106 |
| GO:004308718 | Thyroid | PTC | regulation of GTPase activity | 148/5968 | 348/18723 | 1.63e-05 | 1.71e-04 | 148 |
| GO:0097305113 | Thyroid | PTC | response to alcohol | 107/5968 | 253/18723 | 2.92e-04 | 2.07e-03 | 107 |
| GO:004592614 | Thyroid | PTC | negative regulation of growth | 105/5968 | 249/18723 | 3.76e-04 | 2.54e-03 | 105 |
| GO:00303087 | Thyroid | PTC | negative regulation of cell growth | 80/5968 | 188/18723 | 1.28e-03 | 7.31e-03 | 80 |
| GO:006053719 | Thyroid | PTC | muscle tissue development | 156/5968 | 403/18723 | 1.98e-03 | 1.06e-02 | 156 |
| GO:004354714 | Thyroid | PTC | positive regulation of GTPase activity | 103/5968 | 255/18723 | 2.38e-03 | 1.25e-02 | 103 |
| GO:00510518 | Thyroid | PTC | negative regulation of transport | 176/5968 | 470/18723 | 5.44e-03 | 2.49e-02 | 176 |
| GO:004863810 | Thyroid | PTC | regulation of developmental growth | 127/5968 | 330/18723 | 6.09e-03 | 2.71e-02 | 127 |
| GO:001470617 | Thyroid | PTC | striated muscle tissue development | 144/5968 | 384/18723 | 1.05e-02 | 4.22e-02 | 144 |
| GO:1902903210 | Thyroid | ATC | regulation of supramolecular fiber organization | 210/6293 | 383/18723 | 6.20e-18 | 7.54e-16 | 210 |
| GO:0032970210 | Thyroid | ATC | regulation of actin filament-based process | 208/6293 | 397/18723 | 5.82e-15 | 3.80e-13 | 208 |
| GO:0007015210 | Thyroid | ATC | actin filament organization | 227/6293 | 442/18723 | 5.96e-15 | 3.85e-13 | 227 |
| Page: 1 2 3 |
| Pathway ID | Tissue | Disease Stage | Description | Gene Ratio | Bg Ratio | pvalue | p.adjust | qvalue | Count |
| Page: 1 |
Top |
Cell-cell communication analysis |
| Identification of potential cell-cell interactions between two cell types and their ligand-receptor pairs for different disease states |
| Ligand | Receptor | LRpair | Pathway | Tissue | Disease Stage |
| Page: 1 |
Top |
Single-cell gene regulatory network inference analysis |
| Find out the significant the regulons (TFs) and the target genes of each regulon across cell types for different disease states |
| TF | Cell Type | Tissue | Disease Stage | Target Gene | RSS | Regulon Activity |
| ∗The dot plots of a searched regulon are shown for all cell subpopulations in each disease state of each tissue based on the regulon specific score inferred using pySCENIC and by calculating the average expression. |
| Page: 1 |
Top |
Somatic mutation of malignant transformation related genes |
| Annotation of somatic variants for genes involved in malignant transformation |
| Hugo Symbol | Variant Class | Variant Classification | dbSNP RS | HGVSc | HGVSp | HGVSp Short | SWISSPROT | BIOTYPE | SIFT | PolyPhen | Tumor Sample Barcode | Tissue | Histology | Sex | Age | Stage | Therapy Types | Drugs | Outcome |
| RGS4 | SNV | Missense_Mutation | c.657N>C | p.Gln219His | p.Q219H | P49798 | protein_coding | deleterious(0) | possibly_damaging(0.835) | TCGA-A8-A075-01 | Breast | breast invasive carcinoma | Female | <65 | I/II | Chemotherapy | epirubicin | CR | |
| RGS4 | SNV | Missense_Mutation | c.547N>A | p.Glu183Lys | p.E183K | P49798 | protein_coding | deleterious(0.01) | probably_damaging(0.995) | TCGA-BH-A0HP-01 | Breast | breast invasive carcinoma | Female | >=65 | III/IV | Chemotherapy | doxorubicin | SD | |
| RGS4 | SNV | Missense_Mutation | c.762N>A | p.Phe254Leu | p.F254L | P49798 | protein_coding | deleterious(0.02) | possibly_damaging(0.84) | TCGA-BH-A1EV-01 | Breast | breast invasive carcinoma | Female | <65 | III/IV | Unknown | Unknown | PD | |
| RGS4 | SNV | Missense_Mutation | c.801G>T | p.Lys267Asn | p.K267N | P49798 | protein_coding | deleterious(0) | probably_damaging(0.986) | TCGA-FU-A3HZ-01 | Cervix | cervical & endocervical cancer | Female | <65 | I/II | Chemotherapy | cisplatin | CR | |
| RGS4 | SNV | Missense_Mutation | novel | c.519C>G | p.Phe173Leu | p.F173L | P49798 | protein_coding | deleterious(0) | probably_damaging(1) | TCGA-ZJ-A8QR-01 | Cervix | cervical & endocervical cancer | Female | <65 | I/II | Unknown | Unknown | SD |
| RGS4 | SNV | Missense_Mutation | novel | c.776N>G | p.Lys259Arg | p.K259R | P49798 | protein_coding | deleterious(0.05) | possibly_damaging(0.872) | TCGA-AA-3848-01 | Colorectum | colon adenocarcinoma | Female | >=65 | III/IV | Unknown | Unknown | PD |
| RGS4 | SNV | Missense_Mutation | novel | c.649N>G | p.Ser217Ala | p.S217A | P49798 | protein_coding | tolerated(0.41) | benign(0.389) | TCGA-AA-3947-01 | Colorectum | colon adenocarcinoma | Female | <65 | I/II | Unknown | Unknown | SD |
| RGS4 | SNV | Missense_Mutation | c.539N>G | p.Glu180Gly | p.E180G | P49798 | protein_coding | deleterious(0) | probably_damaging(1) | TCGA-AA-A010-01 | Colorectum | colon adenocarcinoma | Female | <65 | I/II | Chemotherapy | folinic | CR | |
| RGS4 | SNV | Missense_Mutation | rs567536966 | c.622G>A | p.Ala208Thr | p.A208T | P49798 | protein_coding | deleterious(0) | probably_damaging(1) | TCGA-AD-6964-01 | Colorectum | colon adenocarcinoma | Male | <65 | III/IV | Chemotherapy | folfox | PD |
| RGS4 | SNV | Missense_Mutation | rs771715416 | c.355N>T | p.Arg119Trp | p.R119W | P49798 | protein_coding | deleterious(0) | probably_damaging(0.973) | TCGA-G4-6306-01 | Colorectum | colon adenocarcinoma | Male | >=65 | I/II | Unknown | Unknown | SD |
| Page: 1 2 3 4 5 6 |
Top |
Related drugs of malignant transformation related genes |
| Identification of chemicals and drugs interact with genes involved in malignant transfromation |
| (DGIdb 4.0) |
| Entrez ID | Symbol | Category | Interaction Types | Drug Claim Name | Drug Name | PMIDs |
| 5999 | RGS4 | DRUGGABLE GENOME | METHYLDOPA | METHYLDOPA | ||
| 5999 | RGS4 | DRUGGABLE GENOME | PICEATANNOL | PICEATANNOL | ||
| 5999 | RGS4 | DRUGGABLE GENOME | AM-251 | CHEMBL285932 | ||
| 5999 | RGS4 | DRUGGABLE GENOME | D-TRYPTOPHAN | D-TRYPTOPHAN | ||
| 5999 | RGS4 | DRUGGABLE GENOME | DISULFIRAM | DISULFIRAM | ||
| 5999 | RGS4 | DRUGGABLE GENOME | CALCIMYCIN | CALCIMYCIN | ||
| 5999 | RGS4 | DRUGGABLE GENOME | inhibitor | 252827382 | CHEMBL1476646 | |
| 5999 | RGS4 | DRUGGABLE GENOME | DIMETHYLPINOCEMBRIN | DIMETHYLPINOCEMBRIN | ||
| 5999 | RGS4 | DRUGGABLE GENOME | inhibitor | 252827384 | ||
| 5999 | RGS4 | DRUGGABLE GENOME | OXITRIPTAN | OXITRIPTAN |
| Page: 1 2 3 4 5 6 7 8 9 10 11 |

Copyright 2023-Present -The University of Texas Health Science Center at Houston |