
|
|||||
|
 | |
| |
| |
| |
| |
| |
|
Gene: PTPLB |
Gene summary for PTPLB |
| Gene information | Species | Human | Gene symbol | PTPLB | Gene ID | 201562 |
| Gene name | 3-hydroxyacyl-CoA dehydratase 2 | |
| Gene Alias | PTPLB | |
| Cytomap | 3q21.1 | |
| Gene Type | protein-coding | GO ID | GO:0000038 | UniProtAcc | Q6Y1H2 |
Top |
Malignant transformation analysis |
| Identification of the aberrant gene expression in precancerous and cancerous lesions by comparing the gene expression of stem-like cells in diseased tissues with normal stem cells |
| Entrez ID | Symbol | Replicates | Species | Organ | Tissue | Adj P-value | Log2FC | Malignancy |
| 201562 | PTPLB | GSM5353215_PA_AUG_PB_1B_S2 | Human | Prostate | Tumor | 2.03e-10 | 9.12e-01 | 0.1557 |
| 201562 | PTPLB | GSM5353216_PA_PB1A_Pool_1_3_S50_L002 | Human | Prostate | Tumor | 1.29e-04 | 5.54e-01 | 0.159 |
| 201562 | PTPLB | GSM5353220_PA_PB1B_Pool_3_S51_L002 | Human | Prostate | Tumor | 3.71e-02 | 4.26e-01 | 0.1531 |
| 201562 | PTPLB | GSM5353221_PA_PB2A_Pool_1_3_S25_L001 | Human | Prostate | Tumor | 2.44e-14 | 5.02e-01 | 0.1633 |
| 201562 | PTPLB | GSM5353222_PA_PB2B_Pool_1_3_S52_L002 | Human | Prostate | Tumor | 1.24e-11 | 4.08e-01 | 0.1608 |
| 201562 | PTPLB | GSM5353223_PA_PB2B_Pool_2_S26_L001 | Human | Prostate | Tumor | 8.59e-11 | 4.23e-01 | 0.1604 |
| 201562 | PTPLB | GSM5353224_PA_PR5186_Pool_1_2_3_S27_L001 | Human | Prostate | Tumor | 4.96e-07 | 3.13e-01 | 0.1621 |
| 201562 | PTPLB | GSM5353225_PA_PR5196-1_Pool_1_2_3_S53_L002 | Human | Prostate | Tumor | 3.50e-02 | 3.22e-01 | 0.1619 |
| 201562 | PTPLB | GSM5353226_PA_PR5196-2_Pool_1_2_3_S54_L002 | Human | Prostate | Tumor | 4.40e-03 | 4.09e-01 | 0.159 |
| 201562 | PTPLB | GSM5353227_PA_PR5199-193K_Pool_1_2_3_S55_L002 | Human | Prostate | Tumor | 2.89e-06 | 3.09e-01 | 0.1602 |
| 201562 | PTPLB | GSM5353236_PA_PR5251_T1_S7_L001 | Human | Prostate | Tumor | 5.74e-06 | 5.08e-01 | 0.1608 |
| 201562 | PTPLB | GSM5353237_PA_PR5251_T2_S8_L001 | Human | Prostate | Tumor | 6.72e-08 | 6.14e-01 | 0.1622 |
| 201562 | PTPLB | P1_cSCC | Human | Skin | cSCC | 9.44e-27 | 7.80e-01 | 0.0292 |
| 201562 | PTPLB | P2_cSCC | Human | Skin | cSCC | 1.86e-12 | 3.49e-01 | -0.024 |
| 201562 | PTPLB | P4_cSCC | Human | Skin | cSCC | 9.17e-38 | 8.43e-01 | -0.00290000000000005 |
| 201562 | PTPLB | P10_cSCC | Human | Skin | cSCC | 1.89e-31 | 6.87e-01 | 0.1017 |
| Page: 1 |
| Tissue | Expression Dynamics | Abbreviation |
| Prostate | 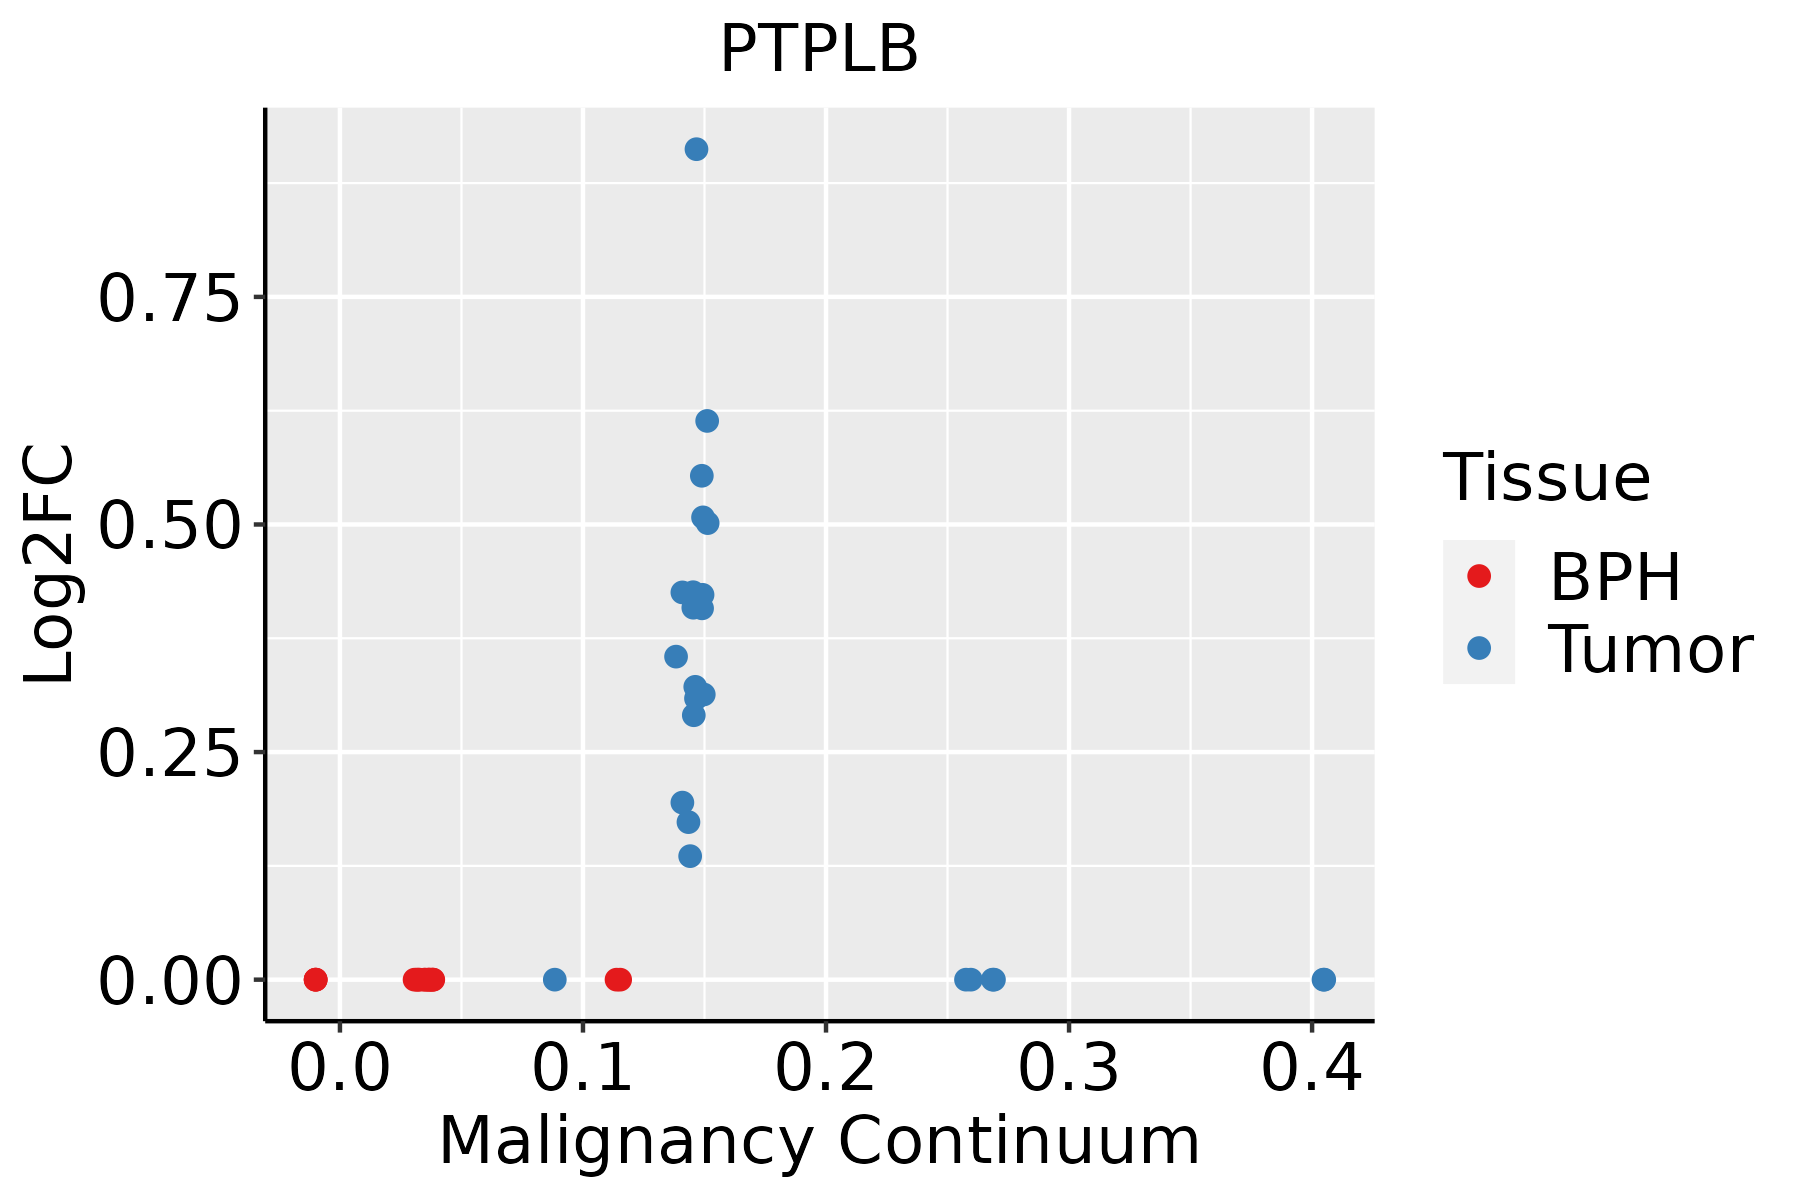 | BPH: Benign Prostatic Hyperplasia |
| Skin | 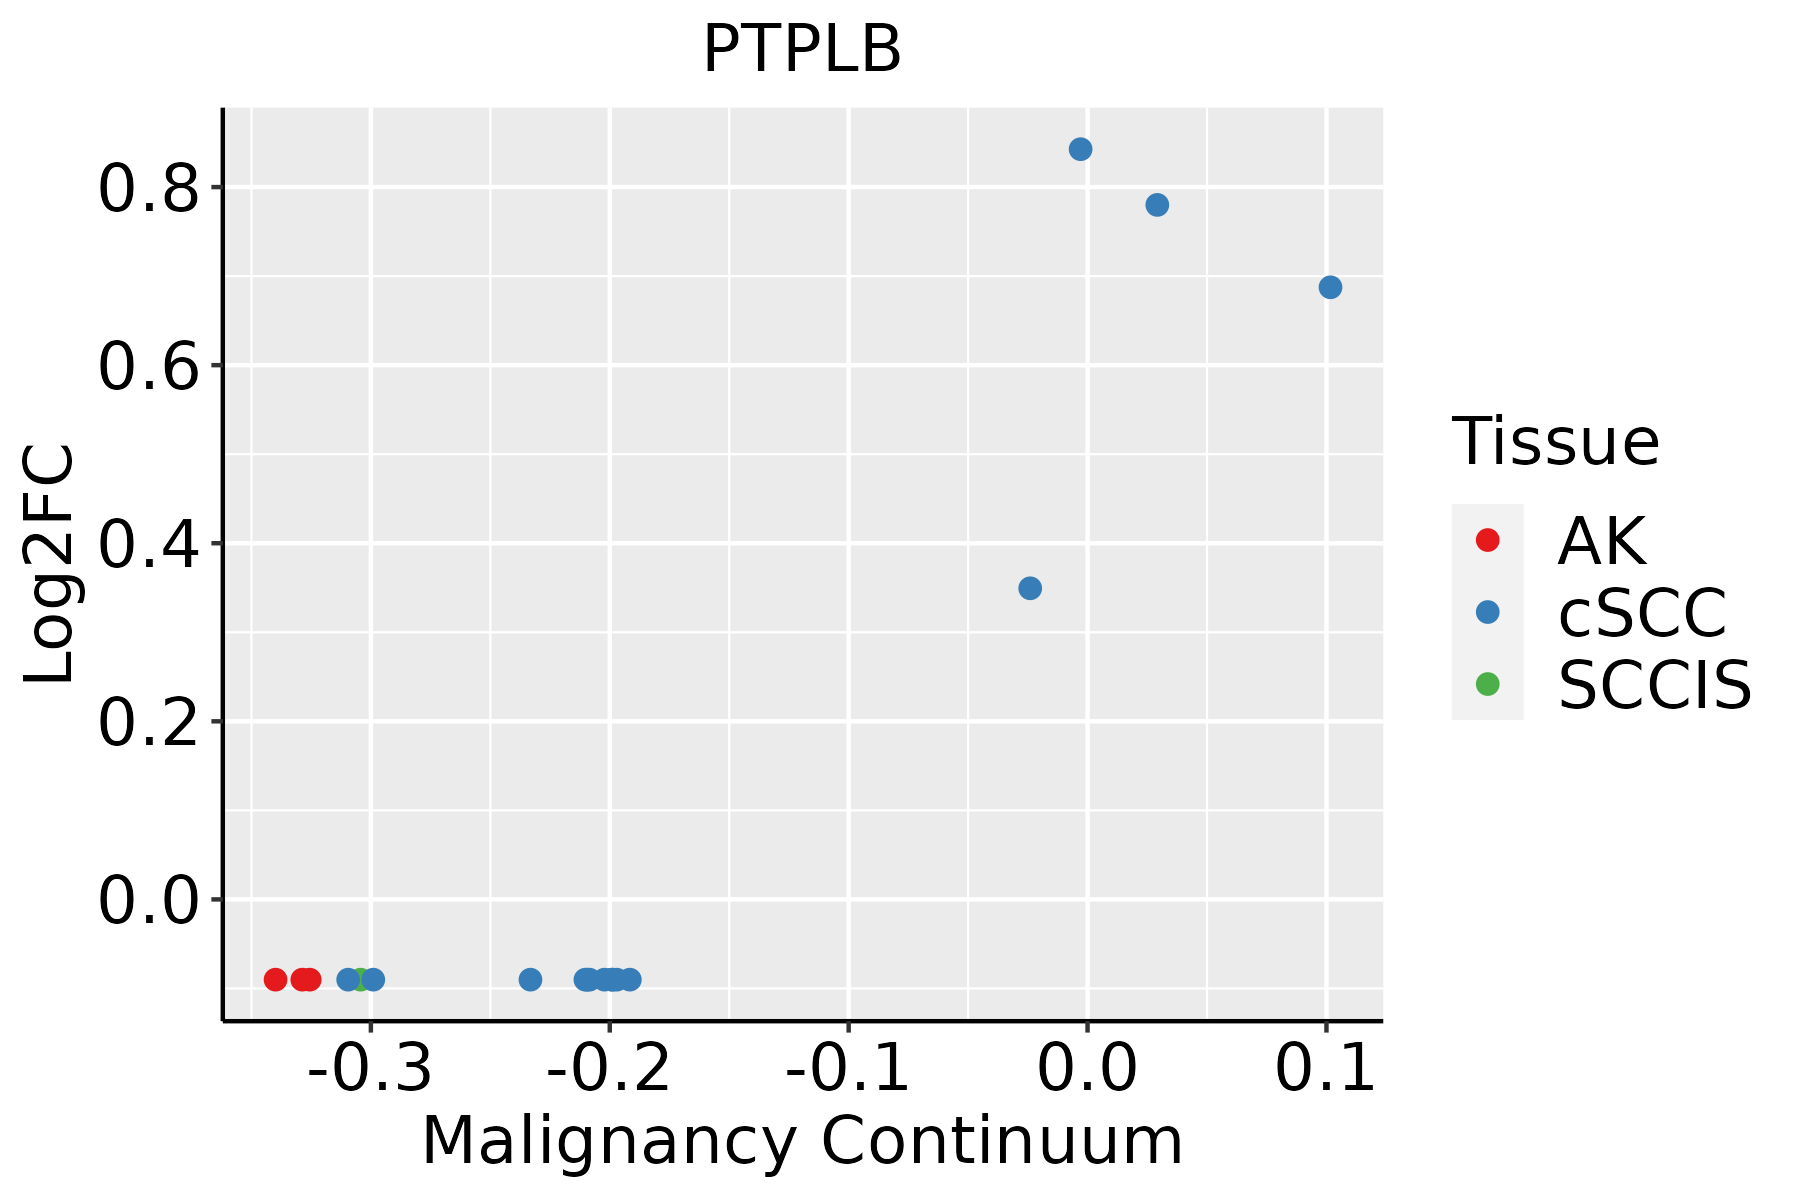 | AK: Actinic keratosis |
| cSCC: Cutaneous squamous cell carcinoma | ||
| SCCIS:squamous cell carcinoma in situ |
| ∗log2FC in expression of this searched gene in stem-like cells from each diseased tissue sample relative to stem-like cells in normal samples in each tissue plotted against the malignancy continuum. Samples are colored based on if they are from different disease stage. |
Top |
Malignant transformation related pathway analysis |
| Find out the enriched GO biological processes and KEGG pathways involved in transition from healthy to precancer to cancer |
| Tissue | Disease Stage | Enriched GO biological Processes |
| Stomach | WIM |  |
| Stomach | SIM |  |
| Liver | NAFLD |  |
| Liver | Cirrhotic |  |
| Liver | HCC |  |
| ∗Top 15 enriched GO BP terms are showed in the bar plot of each disease state in each tissue. Each row represents a significant GO biological process which is colored according to the -log10(p.adjust). |
| Page: 1 2 3 4 5 6 7 8 9 |
| GO ID | Tissue | Disease Stage | Description | Gene Ratio | Bg Ratio | pvalue | p.adjust | Count |
| Page: 1 |
| Pathway ID | Tissue | Disease Stage | Description | Gene Ratio | Bg Ratio | pvalue | p.adjust | qvalue | Count |
| hsa012129 | Esophagus | ESCC | Fatty acid metabolism | 41/4205 | 57/8465 | 5.13e-04 | 1.75e-03 | 8.98e-04 | 41 |
| hsa0121214 | Esophagus | ESCC | Fatty acid metabolism | 41/4205 | 57/8465 | 5.13e-04 | 1.75e-03 | 8.98e-04 | 41 |
| hsa012122 | Liver | Cirrhotic | Fatty acid metabolism | 32/2530 | 57/8465 | 3.12e-05 | 2.47e-04 | 1.52e-04 | 32 |
| hsa01040 | Liver | Cirrhotic | Biosynthesis of unsaturated fatty acids | 14/2530 | 27/8465 | 1.36e-02 | 4.25e-02 | 2.62e-02 | 14 |
| hsa012123 | Liver | Cirrhotic | Fatty acid metabolism | 32/2530 | 57/8465 | 3.12e-05 | 2.47e-04 | 1.52e-04 | 32 |
| hsa010401 | Liver | Cirrhotic | Biosynthesis of unsaturated fatty acids | 14/2530 | 27/8465 | 1.36e-02 | 4.25e-02 | 2.62e-02 | 14 |
| hsa012124 | Liver | HCC | Fatty acid metabolism | 45/4020 | 57/8465 | 1.05e-06 | 1.10e-05 | 6.09e-06 | 45 |
| hsa000622 | Liver | HCC | Fatty acid elongation | 20/4020 | 27/8465 | 4.58e-03 | 1.36e-02 | 7.55e-03 | 20 |
| hsa010402 | Liver | HCC | Biosynthesis of unsaturated fatty acids | 19/4020 | 27/8465 | 1.37e-02 | 3.33e-02 | 1.85e-02 | 19 |
| hsa012125 | Liver | HCC | Fatty acid metabolism | 45/4020 | 57/8465 | 1.05e-06 | 1.10e-05 | 6.09e-06 | 45 |
| hsa0006211 | Liver | HCC | Fatty acid elongation | 20/4020 | 27/8465 | 4.58e-03 | 1.36e-02 | 7.55e-03 | 20 |
| hsa010403 | Liver | HCC | Biosynthesis of unsaturated fatty acids | 19/4020 | 27/8465 | 1.37e-02 | 3.33e-02 | 1.85e-02 | 19 |
| hsa012128 | Oral cavity | OSCC | Fatty acid metabolism | 35/3704 | 57/8465 | 5.37e-03 | 1.29e-02 | 6.55e-03 | 35 |
| hsa0121213 | Oral cavity | OSCC | Fatty acid metabolism | 35/3704 | 57/8465 | 5.37e-03 | 1.29e-02 | 6.55e-03 | 35 |
| hsa0121221 | Prostate | Tumor | Fatty acid metabolism | 23/1791 | 57/8465 | 7.60e-04 | 3.59e-03 | 2.23e-03 | 23 |
| hsa010404 | Prostate | Tumor | Biosynthesis of unsaturated fatty acids | 12/1791 | 27/8465 | 5.53e-03 | 1.93e-02 | 1.19e-02 | 12 |
| hsa0121231 | Prostate | Tumor | Fatty acid metabolism | 23/1791 | 57/8465 | 7.60e-04 | 3.59e-03 | 2.23e-03 | 23 |
| hsa0104011 | Prostate | Tumor | Biosynthesis of unsaturated fatty acids | 12/1791 | 27/8465 | 5.53e-03 | 1.93e-02 | 1.19e-02 | 12 |
| Page: 1 |
Top |
Cell-cell communication analysis |
| Identification of potential cell-cell interactions between two cell types and their ligand-receptor pairs for different disease states |
| Ligand | Receptor | LRpair | Pathway | Tissue | Disease Stage |
| Page: 1 |
Top |
Single-cell gene regulatory network inference analysis |
| Find out the significant the regulons (TFs) and the target genes of each regulon across cell types for different disease states |
| TF | Cell Type | Tissue | Disease Stage | Target Gene | RSS | Regulon Activity |
| ∗The dot plots of a searched regulon are shown for all cell subpopulations in each disease state of each tissue based on the regulon specific score inferred using pySCENIC and by calculating the average expression. |
| Page: 1 |
Top |
Somatic mutation of malignant transformation related genes |
| Annotation of somatic variants for genes involved in malignant transformation |
| Hugo Symbol | Variant Class | Variant Classification | dbSNP RS | HGVSc | HGVSp | HGVSp Short | SWISSPROT | BIOTYPE | SIFT | PolyPhen | Tumor Sample Barcode | Tissue | Histology | Sex | Age | Stage | Therapy Types | Drugs | Outcome |
| Page: 1 |
Top |
Related drugs of malignant transformation related genes |
| Identification of chemicals and drugs interact with genes involved in malignant transfromation |
| (DGIdb 4.0) |
| Entrez ID | Symbol | Category | Interaction Types | Drug Claim Name | Drug Name | PMIDs |
| Page: 1 |

Copyright 2023-Present -The University of Texas Health Science Center at Houston |