
|
|||||
|
 | |
| |
| |
| |
| |
| |
|
Gene: PLAAT2 |
Gene summary for PLAAT2 |
| Gene information | Species | Human | Gene symbol | PLAAT2 | Gene ID | 54979 |
| Gene name | phospholipase A and acyltransferase 2 | |
| Gene Alias | HRASLS2 | |
| Cytomap | 11q12.3 | |
| Gene Type | protein-coding | GO ID | GO:0006629 | UniProtAcc | Q9NWW9 |
Top |
Malignant transformation analysis |
| Identification of the aberrant gene expression in precancerous and cancerous lesions by comparing the gene expression of stem-like cells in diseased tissues with normal stem cells |
| Entrez ID | Symbol | Replicates | Species | Organ | Tissue | Adj P-value | Log2FC | Malignancy |
| 54979 | PLAAT2 | Pat01-B | Human | Stomach | GC | 6.92e-32 | 6.40e-01 | 0.5754 |
| 54979 | PLAAT2 | Pat02-B | Human | Stomach | GC | 2.02e-08 | 2.15e-01 | 0.0368 |
| 54979 | PLAAT2 | Pat03-B | Human | Stomach | GC | 1.20e-22 | 5.22e-01 | 0.3693 |
| 54979 | PLAAT2 | Pat04-B | Human | Stomach | GC | 2.32e-02 | 1.30e-01 | -0.1483 |
| 54979 | PLAAT2 | Pat05-B | Human | Stomach | GC | 6.46e-04 | 2.39e-01 | -0.0353 |
| 54979 | PLAAT2 | Pat06-B | Human | Stomach | GC | 5.42e-11 | 2.69e-01 | -0.1961 |
| 54979 | PLAAT2 | Pat12-B | Human | Stomach | GC | 2.15e-02 | 1.55e-01 | 0.0325 |
| 54979 | PLAAT2 | Pat15-B | Human | Stomach | GC | 1.01e-03 | 1.77e-01 | -0.0778 |
| 54979 | PLAAT2 | Pat17-B | Human | Stomach | GC | 2.61e-20 | 6.03e-01 | 0.3109 |
| 54979 | PLAAT2 | Pat19-B | Human | Stomach | GC | 1.05e-02 | 1.61e-01 | 0.0826 |
| 54979 | PLAAT2 | Pat22-B | Human | Stomach | GC | 1.74e-27 | 6.49e-01 | -0.1042 |
| 54979 | PLAAT2 | Pat24-B | Human | Stomach | GC | 8.12e-17 | 5.74e-01 | -0.1184 |
| Page: 1 |
| Tissue | Expression Dynamics | Abbreviation |
| GC | 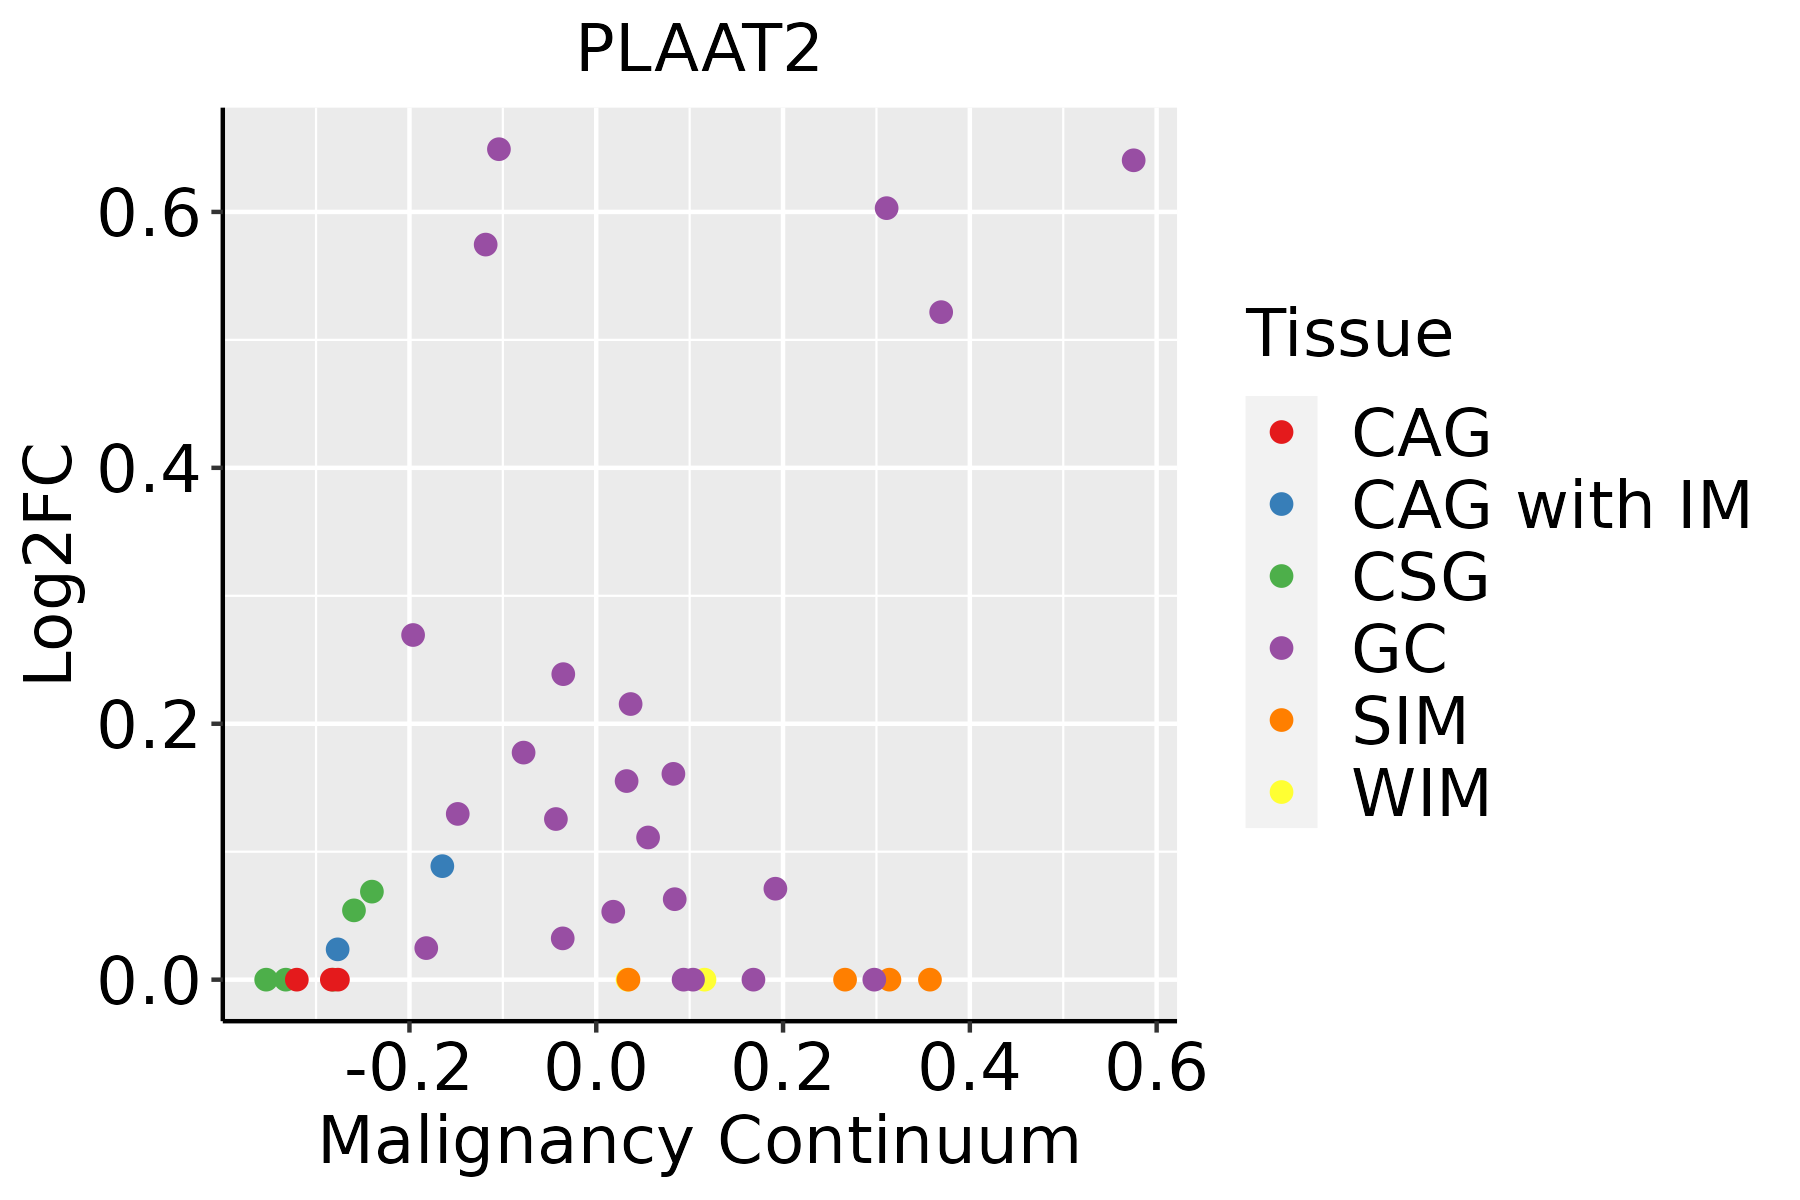 | CAG: Chronic atrophic gastritis |
| CAG with IM: Chronic atrophic gastritis with intestinal metaplasia | ||
| CSG: Chronic superficial gastritis | ||
| GC: Gastric cancer | ||
| SIM: Severe intestinal metaplasia | ||
| WIM: Wild intestinal metaplasia |
| ∗log2FC in expression of this searched gene in stem-like cells from each diseased tissue sample relative to stem-like cells in normal samples in each tissue plotted against the malignancy continuum. Samples are colored based on if they are from different disease stage. |
Top |
Malignant transformation related pathway analysis |
| Find out the enriched GO biological processes and KEGG pathways involved in transition from healthy to precancer to cancer |
| Tissue | Disease Stage | Enriched GO biological Processes |
| Stomach | WIM |  |
| Stomach | SIM |  |
| Liver | NAFLD |  |
| Liver | Cirrhotic |  |
| Liver | HCC |  |
| ∗Top 15 enriched GO BP terms are showed in the bar plot of each disease state in each tissue. Each row represents a significant GO biological process which is colored according to the -log10(p.adjust). |
| Page: 1 2 3 4 5 6 7 8 9 |
| GO ID | Tissue | Disease Stage | Description | Gene Ratio | Bg Ratio | pvalue | p.adjust | Count |
| GO:00160425 | Stomach | GC | lipid catabolic process | 41/1159 | 320/18723 | 7.84e-06 | 2.80e-04 | 41 |
| GO:00464862 | Stomach | GC | glycerolipid metabolic process | 38/1159 | 392/18723 | 4.15e-03 | 3.47e-02 | 38 |
| GO:0046470 | Stomach | GC | phosphatidylcholine metabolic process | 11/1159 | 74/18723 | 5.62e-03 | 4.34e-02 | 11 |
| Page: 1 |
| Pathway ID | Tissue | Disease Stage | Description | Gene Ratio | Bg Ratio | pvalue | p.adjust | qvalue | Count |
| Page: 1 |
Top |
Cell-cell communication analysis |
| Identification of potential cell-cell interactions between two cell types and their ligand-receptor pairs for different disease states |
| Ligand | Receptor | LRpair | Pathway | Tissue | Disease Stage |
| Page: 1 |
Top |
Single-cell gene regulatory network inference analysis |
| Find out the significant the regulons (TFs) and the target genes of each regulon across cell types for different disease states |
| TF | Cell Type | Tissue | Disease Stage | Target Gene | RSS | Regulon Activity |
| ∗The dot plots of a searched regulon are shown for all cell subpopulations in each disease state of each tissue based on the regulon specific score inferred using pySCENIC and by calculating the average expression. |
| Page: 1 |
Top |
Somatic mutation of malignant transformation related genes |
| Annotation of somatic variants for genes involved in malignant transformation |
| Hugo Symbol | Variant Class | Variant Classification | dbSNP RS | HGVSc | HGVSp | HGVSp Short | SWISSPROT | BIOTYPE | SIFT | PolyPhen | Tumor Sample Barcode | Tissue | Histology | Sex | Age | Stage | Therapy Types | Drugs | Outcome |
| Page: 1 |
Top |
Related drugs of malignant transformation related genes |
| Identification of chemicals and drugs interact with genes involved in malignant transfromation |
| (DGIdb 4.0) |
| Entrez ID | Symbol | Category | Interaction Types | Drug Claim Name | Drug Name | PMIDs |
| Page: 1 |

Copyright 2023-Present -The University of Texas Health Science Center at Houston |