
|
|||||
|
 | |
| |
| |
| |
| |
| |
|
Gene: PIP4P2 |
Gene summary for PIP4P2 |
| Gene information | Species | Human | Gene symbol | PIP4P2 | Gene ID | 55529 |
| Gene name | phosphatidylinositol-4,5-bisphosphate 4-phosphatase 2 | |
| Gene Alias | TMEM55A | |
| Cytomap | 8q21.3 | |
| Gene Type | protein-coding | GO ID | GO:0006629 | UniProtAcc | Q8N4L2 |
Top |
Malignant transformation analysis |
| Identification of the aberrant gene expression in precancerous and cancerous lesions by comparing the gene expression of stem-like cells in diseased tissues with normal stem cells |
| Entrez ID | Symbol | Replicates | Species | Organ | Tissue | Adj P-value | Log2FC | Malignancy |
| 55529 | PIP4P2 | S014 | Human | Liver | HCC | 5.56e-27 | 9.86e-01 | 0.2254 |
| 55529 | PIP4P2 | S015 | Human | Liver | HCC | 1.50e-27 | 9.35e-01 | 0.2375 |
| 55529 | PIP4P2 | S016 | Human | Liver | HCC | 1.77e-35 | 1.00e+00 | 0.2243 |
| 55529 | PIP4P2 | S027 | Human | Liver | HCC | 8.01e-14 | 1.04e+00 | 0.2446 |
| 55529 | PIP4P2 | S028 | Human | Liver | HCC | 1.51e-28 | 1.19e+00 | 0.2503 |
| 55529 | PIP4P2 | S029 | Human | Liver | HCC | 6.58e-35 | 1.48e+00 | 0.2581 |
| 55529 | PIP4P2 | PTC05 | Human | Thyroid | PTC | 2.31e-02 | 1.52e-01 | 0.2065 |
| 55529 | PIP4P2 | PTC06 | Human | Thyroid | PTC | 3.49e-02 | 1.09e-01 | 0.2057 |
| 55529 | PIP4P2 | PTC07 | Human | Thyroid | PTC | 5.43e-04 | 1.25e-01 | 0.2044 |
| 55529 | PIP4P2 | ATC12 | Human | Thyroid | ATC | 5.96e-08 | 1.90e-01 | 0.34 |
| 55529 | PIP4P2 | ATC13 | Human | Thyroid | ATC | 7.27e-33 | 6.61e-01 | 0.34 |
| 55529 | PIP4P2 | ATC1 | Human | Thyroid | ATC | 8.56e-03 | 1.56e-01 | 0.2878 |
| 55529 | PIP4P2 | ATC2 | Human | Thyroid | ATC | 2.49e-06 | 3.68e-01 | 0.34 |
| 55529 | PIP4P2 | ATC4 | Human | Thyroid | ATC | 4.82e-12 | 2.72e-01 | 0.34 |
| 55529 | PIP4P2 | ATC5 | Human | Thyroid | ATC | 9.31e-45 | 7.20e-01 | 0.34 |
| Page: 1 |
| Tissue | Expression Dynamics | Abbreviation |
| Liver | 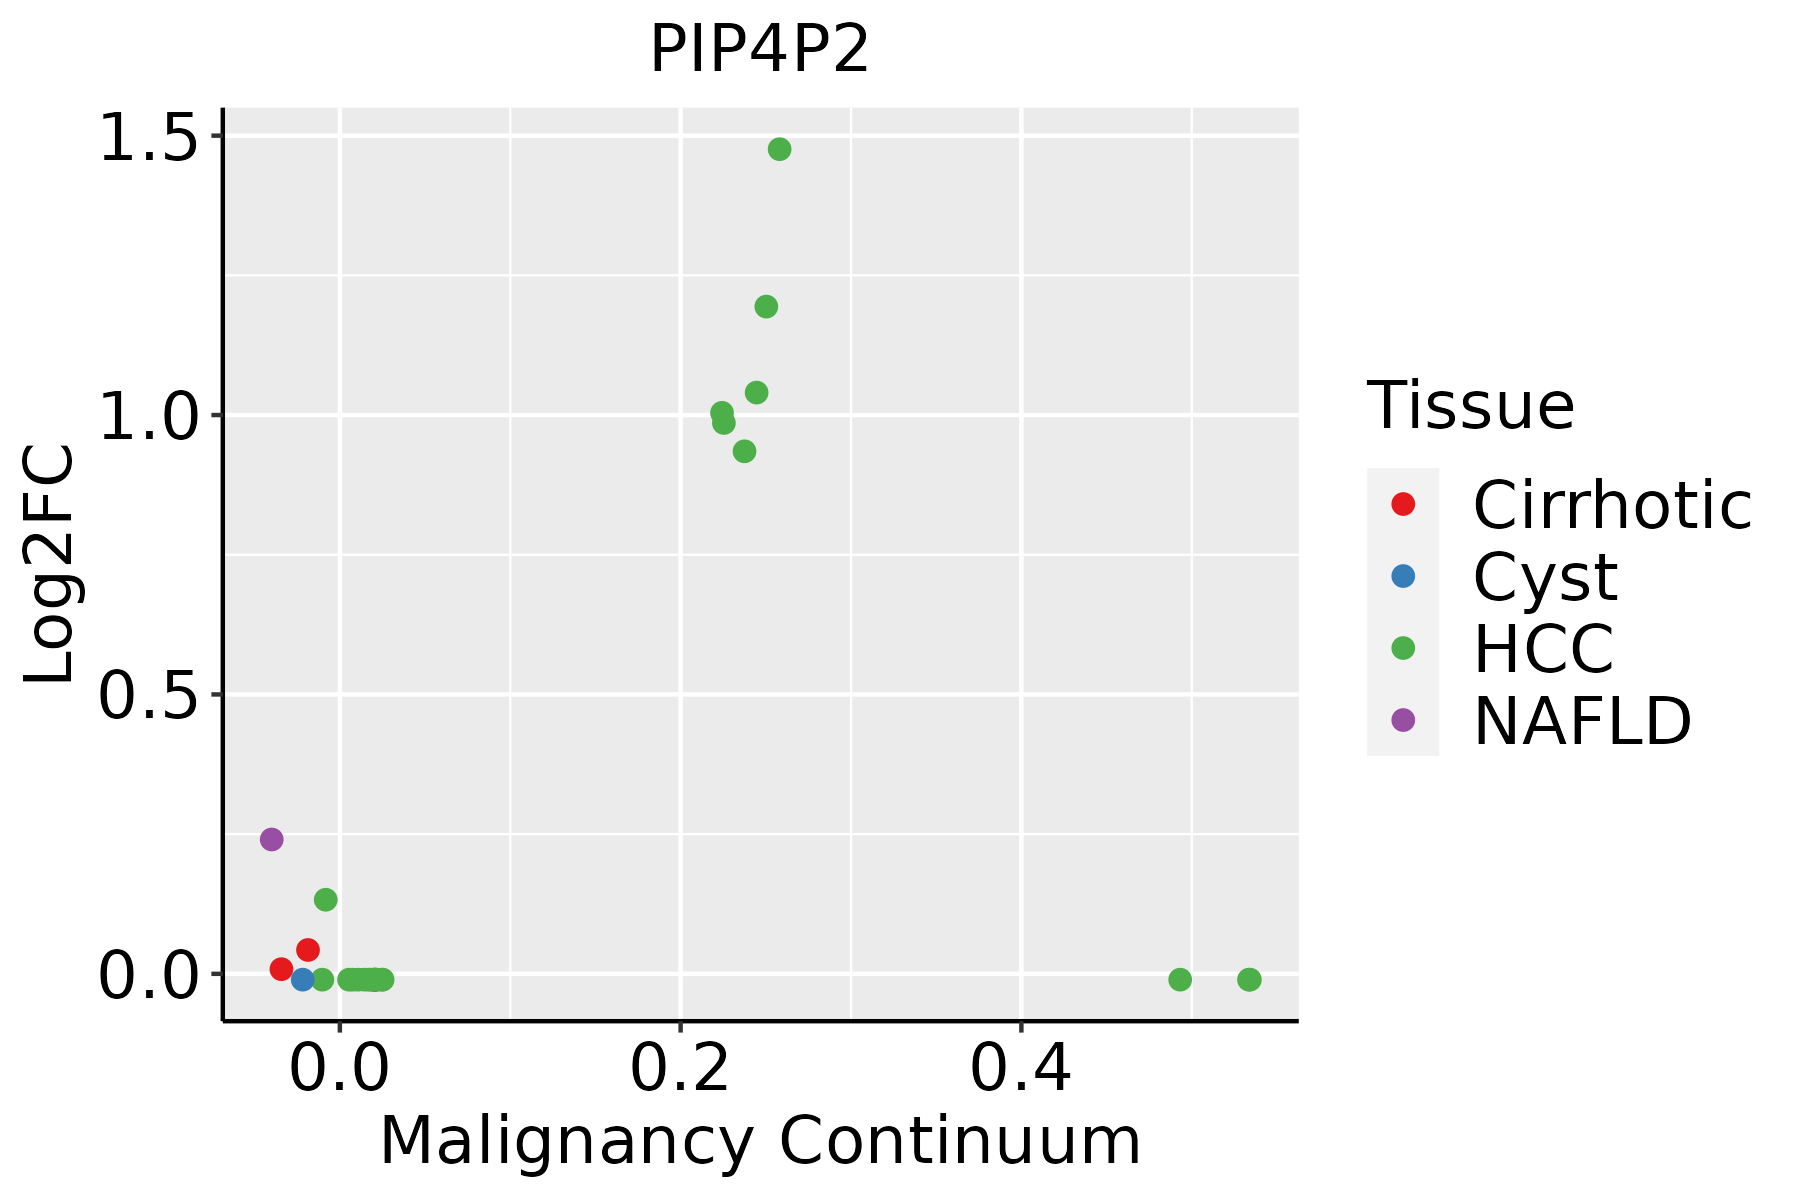 | HCC: Hepatocellular carcinoma |
| NAFLD: Non-alcoholic fatty liver disease | ||
| Thyroid | 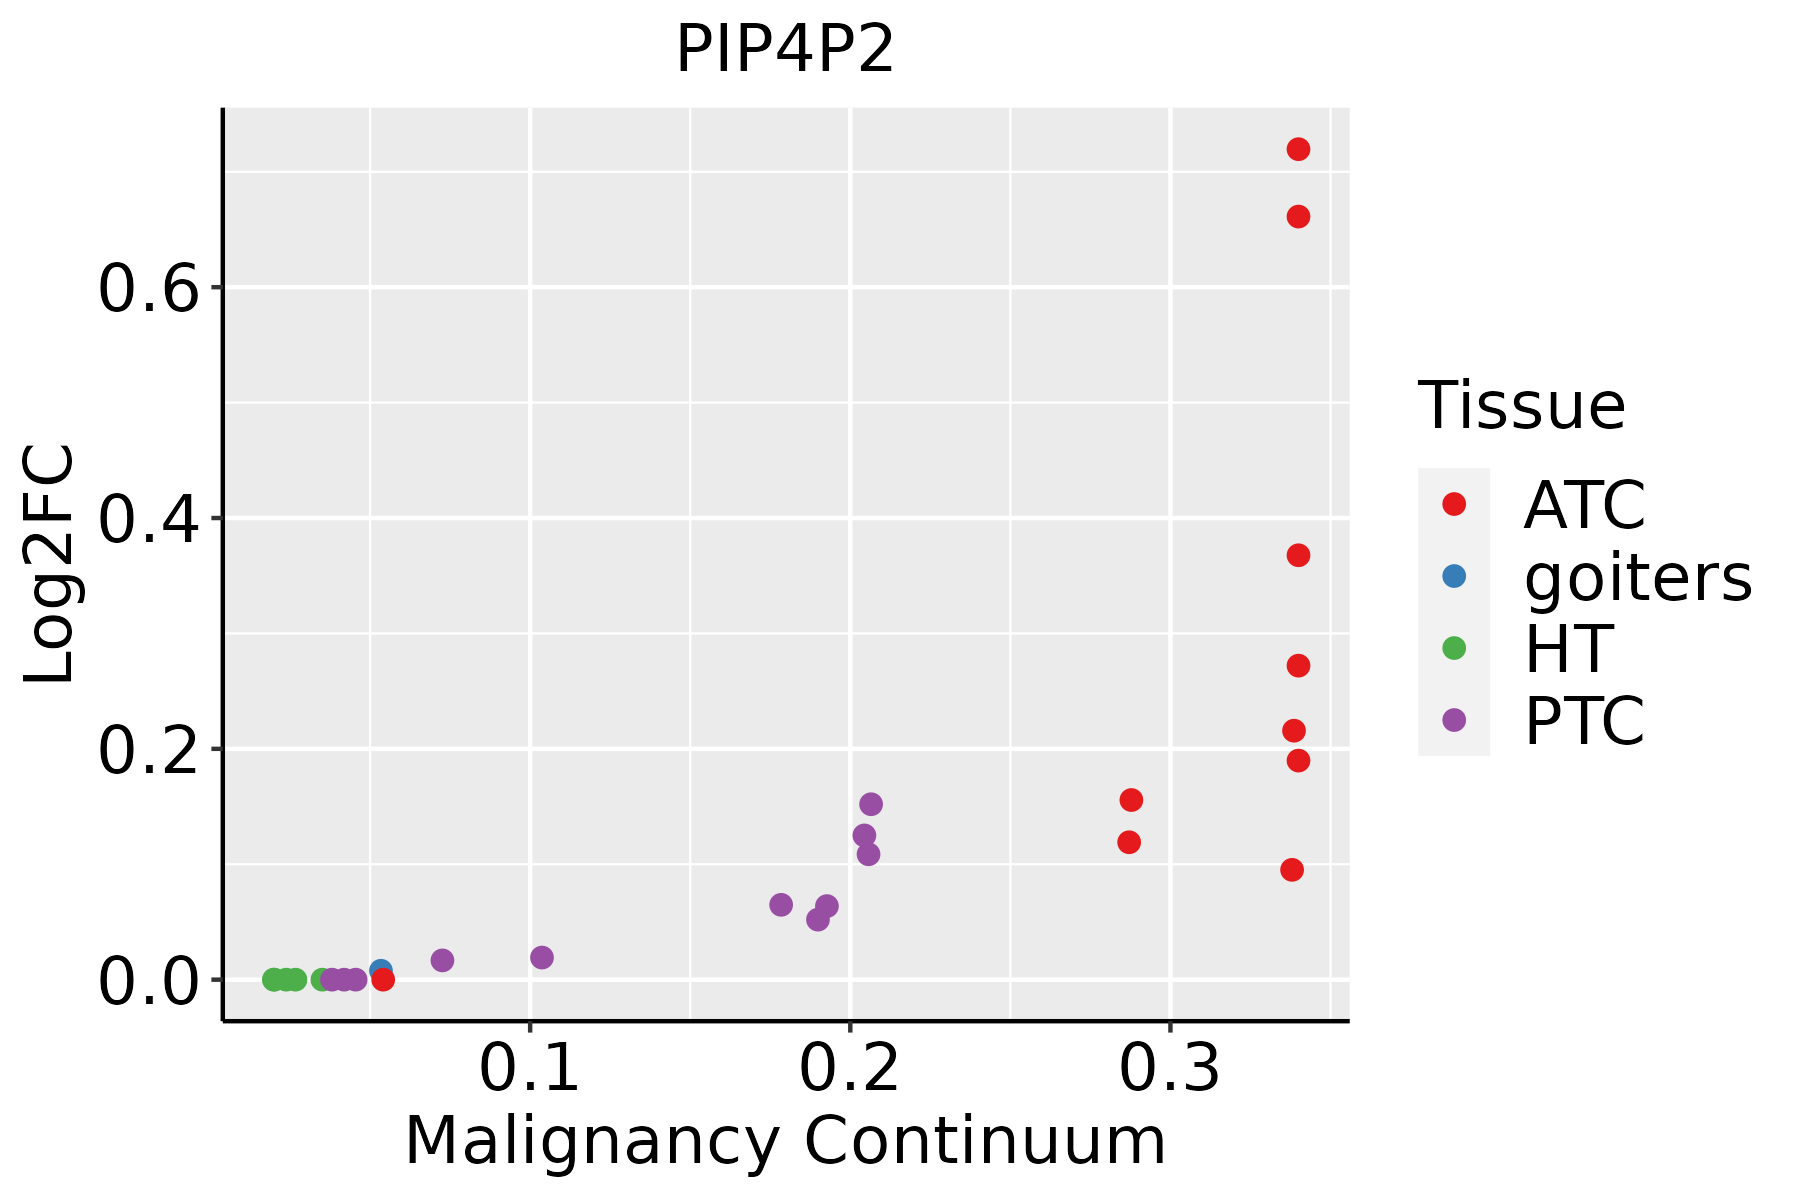 | ATC: Anaplastic thyroid cancer |
| HT: Hashimoto's thyroiditis | ||
| PTC: Papillary thyroid cancer |
| ∗log2FC in expression of this searched gene in stem-like cells from each diseased tissue sample relative to stem-like cells in normal samples in each tissue plotted against the malignancy continuum. Samples are colored based on if they are from different disease stage. |
Top |
Malignant transformation related pathway analysis |
| Find out the enriched GO biological processes and KEGG pathways involved in transition from healthy to precancer to cancer |
| Tissue | Disease Stage | Enriched GO biological Processes |
| Stomach | WIM |  |
| Stomach | SIM |  |
| Liver | NAFLD |  |
| Liver | Cirrhotic |  |
| Liver | HCC |  |
| ∗Top 15 enriched GO BP terms are showed in the bar plot of each disease state in each tissue. Each row represents a significant GO biological process which is colored according to the -log10(p.adjust). |
| Page: 1 2 3 4 5 6 7 8 9 |
| GO ID | Tissue | Disease Stage | Description | Gene Ratio | Bg Ratio | pvalue | p.adjust | Count |
| GO:00066444 | Liver | HCC | phospholipid metabolic process | 214/7958 | 383/18723 | 7.25e-08 | 1.48e-06 | 214 |
| GO:001631121 | Liver | HCC | dephosphorylation | 230/7958 | 417/18723 | 1.00e-07 | 1.96e-06 | 230 |
| GO:004648611 | Liver | HCC | glycerolipid metabolic process | 215/7958 | 392/18723 | 4.54e-07 | 7.49e-06 | 215 |
| GO:003025821 | Liver | HCC | lipid modification | 123/7958 | 212/18723 | 3.50e-06 | 4.58e-05 | 123 |
| GO:00066504 | Liver | HCC | glycerophospholipid metabolic process | 168/7958 | 306/18723 | 7.27e-06 | 8.62e-05 | 168 |
| GO:001631116 | Thyroid | PTC | dephosphorylation | 174/5968 | 417/18723 | 1.20e-05 | 1.31e-04 | 174 |
| GO:00510518 | Thyroid | PTC | negative regulation of transport | 176/5968 | 470/18723 | 5.44e-03 | 2.49e-02 | 176 |
| GO:0050765 | Thyroid | PTC | negative regulation of phagocytosis | 13/5968 | 23/18723 | 1.25e-02 | 4.88e-02 | 13 |
| GO:001631117 | Thyroid | ATC | dephosphorylation | 179/6293 | 417/18723 | 3.88e-05 | 3.15e-04 | 179 |
| GO:005105114 | Thyroid | ATC | negative regulation of transport | 183/6293 | 470/18723 | 8.12e-03 | 3.13e-02 | 183 |
| Page: 1 |
| Pathway ID | Tissue | Disease Stage | Description | Gene Ratio | Bg Ratio | pvalue | p.adjust | qvalue | Count |
| Page: 1 |
Top |
Cell-cell communication analysis |
| Identification of potential cell-cell interactions between two cell types and their ligand-receptor pairs for different disease states |
| Ligand | Receptor | LRpair | Pathway | Tissue | Disease Stage |
| Page: 1 |
Top |
Single-cell gene regulatory network inference analysis |
| Find out the significant the regulons (TFs) and the target genes of each regulon across cell types for different disease states |
| TF | Cell Type | Tissue | Disease Stage | Target Gene | RSS | Regulon Activity |
| ∗The dot plots of a searched regulon are shown for all cell subpopulations in each disease state of each tissue based on the regulon specific score inferred using pySCENIC and by calculating the average expression. |
| Page: 1 |
Top |
Somatic mutation of malignant transformation related genes |
| Annotation of somatic variants for genes involved in malignant transformation |
| Hugo Symbol | Variant Class | Variant Classification | dbSNP RS | HGVSc | HGVSp | HGVSp Short | SWISSPROT | BIOTYPE | SIFT | PolyPhen | Tumor Sample Barcode | Tissue | Histology | Sex | Age | Stage | Therapy Types | Drugs | Outcome |
| Page: 1 |
Top |
Related drugs of malignant transformation related genes |
| Identification of chemicals and drugs interact with genes involved in malignant transfromation |
| (DGIdb 4.0) |
| Entrez ID | Symbol | Category | Interaction Types | Drug Claim Name | Drug Name | PMIDs |
| Page: 1 |

Copyright 2023-Present -The University of Texas Health Science Center at Houston |