
|
|||||
|
 | |
| |
| |
| |
| |
| |
|
Gene: PFKFB3 |
Gene summary for PFKFB3 |
| Gene information | Species | Human | Gene symbol | PFKFB3 | Gene ID | 5209 |
| Gene name | 6-phosphofructo-2-kinase/fructose-2,6-biphosphatase 3 | |
| Gene Alias | IPFK2 | |
| Cytomap | 10p15.1 | |
| Gene Type | protein-coding | GO ID | GO:0005975 | UniProtAcc | B7Z8A0 |
Top |
Malignant transformation analysis |
| Identification of the aberrant gene expression in precancerous and cancerous lesions by comparing the gene expression of stem-like cells in diseased tissues with normal stem cells |
| Entrez ID | Symbol | Replicates | Species | Organ | Tissue | Adj P-value | Log2FC | Malignancy |
| 5209 | PFKFB3 | AEH-subject1 | Human | Endometrium | AEH | 1.39e-27 | 5.89e-01 | -0.3059 |
| 5209 | PFKFB3 | AEH-subject2 | Human | Endometrium | AEH | 1.72e-12 | 4.82e-01 | -0.2525 |
| 5209 | PFKFB3 | AEH-subject3 | Human | Endometrium | AEH | 8.86e-20 | 5.43e-01 | -0.2576 |
| 5209 | PFKFB3 | AEH-subject4 | Human | Endometrium | AEH | 1.55e-11 | 5.29e-01 | -0.2657 |
| 5209 | PFKFB3 | EEC-subject1 | Human | Endometrium | EEC | 4.29e-22 | 5.09e-01 | -0.2682 |
| 5209 | PFKFB3 | EEC-subject2 | Human | Endometrium | EEC | 9.20e-11 | 4.30e-01 | -0.2607 |
| 5209 | PFKFB3 | EEC-subject3 | Human | Endometrium | EEC | 1.32e-02 | 2.16e-01 | -0.2525 |
| 5209 | PFKFB3 | EEC-subject4 | Human | Endometrium | EEC | 6.47e-05 | 2.72e-01 | -0.2571 |
| 5209 | PFKFB3 | EEC-subject5 | Human | Endometrium | EEC | 7.06e-10 | 3.63e-01 | -0.249 |
| 5209 | PFKFB3 | GSM6177620_NYU_UCEC1_lib1_lib1 | Human | Endometrium | EEC | 1.85e-03 | 5.77e-02 | -0.1869 |
| 5209 | PFKFB3 | GSM6177620_NYU_UCEC1_lib2_lib2 | Human | Endometrium | EEC | 1.45e-03 | 4.61e-02 | -0.1875 |
| 5209 | PFKFB3 | GSM6177620_NYU_UCEC1_lib3_lib3 | Human | Endometrium | EEC | 9.58e-04 | 1.00e-01 | -0.1883 |
| 5209 | PFKFB3 | GSM6177621_NYU_UCEC2_lib1_lib1 | Human | Endometrium | EEC | 1.64e-14 | 5.23e-01 | -0.1934 |
| 5209 | PFKFB3 | GSM6177622_NYU_UCEC3_lib1_lib1 | Human | Endometrium | EEC | 5.90e-03 | 2.04e-02 | -0.1917 |
| 5209 | PFKFB3 | GSM6177622_NYU_UCEC3_lib2_lib2 | Human | Endometrium | EEC | 6.89e-09 | 3.37e-02 | -0.1916 |
| 5209 | PFKFB3 | LZE4T | Human | Esophagus | ESCC | 4.22e-09 | -1.48e-01 | 0.0811 |
| 5209 | PFKFB3 | LZE20T | Human | Esophagus | ESCC | 7.18e-05 | -4.66e-01 | 0.0662 |
| 5209 | PFKFB3 | LZE21D1 | Human | Esophagus | HGIN | 2.09e-02 | -5.55e-01 | 0.0632 |
| 5209 | PFKFB3 | LZE22D1 | Human | Esophagus | HGIN | 4.92e-09 | -4.92e-01 | 0.0595 |
| 5209 | PFKFB3 | LZE22T | Human | Esophagus | ESCC | 1.18e-05 | -5.86e-01 | 0.068 |
| Page: 1 2 3 4 5 |
| Tissue | Expression Dynamics | Abbreviation |
| Endometrium |  | AEH: Atypical endometrial hyperplasia |
| EEC: Endometrioid Cancer | ||
| Esophagus | 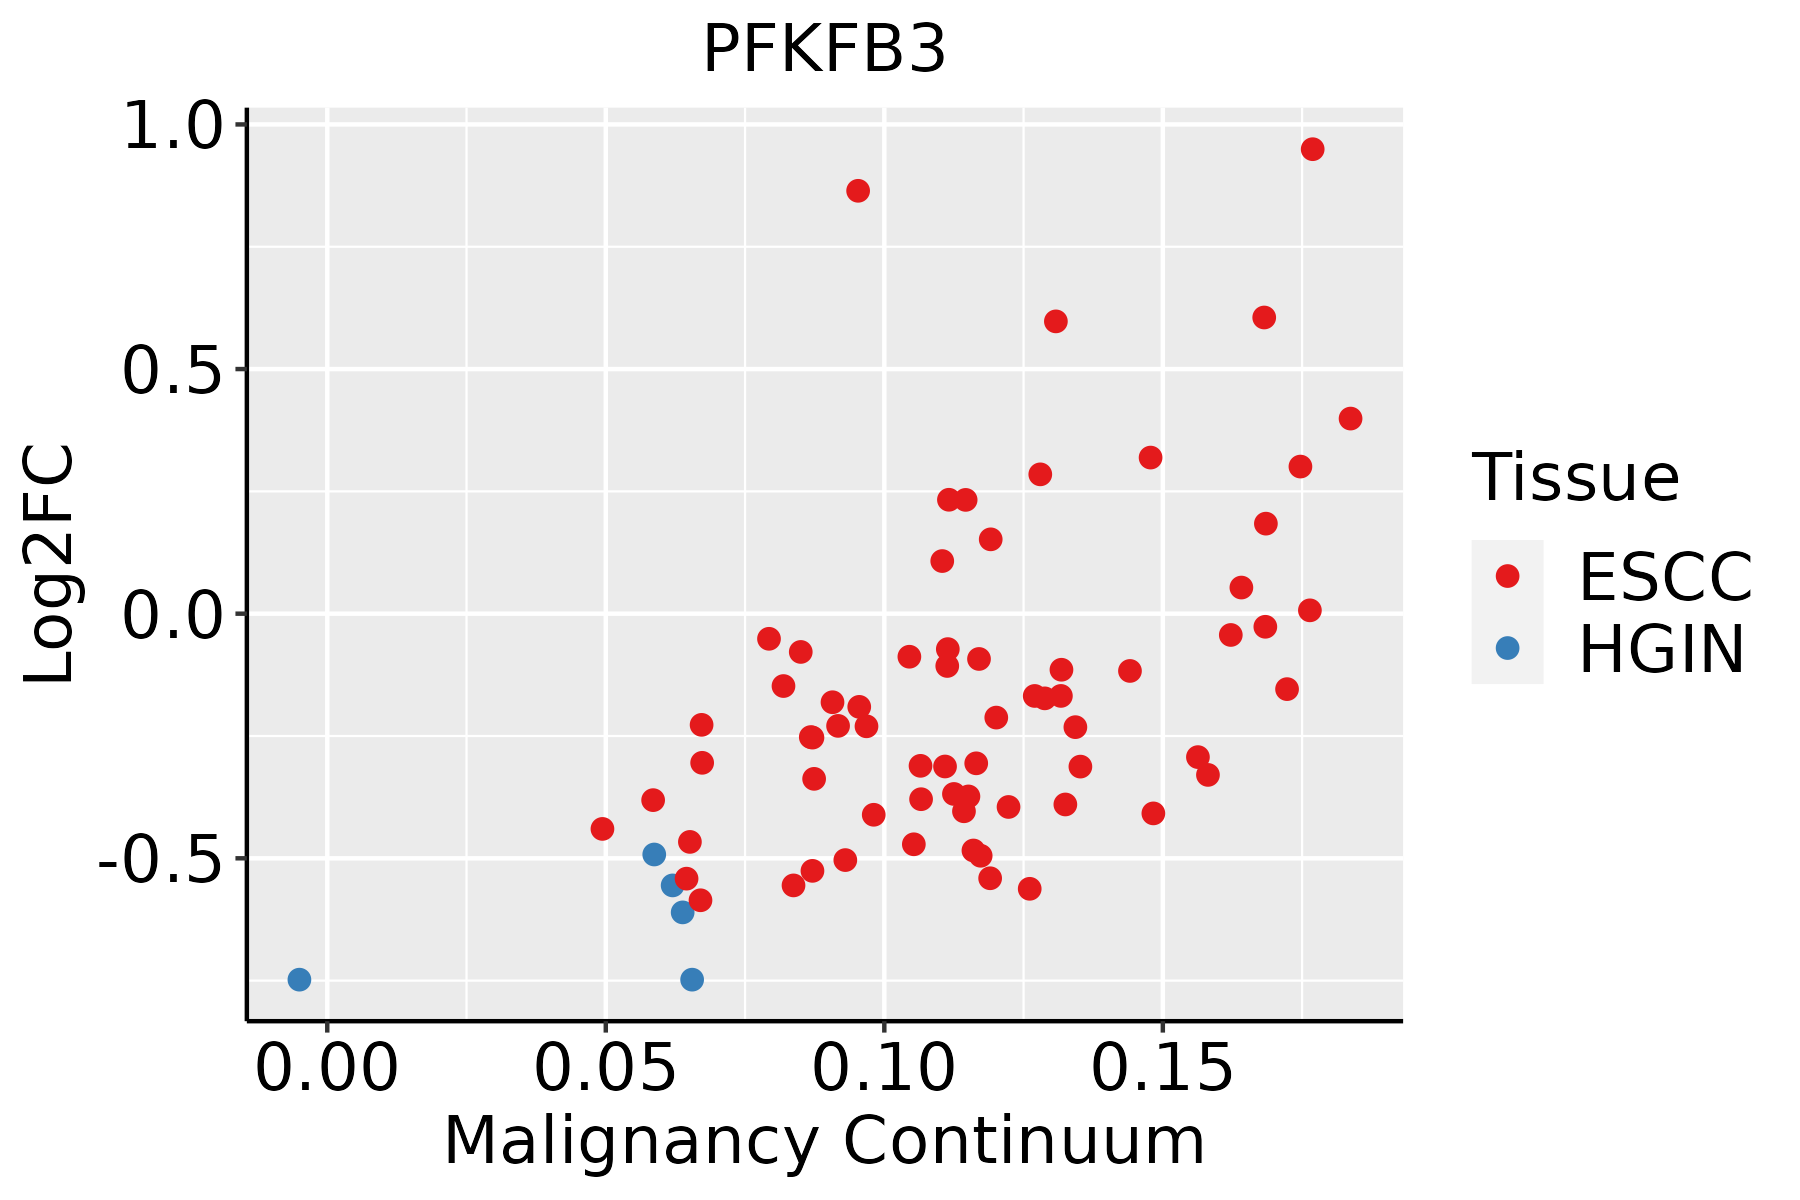 | ESCC: Esophageal squamous cell carcinoma |
| HGIN: High-grade intraepithelial neoplasias | ||
| LGIN: Low-grade intraepithelial neoplasias | ||
| Oral Cavity | 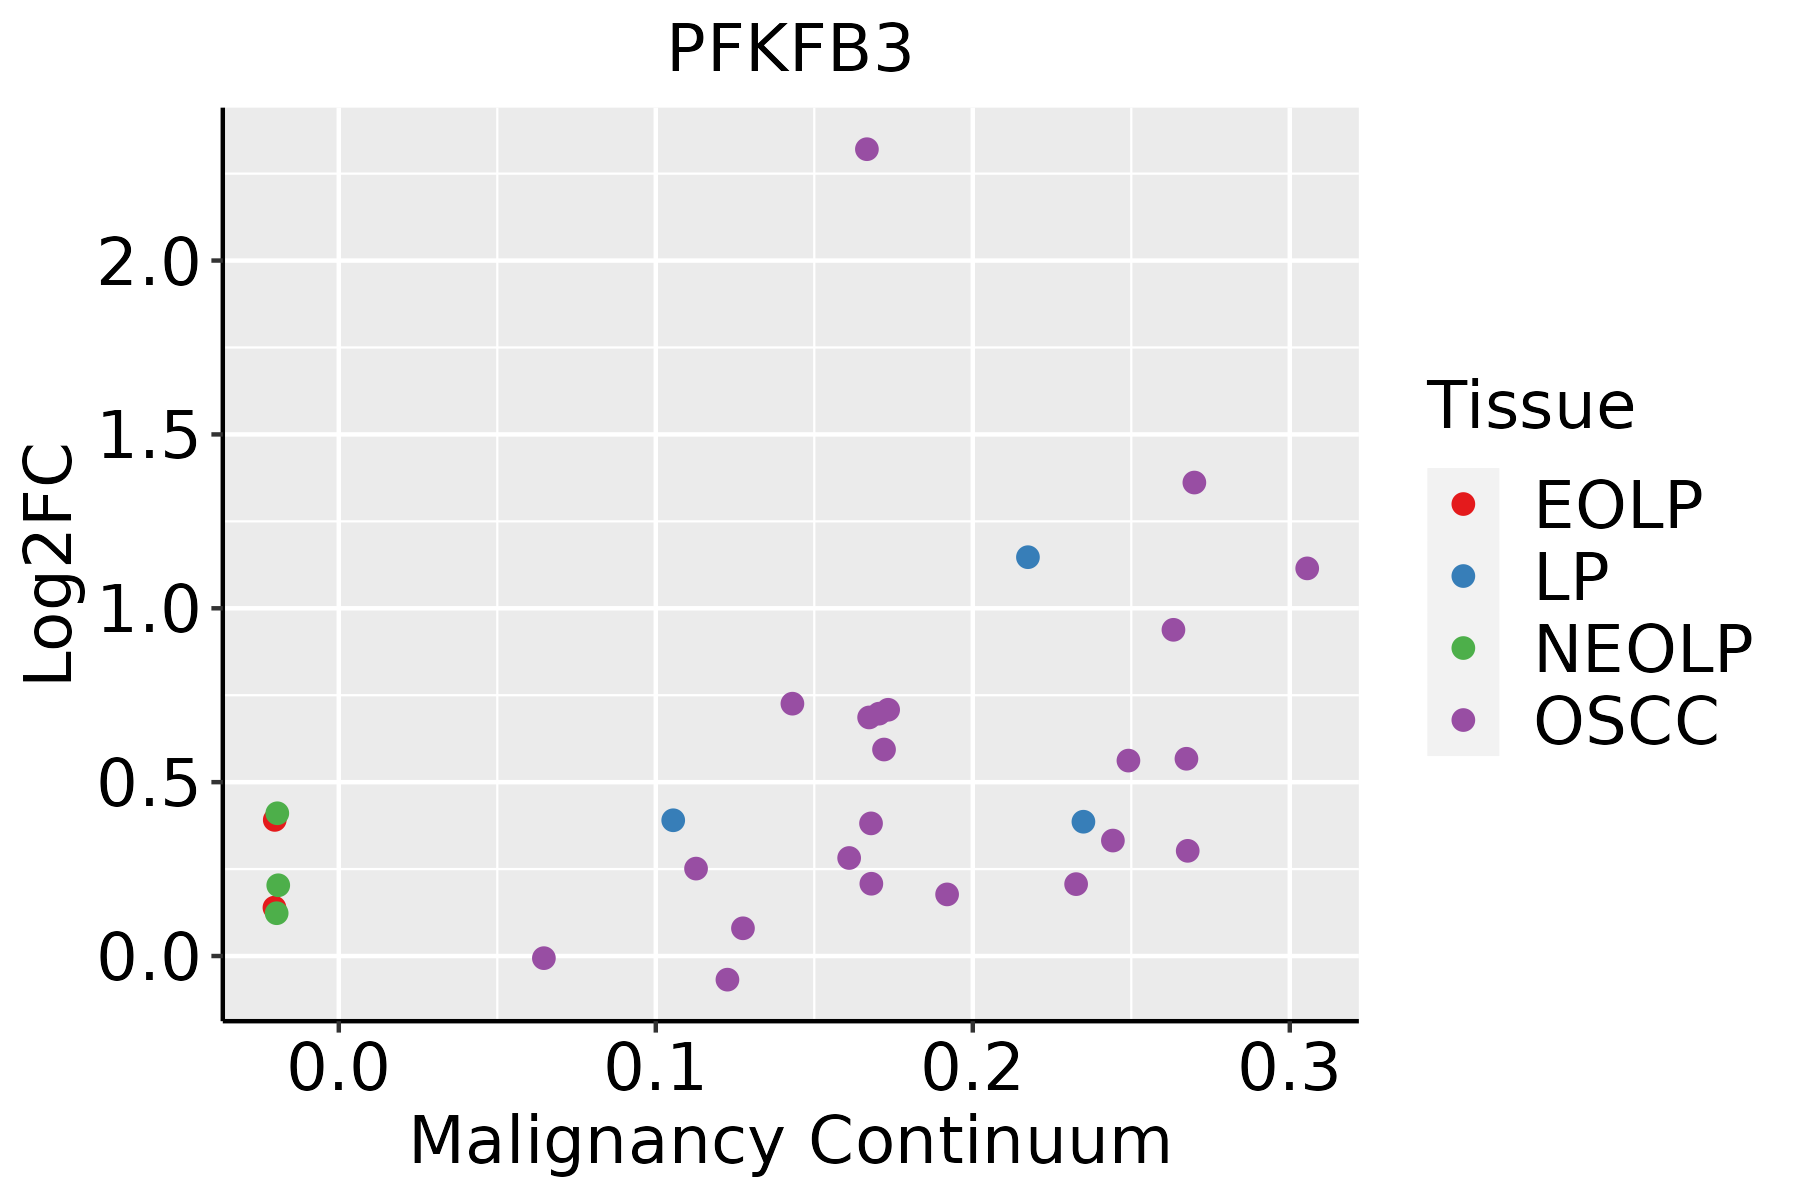 | EOLP: Erosive Oral lichen planus |
| LP: leukoplakia | ||
| NEOLP: Non-erosive oral lichen planus | ||
| OSCC: Oral squamous cell carcinoma |
| ∗log2FC in expression of this searched gene in stem-like cells from each diseased tissue sample relative to stem-like cells in normal samples in each tissue plotted against the malignancy continuum. Samples are colored based on if they are from different disease stage. |
Top |
Malignant transformation related pathway analysis |
| Find out the enriched GO biological processes and KEGG pathways involved in transition from healthy to precancer to cancer |
| Tissue | Disease Stage | Enriched GO biological Processes |
| Stomach | WIM |  |
| Stomach | SIM |  |
| Liver | NAFLD |  |
| Liver | Cirrhotic |  |
| Liver | HCC |  |
| ∗Top 15 enriched GO BP terms are showed in the bar plot of each disease state in each tissue. Each row represents a significant GO biological process which is colored according to the -log10(p.adjust). |
| Page: 1 2 3 4 5 6 7 8 9 |
| GO ID | Tissue | Disease Stage | Description | Gene Ratio | Bg Ratio | pvalue | p.adjust | Count |
| GO:001631110 | Esophagus | ESCC | dephosphorylation | 251/8552 | 417/18723 | 1.26e-09 | 2.99e-08 | 251 |
| GO:00059969 | Esophagus | ESCC | monosaccharide metabolic process | 159/8552 | 257/18723 | 1.11e-07 | 1.81e-06 | 159 |
| GO:00193189 | Esophagus | ESCC | hexose metabolic process | 147/8552 | 237/18723 | 2.63e-07 | 3.94e-06 | 147 |
| GO:00442626 | Esophagus | ESCC | cellular carbohydrate metabolic process | 160/8552 | 283/18723 | 1.43e-04 | 9.66e-04 | 160 |
| GO:00163119 | Oral cavity | OSCC | dephosphorylation | 220/7305 | 417/18723 | 6.33e-09 | 1.34e-07 | 220 |
| GO:00059968 | Oral cavity | OSCC | monosaccharide metabolic process | 129/7305 | 257/18723 | 1.63e-04 | 1.13e-03 | 129 |
| GO:00193188 | Oral cavity | OSCC | hexose metabolic process | 118/7305 | 237/18723 | 4.53e-04 | 2.73e-03 | 118 |
| GO:00442625 | Oral cavity | OSCC | cellular carbohydrate metabolic process | 130/7305 | 283/18723 | 9.98e-03 | 3.49e-02 | 130 |
| GO:000599613 | Oral cavity | LP | monosaccharide metabolic process | 86/4623 | 257/18723 | 9.13e-04 | 7.79e-03 | 86 |
| GO:001931813 | Oral cavity | LP | hexose metabolic process | 78/4623 | 237/18723 | 2.55e-03 | 1.80e-02 | 78 |
| GO:001631114 | Oral cavity | EOLP | dephosphorylation | 85/2218 | 417/18723 | 3.19e-07 | 9.47e-06 | 85 |
| GO:001631122 | Oral cavity | NEOLP | dephosphorylation | 64/2005 | 417/18723 | 1.98e-03 | 1.33e-02 | 64 |
| Page: 1 |
| Pathway ID | Tissue | Disease Stage | Description | Gene Ratio | Bg Ratio | pvalue | p.adjust | qvalue | Count |
| hsa0406620 | Endometrium | AEH | HIF-1 signaling pathway | 29/1197 | 109/8465 | 4.23e-04 | 3.11e-03 | 2.27e-03 | 29 |
| hsa04066110 | Endometrium | AEH | HIF-1 signaling pathway | 29/1197 | 109/8465 | 4.23e-04 | 3.11e-03 | 2.27e-03 | 29 |
| hsa0406624 | Endometrium | EEC | HIF-1 signaling pathway | 29/1237 | 109/8465 | 7.33e-04 | 5.13e-03 | 3.82e-03 | 29 |
| hsa0406634 | Endometrium | EEC | HIF-1 signaling pathway | 29/1237 | 109/8465 | 7.33e-04 | 5.13e-03 | 3.82e-03 | 29 |
| hsa0406629 | Esophagus | ESCC | HIF-1 signaling pathway | 75/4205 | 109/8465 | 3.66e-05 | 1.68e-04 | 8.60e-05 | 75 |
| hsa0415210 | Esophagus | ESCC | AMPK signaling pathway | 80/4205 | 121/8465 | 1.73e-04 | 6.67e-04 | 3.42e-04 | 80 |
| hsa000512 | Esophagus | ESCC | Fructose and mannose metabolism | 24/4205 | 34/8465 | 1.09e-02 | 2.51e-02 | 1.29e-02 | 24 |
| hsa04066113 | Esophagus | ESCC | HIF-1 signaling pathway | 75/4205 | 109/8465 | 3.66e-05 | 1.68e-04 | 8.60e-05 | 75 |
| hsa0415213 | Esophagus | ESCC | AMPK signaling pathway | 80/4205 | 121/8465 | 1.73e-04 | 6.67e-04 | 3.42e-04 | 80 |
| hsa0005111 | Esophagus | ESCC | Fructose and mannose metabolism | 24/4205 | 34/8465 | 1.09e-02 | 2.51e-02 | 1.29e-02 | 24 |
| hsa0406627 | Oral cavity | OSCC | HIF-1 signaling pathway | 68/3704 | 109/8465 | 6.30e-05 | 2.48e-04 | 1.26e-04 | 68 |
| hsa041529 | Oral cavity | OSCC | AMPK signaling pathway | 71/3704 | 121/8465 | 6.29e-04 | 1.86e-03 | 9.49e-04 | 71 |
| hsa04066112 | Oral cavity | OSCC | HIF-1 signaling pathway | 68/3704 | 109/8465 | 6.30e-05 | 2.48e-04 | 1.26e-04 | 68 |
| hsa0415212 | Oral cavity | OSCC | AMPK signaling pathway | 71/3704 | 121/8465 | 6.29e-04 | 1.86e-03 | 9.49e-04 | 71 |
| hsa0406628 | Oral cavity | LP | HIF-1 signaling pathway | 42/2418 | 109/8465 | 1.52e-02 | 4.75e-02 | 3.06e-02 | 42 |
| hsa0406636 | Oral cavity | LP | HIF-1 signaling pathway | 42/2418 | 109/8465 | 1.52e-02 | 4.75e-02 | 3.06e-02 | 42 |
| hsa0406643 | Oral cavity | EOLP | HIF-1 signaling pathway | 33/1218 | 109/8465 | 1.48e-05 | 8.08e-05 | 4.76e-05 | 33 |
| hsa0406653 | Oral cavity | EOLP | HIF-1 signaling pathway | 33/1218 | 109/8465 | 1.48e-05 | 8.08e-05 | 4.76e-05 | 33 |
| hsa0406661 | Oral cavity | NEOLP | HIF-1 signaling pathway | 27/1112 | 109/8465 | 6.86e-04 | 3.58e-03 | 2.25e-03 | 27 |
| hsa0406671 | Oral cavity | NEOLP | HIF-1 signaling pathway | 27/1112 | 109/8465 | 6.86e-04 | 3.58e-03 | 2.25e-03 | 27 |
| Page: 1 |
Top |
Cell-cell communication analysis |
| Identification of potential cell-cell interactions between two cell types and their ligand-receptor pairs for different disease states |
| Ligand | Receptor | LRpair | Pathway | Tissue | Disease Stage |
| Page: 1 |
Top |
Single-cell gene regulatory network inference analysis |
| Find out the significant the regulons (TFs) and the target genes of each regulon across cell types for different disease states |
| TF | Cell Type | Tissue | Disease Stage | Target Gene | RSS | Regulon Activity |
| ∗The dot plots of a searched regulon are shown for all cell subpopulations in each disease state of each tissue based on the regulon specific score inferred using pySCENIC and by calculating the average expression. |
| Page: 1 |
Top |
Somatic mutation of malignant transformation related genes |
| Annotation of somatic variants for genes involved in malignant transformation |
| Hugo Symbol | Variant Class | Variant Classification | dbSNP RS | HGVSc | HGVSp | HGVSp Short | SWISSPROT | BIOTYPE | SIFT | PolyPhen | Tumor Sample Barcode | Tissue | Histology | Sex | Age | Stage | Therapy Types | Drugs | Outcome |
| PFKFB3 | SNV | Missense_Mutation | c.1504N>A | p.Ala502Thr | p.A502T | Q16875 | protein_coding | benign(0.006) | TCGA-A8-A09Z-01 | Breast | breast invasive carcinoma | Female | >=65 | I/II | Unknown | Unknown | SD | ||
| PFKFB3 | insertion | In_Frame_Ins | novel | c.376_377insATTTTAGATTCGGGTACATGT | p.Ser126delinsAsnPheArgPheGlyTyrMetCys | p.S126delinsNFRFGYMC | Q16875 | protein_coding | TCGA-A7-A0CG-01 | Breast | breast invasive carcinoma | Female | >=65 | I/II | Unknown | Unknown | SD | ||
| PFKFB3 | insertion | Frame_Shift_Ins | novel | c.378_379insATGTTTGT | p.Tyr127MetfsTer27 | p.Y127Mfs*27 | Q16875 | protein_coding | TCGA-A7-A0CG-01 | Breast | breast invasive carcinoma | Female | >=65 | I/II | Unknown | Unknown | SD | ||
| PFKFB3 | insertion | Frame_Shift_Ins | novel | c.133_134insCTCAGGCGCCCCTCTCTTTGTTTTT | p.Leu45ProfsTer71 | p.L45Pfs*71 | Q16875 | protein_coding | TCGA-AR-A0TY-01 | Breast | breast invasive carcinoma | Female | <65 | I/II | Unspecific | Paclitaxel | PD | ||
| PFKFB3 | SNV | Missense_Mutation | c.363N>C | p.Leu121Phe | p.L121F | Q16875 | protein_coding | probably_damaging(1) | TCGA-VS-A958-01 | Cervix | cervical & endocervical cancer | Female | <65 | I/II | Chemotherapy | cisplatin | CR | ||
| PFKFB3 | SNV | Missense_Mutation | rs140784797 | c.701N>A | p.Arg234Gln | p.R234Q | Q16875 | protein_coding | benign(0.048) | TCGA-A6-6780-01 | Colorectum | colon adenocarcinoma | Male | >=65 | I/II | Unknown | Unknown | SD | |
| PFKFB3 | SNV | Missense_Mutation | rs750254792 | c.1507N>A | p.Ala503Thr | p.A503T | Q16875 | protein_coding | benign(0.009) | TCGA-A6-6780-01 | Colorectum | colon adenocarcinoma | Male | >=65 | I/II | Unknown | Unknown | SD | |
| PFKFB3 | SNV | Missense_Mutation | c.1213N>C | p.Val405Leu | p.V405L | Q16875 | protein_coding | probably_damaging(0.998) | TCGA-CI-6619-01 | Colorectum | rectum adenocarcinoma | Male | <65 | III/IV | Unknown | Unknown | SD | ||
| PFKFB3 | SNV | Missense_Mutation | novel | c.467A>C | p.Lys156Thr | p.K156T | Q16875 | protein_coding | benign(0.031) | TCGA-F5-6814-01 | Colorectum | rectum adenocarcinoma | Male | <65 | I/II | Unknown | Unknown | SD | |
| PFKFB3 | SNV | Missense_Mutation | rs753664642 | c.742N>T | p.Arg248Cys | p.R248C | Q16875 | protein_coding | probably_damaging(0.965) | TCGA-A5-A0G2-01 | Endometrium | uterine corpus endometrioid carcinoma | Female | <65 | III/IV | Unknown | Unknown | SD |
| Page: 1 2 3 4 5 |
Top |
Related drugs of malignant transformation related genes |
| Identification of chemicals and drugs interact with genes involved in malignant transfromation |
| (DGIdb 4.0) |
| Entrez ID | Symbol | Category | Interaction Types | Drug Claim Name | Drug Name | PMIDs |
| 5209 | PFKFB3 | ENZYME, KINASE | inhibitor | 381118835 | ||
| 5209 | PFKFB3 | ENZYME, KINASE | INGAP peptide | 15492571 | ||
| 5209 | PFKFB3 | ENZYME, KINASE | inhibitor | 336446948 | ||
| 5209 | PFKFB3 | ENZYME, KINASE | PFK-158 |
| Page: 1 |

Copyright 2023-Present -The University of Texas Health Science Center at Houston |