
|
|||||
|
 | |
| |
| |
| |
| |
| |
|
Gene: NIBAN1 |
Gene summary for NIBAN1 |
| Gene information | Species | Human | Gene symbol | NIBAN1 | Gene ID | 116496 |
| Gene name | niban apoptosis regulator 1 | |
| Gene Alias | C1orf24 | |
| Cytomap | 1q25.3 | |
| Gene Type | protein-coding | GO ID | GO:0001932 | UniProtAcc | A0A024R978 |
Top |
Malignant transformation analysis |
| Identification of the aberrant gene expression in precancerous and cancerous lesions by comparing the gene expression of stem-like cells in diseased tissues with normal stem cells |
| Entrez ID | Symbol | Replicates | Species | Organ | Tissue | Adj P-value | Log2FC | Malignancy |
| 116496 | NIBAN1 | LZE5T | Human | Esophagus | ESCC | 1.57e-03 | 4.15e-01 | 0.0514 |
| 116496 | NIBAN1 | LZE7T | Human | Esophagus | ESCC | 1.02e-03 | 2.31e-01 | 0.0667 |
| 116496 | NIBAN1 | LZE8T | Human | Esophagus | ESCC | 4.44e-20 | 5.93e-01 | 0.067 |
| 116496 | NIBAN1 | LZE20T | Human | Esophagus | ESCC | 3.16e-03 | 1.42e-01 | 0.0662 |
| 116496 | NIBAN1 | LZE21D1 | Human | Esophagus | HGIN | 3.53e-05 | 3.63e-01 | 0.0632 |
| 116496 | NIBAN1 | LZE22D1 | Human | Esophagus | HGIN | 4.30e-07 | 3.43e-01 | 0.0595 |
| 116496 | NIBAN1 | LZE22T | Human | Esophagus | ESCC | 1.48e-05 | 3.89e-01 | 0.068 |
| 116496 | NIBAN1 | LZE24T | Human | Esophagus | ESCC | 1.93e-22 | 5.23e-01 | 0.0596 |
| 116496 | NIBAN1 | LZE21T | Human | Esophagus | ESCC | 9.73e-05 | 3.00e-01 | 0.0655 |
| 116496 | NIBAN1 | LZE6T | Human | Esophagus | ESCC | 7.09e-15 | 4.78e-01 | 0.0845 |
| 116496 | NIBAN1 | RNA-P10T2-P10T2-3 | Human | Lung | AAH | 5.95e-04 | 6.62e-01 | -0.1408 |
| 116496 | NIBAN1 | RNA-P25T1-P25T1-1 | Human | Lung | AIS | 1.19e-15 | 6.88e-01 | -0.2116 |
| 116496 | NIBAN1 | RNA-P25T1-P25T1-3 | Human | Lung | AIS | 7.22e-04 | 4.57e-01 | -0.2107 |
| 116496 | NIBAN1 | RNA-P25T1-P25T1-4 | Human | Lung | AIS | 1.70e-10 | 5.69e-01 | -0.2119 |
| 116496 | NIBAN1 | RNA-P6T2-P6T2-1 | Human | Lung | IAC | 4.97e-02 | 1.91e-01 | -0.0166 |
| 116496 | NIBAN1 | RNA-P6T2-P6T2-4 | Human | Lung | IAC | 6.25e-03 | 2.20e-01 | -0.0121 |
| 116496 | NIBAN1 | GSM5252137_BPH556PrGA2_Fcol | Human | Prostate | BPH | 4.25e-03 | 3.13e-01 | -0.23 |
| 116496 | NIBAN1 | 047563_1562-all-cells | Human | Prostate | BPH | 1.63e-07 | 4.15e-01 | 0.0791 |
| 116496 | NIBAN1 | 048752_1579-all-cells | Human | Prostate | BPH | 2.07e-44 | 9.62e-01 | 0.1008 |
| 116496 | NIBAN1 | 052097_1595-all-cells | Human | Prostate | BPH | 3.66e-20 | 6.78e-01 | 0.0972 |
| Page: 1 2 |
| Tissue | Expression Dynamics | Abbreviation |
| Esophagus | 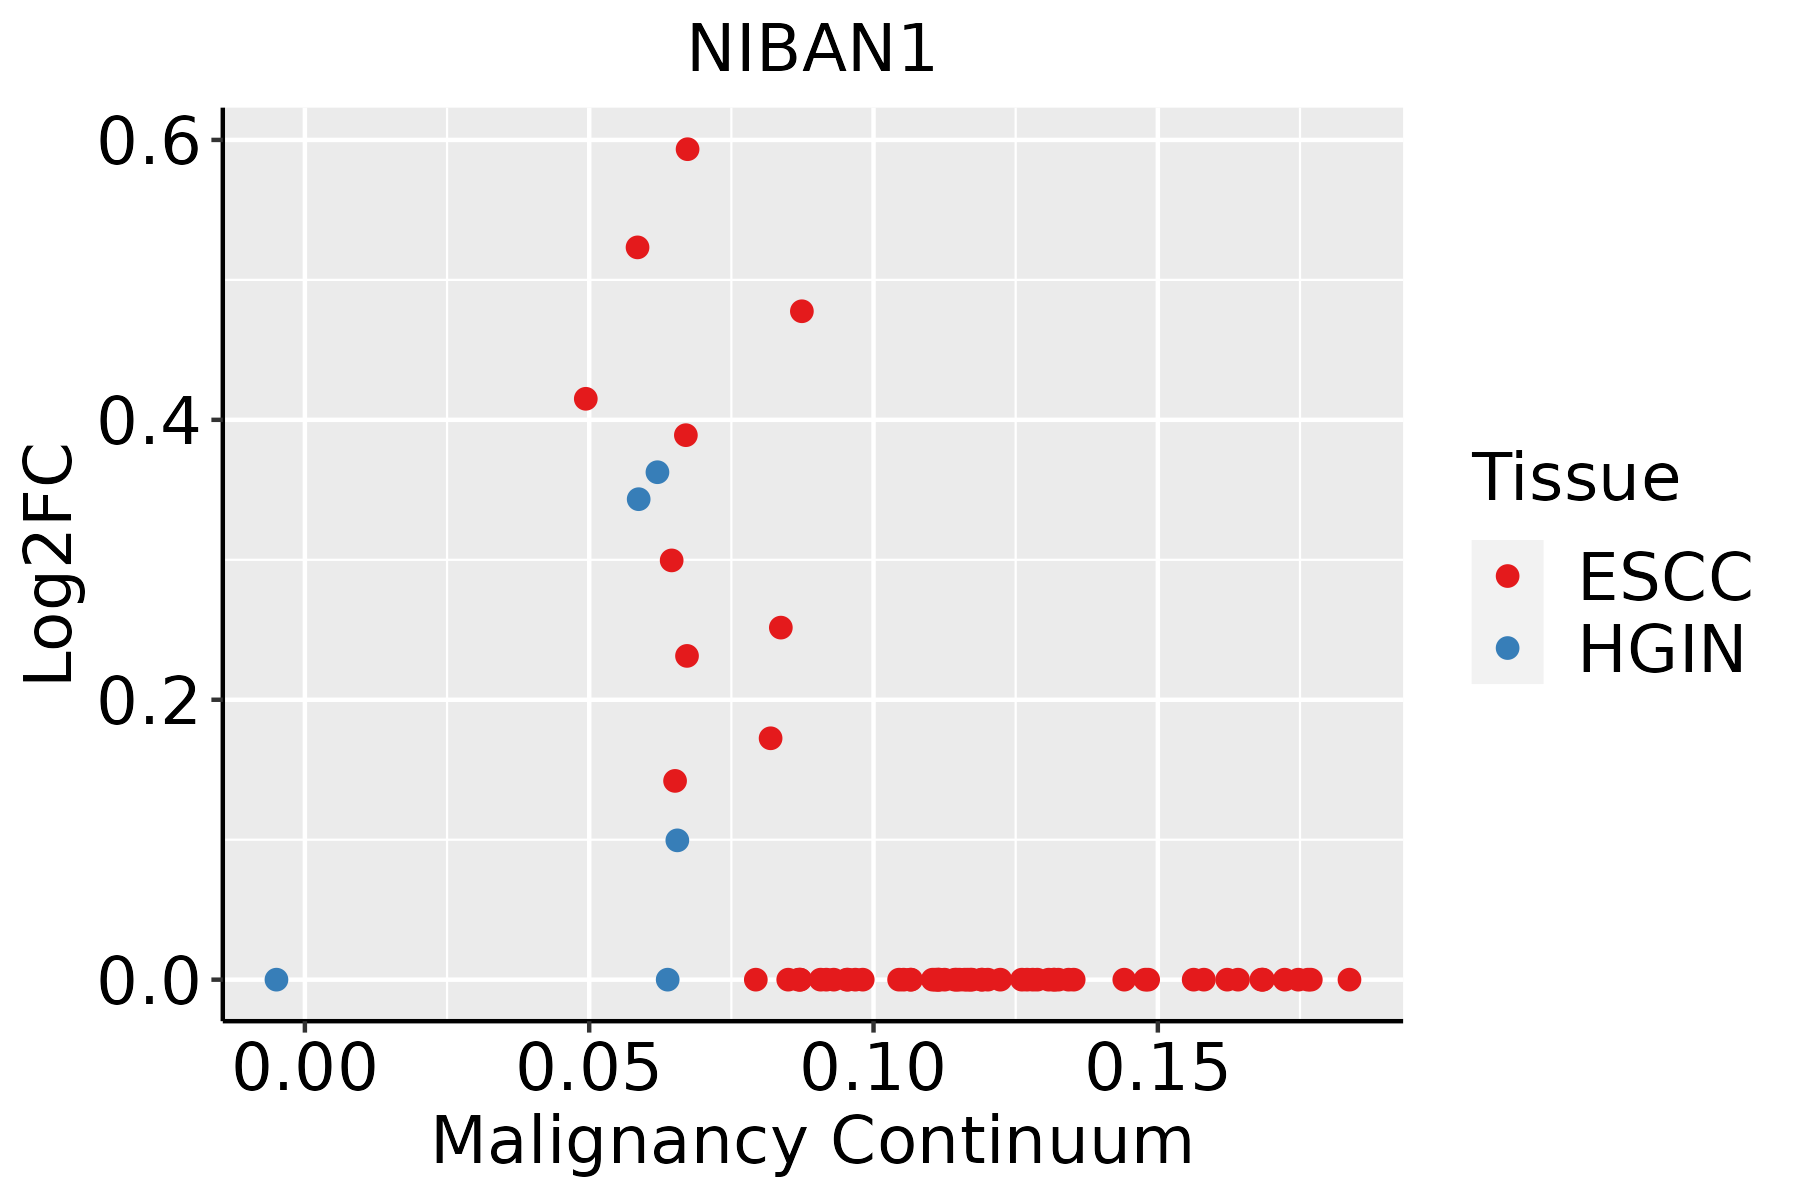 | ESCC: Esophageal squamous cell carcinoma |
| HGIN: High-grade intraepithelial neoplasias | ||
| LGIN: Low-grade intraepithelial neoplasias | ||
| Lung |  | AAH: Atypical adenomatous hyperplasia |
| AIS: Adenocarcinoma in situ | ||
| IAC: Invasive lung adenocarcinoma | ||
| MIA: Minimally invasive adenocarcinoma | ||
| Prostate | 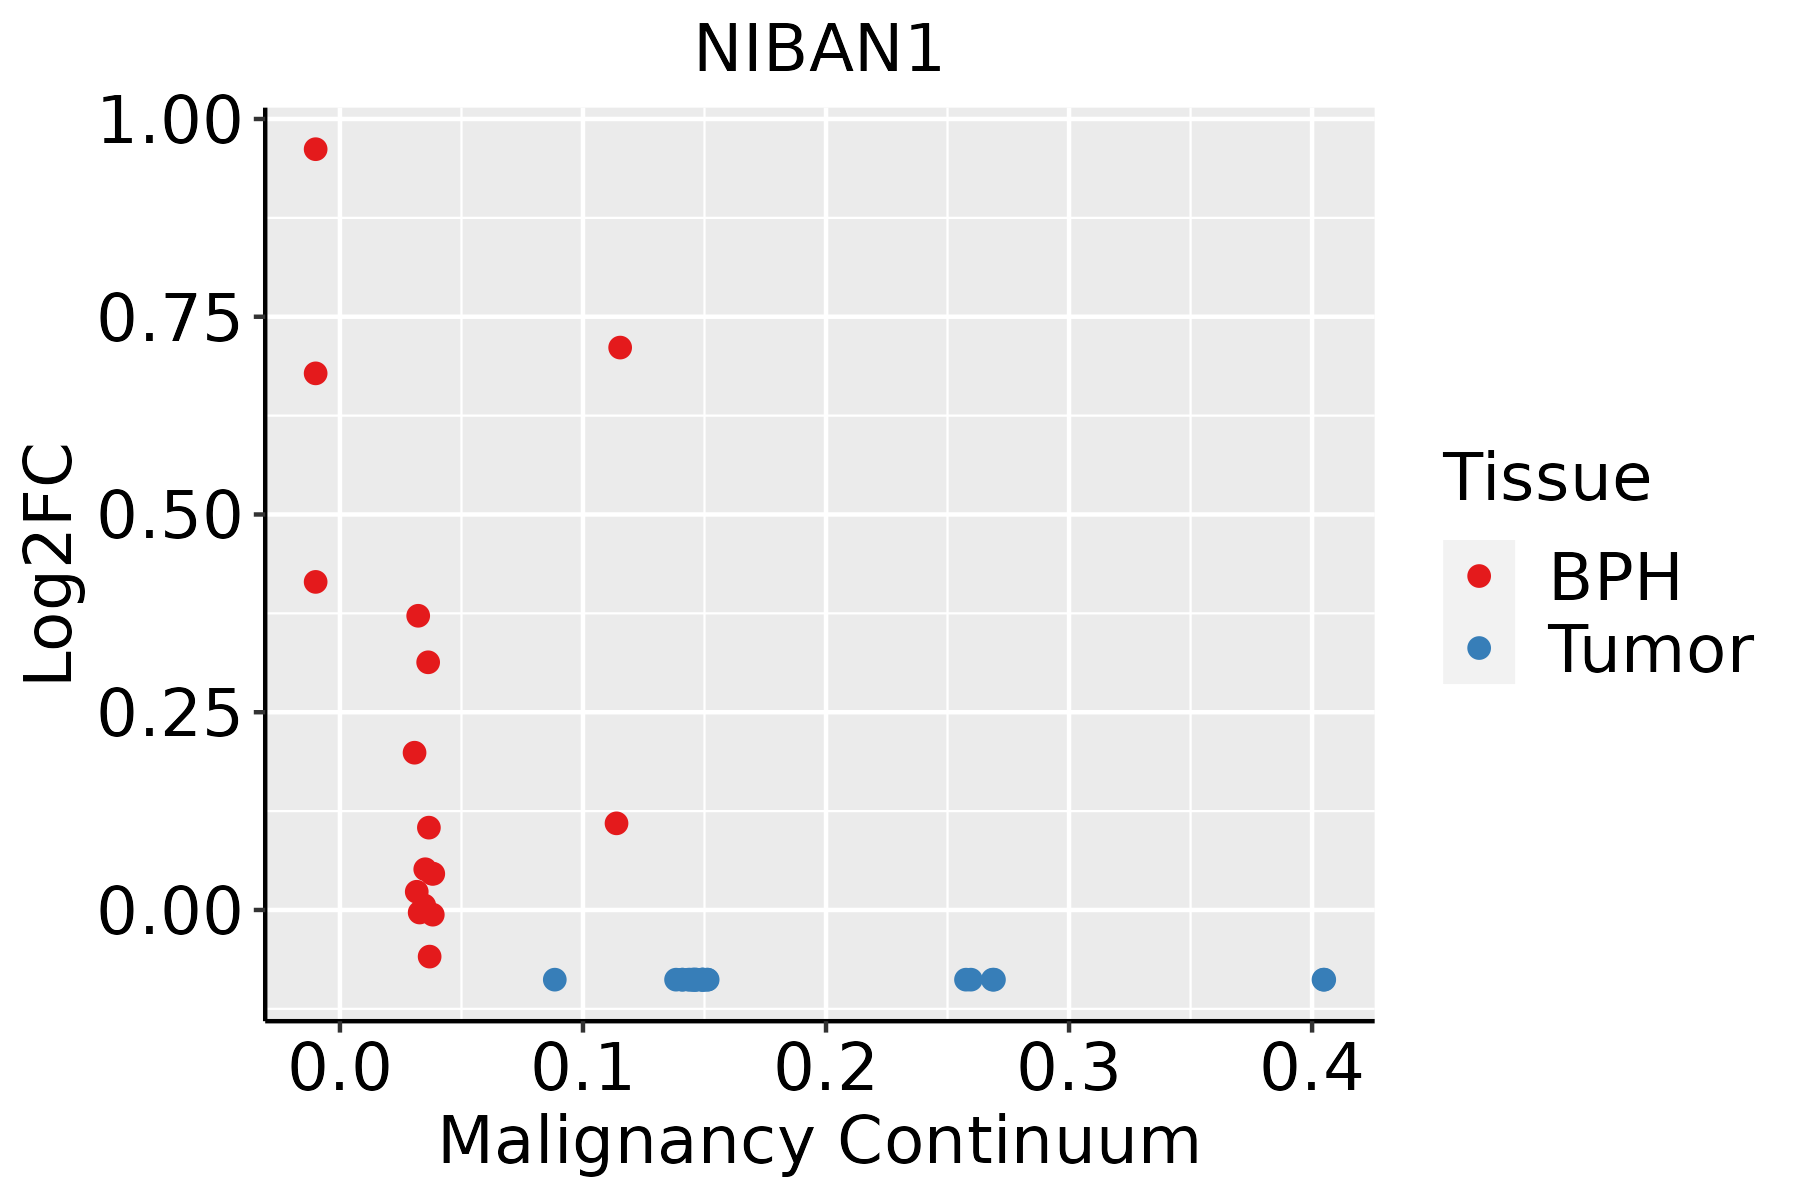 | BPH: Benign Prostatic Hyperplasia |
| Skin | 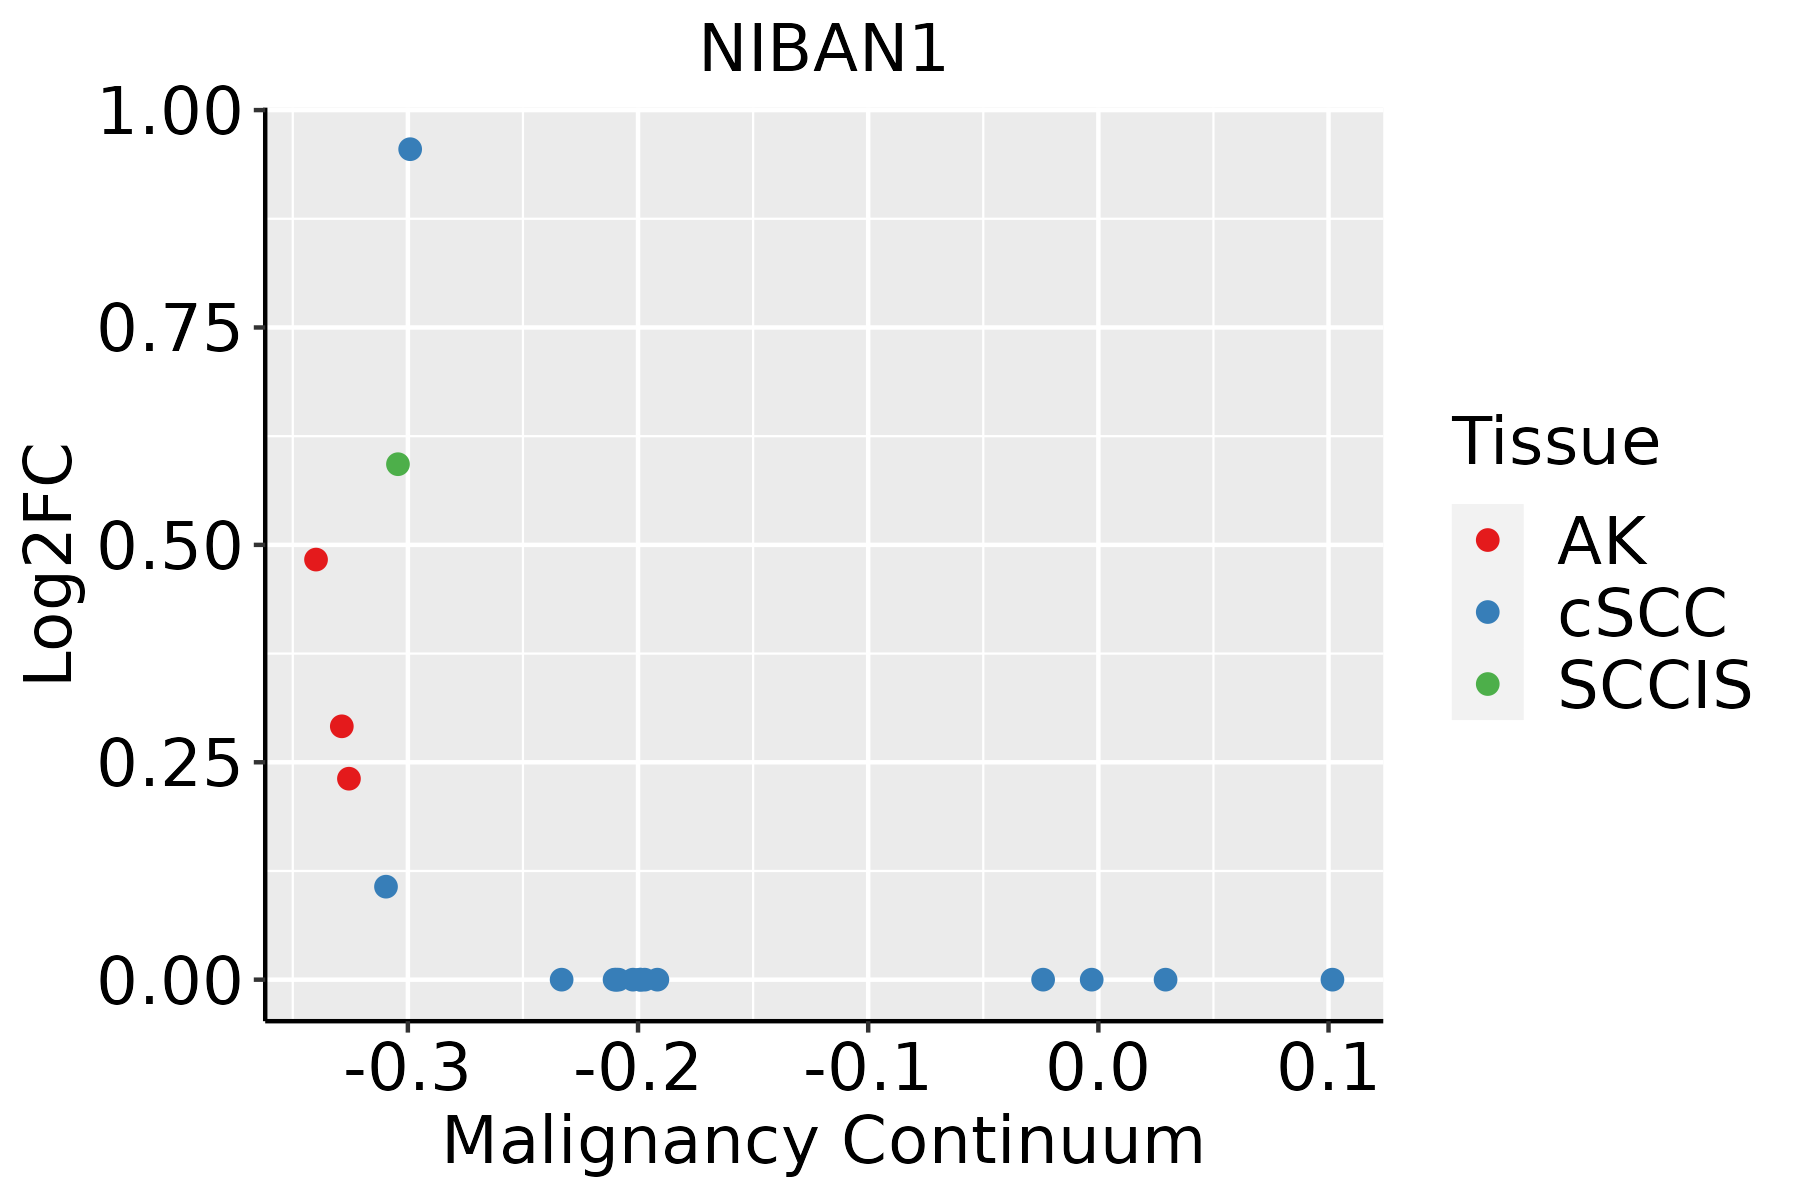 | AK: Actinic keratosis |
| cSCC: Cutaneous squamous cell carcinoma | ||
| SCCIS:squamous cell carcinoma in situ |
| ∗log2FC in expression of this searched gene in stem-like cells from each diseased tissue sample relative to stem-like cells in normal samples in each tissue plotted against the malignancy continuum. Samples are colored based on if they are from different disease stage. |
Top |
Malignant transformation related pathway analysis |
| Find out the enriched GO biological processes and KEGG pathways involved in transition from healthy to precancer to cancer |
| Tissue | Disease Stage | Enriched GO biological Processes |
| Stomach | WIM |  |
| Stomach | SIM |  |
| Liver | NAFLD |  |
| Liver | Cirrhotic |  |
| Liver | HCC |  |
| ∗Top 15 enriched GO BP terms are showed in the bar plot of each disease state in each tissue. Each row represents a significant GO biological process which is colored according to the -log10(p.adjust). |
| Page: 1 2 3 4 5 6 7 8 9 |
| GO ID | Tissue | Disease Stage | Description | Gene Ratio | Bg Ratio | pvalue | p.adjust | Count |
| GO:000641727 | Esophagus | HGIN | regulation of translation | 139/2587 | 468/18723 | 1.46e-19 | 7.98e-17 | 139 |
| GO:003497625 | Esophagus | HGIN | response to endoplasmic reticulum stress | 81/2587 | 256/18723 | 1.47e-13 | 2.32e-11 | 81 |
| GO:004572720 | Esophagus | HGIN | positive regulation of translation | 49/2587 | 136/18723 | 5.88e-11 | 6.30e-09 | 49 |
| GO:003425020 | Esophagus | HGIN | positive regulation of cellular amide metabolic process | 53/2587 | 162/18723 | 6.01e-10 | 5.15e-08 | 53 |
| GO:004593626 | Esophagus | HGIN | negative regulation of phosphate metabolic process | 89/2587 | 441/18723 | 1.24e-04 | 2.54e-03 | 89 |
| GO:001056326 | Esophagus | HGIN | negative regulation of phosphorus metabolic process | 89/2587 | 442/18723 | 1.34e-04 | 2.71e-03 | 89 |
| GO:004232620 | Esophagus | HGIN | negative regulation of phosphorylation | 78/2587 | 385/18723 | 2.77e-04 | 4.77e-03 | 78 |
| GO:000193320 | Esophagus | HGIN | negative regulation of protein phosphorylation | 69/2587 | 342/18723 | 6.81e-04 | 9.26e-03 | 69 |
| GO:0034976111 | Esophagus | ESCC | response to endoplasmic reticulum stress | 192/8552 | 256/18723 | 7.15e-22 | 1.30e-19 | 192 |
| GO:0006417111 | Esophagus | ESCC | regulation of translation | 304/8552 | 468/18723 | 1.53e-17 | 1.33e-15 | 304 |
| GO:0045727111 | Esophagus | ESCC | positive regulation of translation | 107/8552 | 136/18723 | 2.79e-15 | 1.68e-13 | 107 |
| GO:0034250111 | Esophagus | ESCC | positive regulation of cellular amide metabolic process | 123/8552 | 162/18723 | 3.32e-15 | 1.93e-13 | 123 |
| GO:0010563111 | Esophagus | ESCC | negative regulation of phosphorus metabolic process | 274/8552 | 442/18723 | 2.32e-12 | 9.41e-11 | 274 |
| GO:0045936111 | Esophagus | ESCC | negative regulation of phosphate metabolic process | 273/8552 | 441/18723 | 3.18e-12 | 1.25e-10 | 273 |
| GO:0042326111 | Esophagus | ESCC | negative regulation of phosphorylation | 237/8552 | 385/18723 | 1.86e-10 | 5.33e-09 | 237 |
| GO:0001933111 | Esophagus | ESCC | negative regulation of protein phosphorylation | 213/8552 | 342/18723 | 3.54e-10 | 9.76e-09 | 213 |
| GO:00459368 | Lung | IAC | negative regulation of phosphate metabolic process | 87/2061 | 441/18723 | 4.00e-08 | 4.57e-06 | 87 |
| GO:00105638 | Lung | IAC | negative regulation of phosphorus metabolic process | 87/2061 | 442/18723 | 4.46e-08 | 4.99e-06 | 87 |
| GO:00423268 | Lung | IAC | negative regulation of phosphorylation | 74/2061 | 385/18723 | 1.15e-06 | 6.18e-05 | 74 |
| GO:00064178 | Lung | IAC | regulation of translation | 86/2061 | 468/18723 | 1.16e-06 | 6.18e-05 | 86 |
| Page: 1 2 3 4 |
| Pathway ID | Tissue | Disease Stage | Description | Gene Ratio | Bg Ratio | pvalue | p.adjust | qvalue | Count |
| Page: 1 |
Top |
Cell-cell communication analysis |
| Identification of potential cell-cell interactions between two cell types and their ligand-receptor pairs for different disease states |
| Ligand | Receptor | LRpair | Pathway | Tissue | Disease Stage |
| Page: 1 |
Top |
Single-cell gene regulatory network inference analysis |
| Find out the significant the regulons (TFs) and the target genes of each regulon across cell types for different disease states |
| TF | Cell Type | Tissue | Disease Stage | Target Gene | RSS | Regulon Activity |
| ∗The dot plots of a searched regulon are shown for all cell subpopulations in each disease state of each tissue based on the regulon specific score inferred using pySCENIC and by calculating the average expression. |
| Page: 1 |
Top |
Somatic mutation of malignant transformation related genes |
| Annotation of somatic variants for genes involved in malignant transformation |
| Hugo Symbol | Variant Class | Variant Classification | dbSNP RS | HGVSc | HGVSp | HGVSp Short | SWISSPROT | BIOTYPE | SIFT | PolyPhen | Tumor Sample Barcode | Tissue | Histology | Sex | Age | Stage | Therapy Types | Drugs | Outcome |
| Page: 1 |
Top |
Related drugs of malignant transformation related genes |
| Identification of chemicals and drugs interact with genes involved in malignant transfromation |
| (DGIdb 4.0) |
| Entrez ID | Symbol | Category | Interaction Types | Drug Claim Name | Drug Name | PMIDs |
| Page: 1 |

Copyright 2023-Present -The University of Texas Health Science Center at Houston |