
|
|||||
|
 | |
| |
| |
| |
| |
| |
|
Gene: NEU1 |
Gene summary for NEU1 |
| Gene information | Species | Human | Gene symbol | NEU1 | Gene ID | 4758 |
| Gene name | neuraminidase 1 | |
| Gene Alias | NANH | |
| Cytomap | 6p21.33 | |
| Gene Type | protein-coding | GO ID | GO:0001573 | UniProtAcc | Q5JQI0 |
Top |
Malignant transformation analysis |
| Identification of the aberrant gene expression in precancerous and cancerous lesions by comparing the gene expression of stem-like cells in diseased tissues with normal stem cells |
| Entrez ID | Symbol | Replicates | Species | Organ | Tissue | Adj P-value | Log2FC | Malignancy |
| 4758 | NEU1 | HTA11_2487_2000001011 | Human | Colorectum | SER | 5.22e-04 | 2.36e-01 | -0.1808 |
| 4758 | NEU1 | HTA11_78_2000001011 | Human | Colorectum | AD | 3.00e-02 | 2.19e-01 | -0.1088 |
| 4758 | NEU1 | HTA11_347_2000001011 | Human | Colorectum | AD | 1.71e-08 | 2.86e-01 | -0.1954 |
| 4758 | NEU1 | HTA11_411_2000001011 | Human | Colorectum | SER | 2.74e-02 | 5.70e-01 | -0.2602 |
| 4758 | NEU1 | HTA11_696_2000001011 | Human | Colorectum | AD | 1.22e-08 | 2.57e-01 | -0.1464 |
| 4758 | NEU1 | HTA11_866_2000001011 | Human | Colorectum | AD | 1.87e-05 | 2.10e-01 | -0.1001 |
| 4758 | NEU1 | HTA11_1391_2000001011 | Human | Colorectum | AD | 8.45e-07 | 3.02e-01 | -0.059 |
| 4758 | NEU1 | HTA11_5212_2000001011 | Human | Colorectum | AD | 8.63e-03 | 3.52e-01 | -0.2061 |
| 4758 | NEU1 | HTA11_546_2000001011 | Human | Colorectum | AD | 1.19e-03 | 2.74e-01 | -0.0842 |
| 4758 | NEU1 | HTA11_866_3004761011 | Human | Colorectum | AD | 2.03e-21 | 6.06e-01 | 0.096 |
| 4758 | NEU1 | HTA11_10711_2000001011 | Human | Colorectum | AD | 1.49e-05 | 2.81e-01 | 0.0338 |
| 4758 | NEU1 | HTA11_7696_3000711011 | Human | Colorectum | AD | 7.16e-09 | 3.15e-01 | 0.0674 |
| 4758 | NEU1 | HTA11_6818_2000001011 | Human | Colorectum | AD | 2.90e-03 | 3.47e-01 | 0.0112 |
| 4758 | NEU1 | HTA11_6818_2000001021 | Human | Colorectum | AD | 3.12e-05 | 2.58e-01 | 0.0588 |
| 4758 | NEU1 | HTA11_99999970781_79442 | Human | Colorectum | MSS | 2.47e-11 | 3.16e-01 | 0.294 |
| 4758 | NEU1 | HTA11_99999965104_69814 | Human | Colorectum | MSS | 1.05e-11 | 4.72e-01 | 0.281 |
| 4758 | NEU1 | HTA11_99999971662_82457 | Human | Colorectum | MSS | 5.44e-25 | 7.46e-01 | 0.3859 |
| 4758 | NEU1 | HTA11_99999973899_84307 | Human | Colorectum | MSS | 1.37e-11 | 5.66e-01 | 0.2585 |
| 4758 | NEU1 | HTA11_99999974143_84620 | Human | Colorectum | MSS | 2.63e-23 | 5.58e-01 | 0.3005 |
| 4758 | NEU1 | LZE4T | Human | Esophagus | ESCC | 4.04e-12 | 7.24e-01 | 0.0811 |
| Page: 1 2 3 4 5 6 7 |
| Tissue | Expression Dynamics | Abbreviation |
| Colorectum (GSE201348) |  | FAP: Familial adenomatous polyposis |
| CRC: Colorectal cancer | ||
| Colorectum (HTA11) |  | AD: Adenomas |
| SER: Sessile serrated lesions | ||
| MSI-H: Microsatellite-high colorectal cancer | ||
| MSS: Microsatellite stable colorectal cancer | ||
| Esophagus | 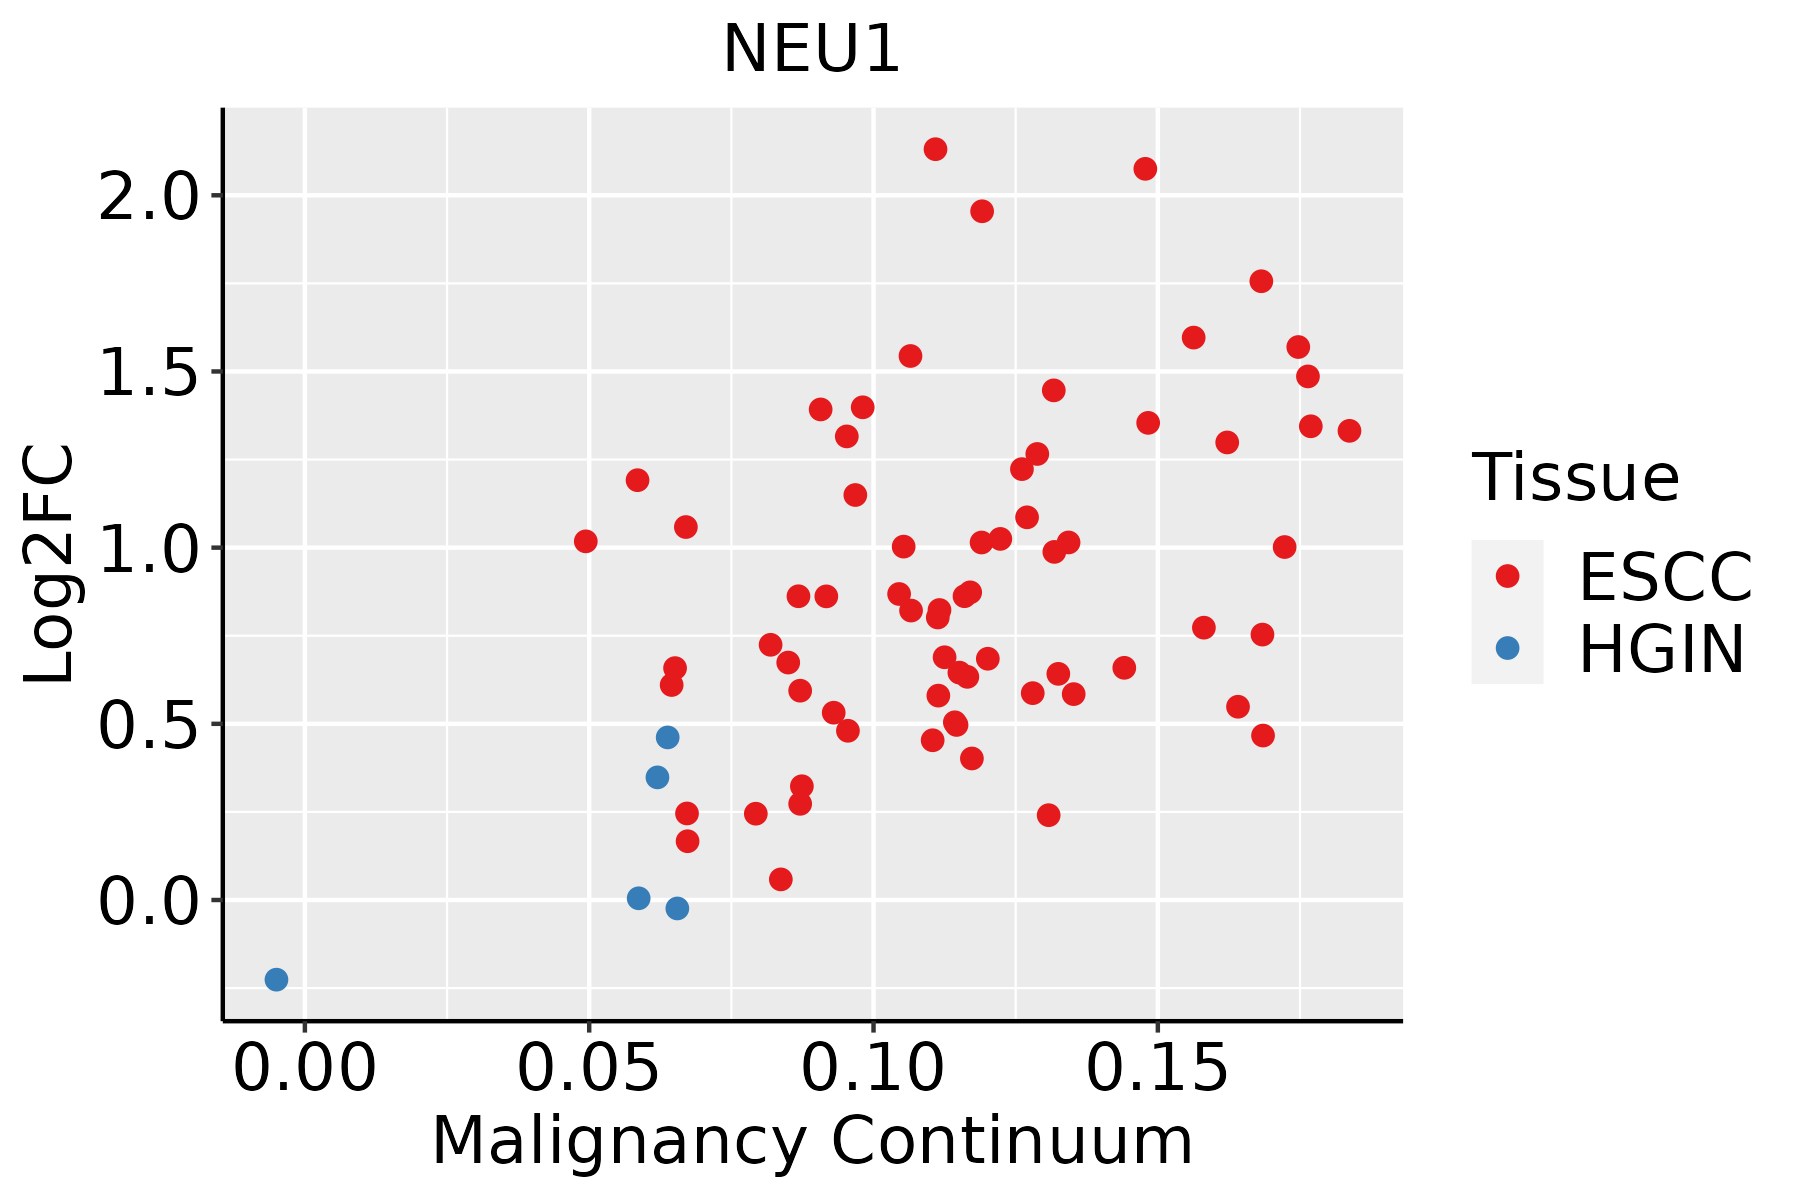 | ESCC: Esophageal squamous cell carcinoma |
| HGIN: High-grade intraepithelial neoplasias | ||
| LGIN: Low-grade intraepithelial neoplasias | ||
| Liver | 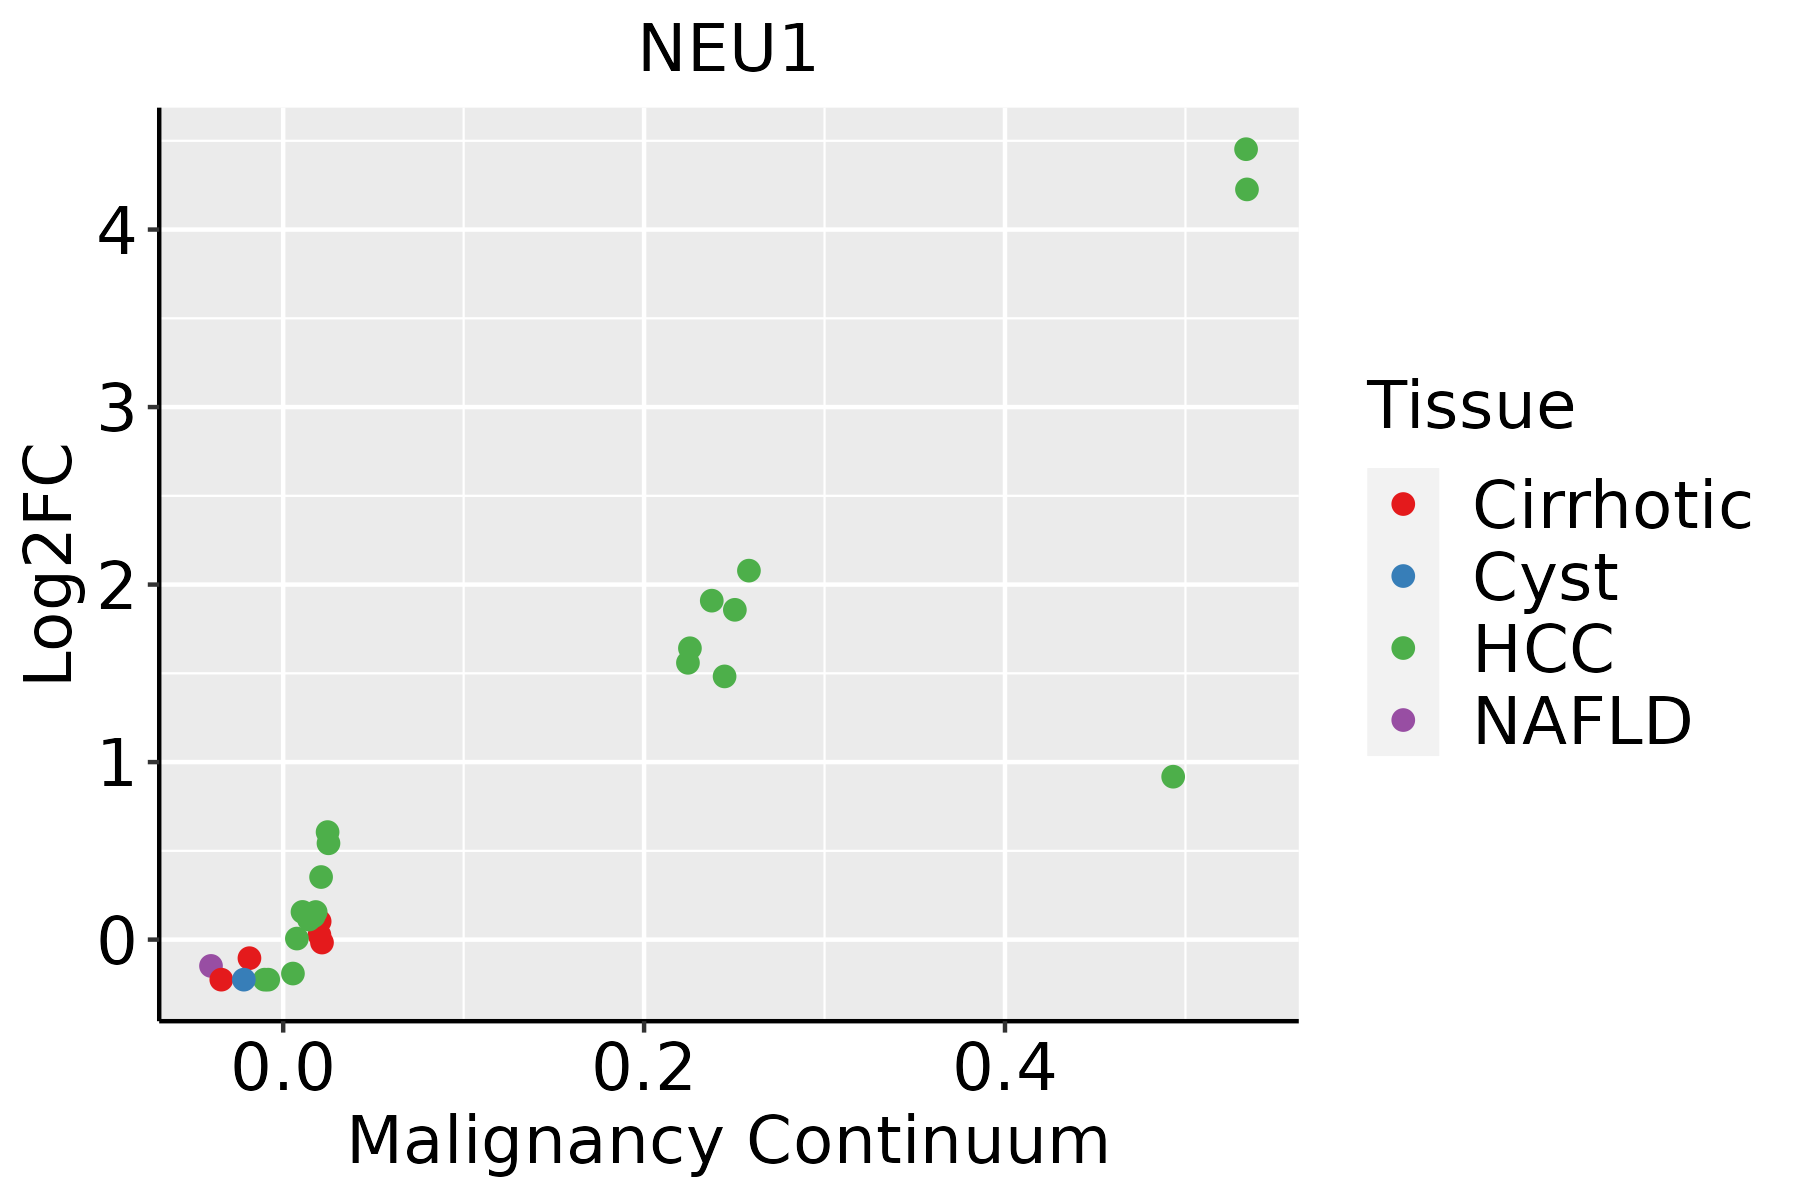 | HCC: Hepatocellular carcinoma |
| NAFLD: Non-alcoholic fatty liver disease | ||
| Oral Cavity | 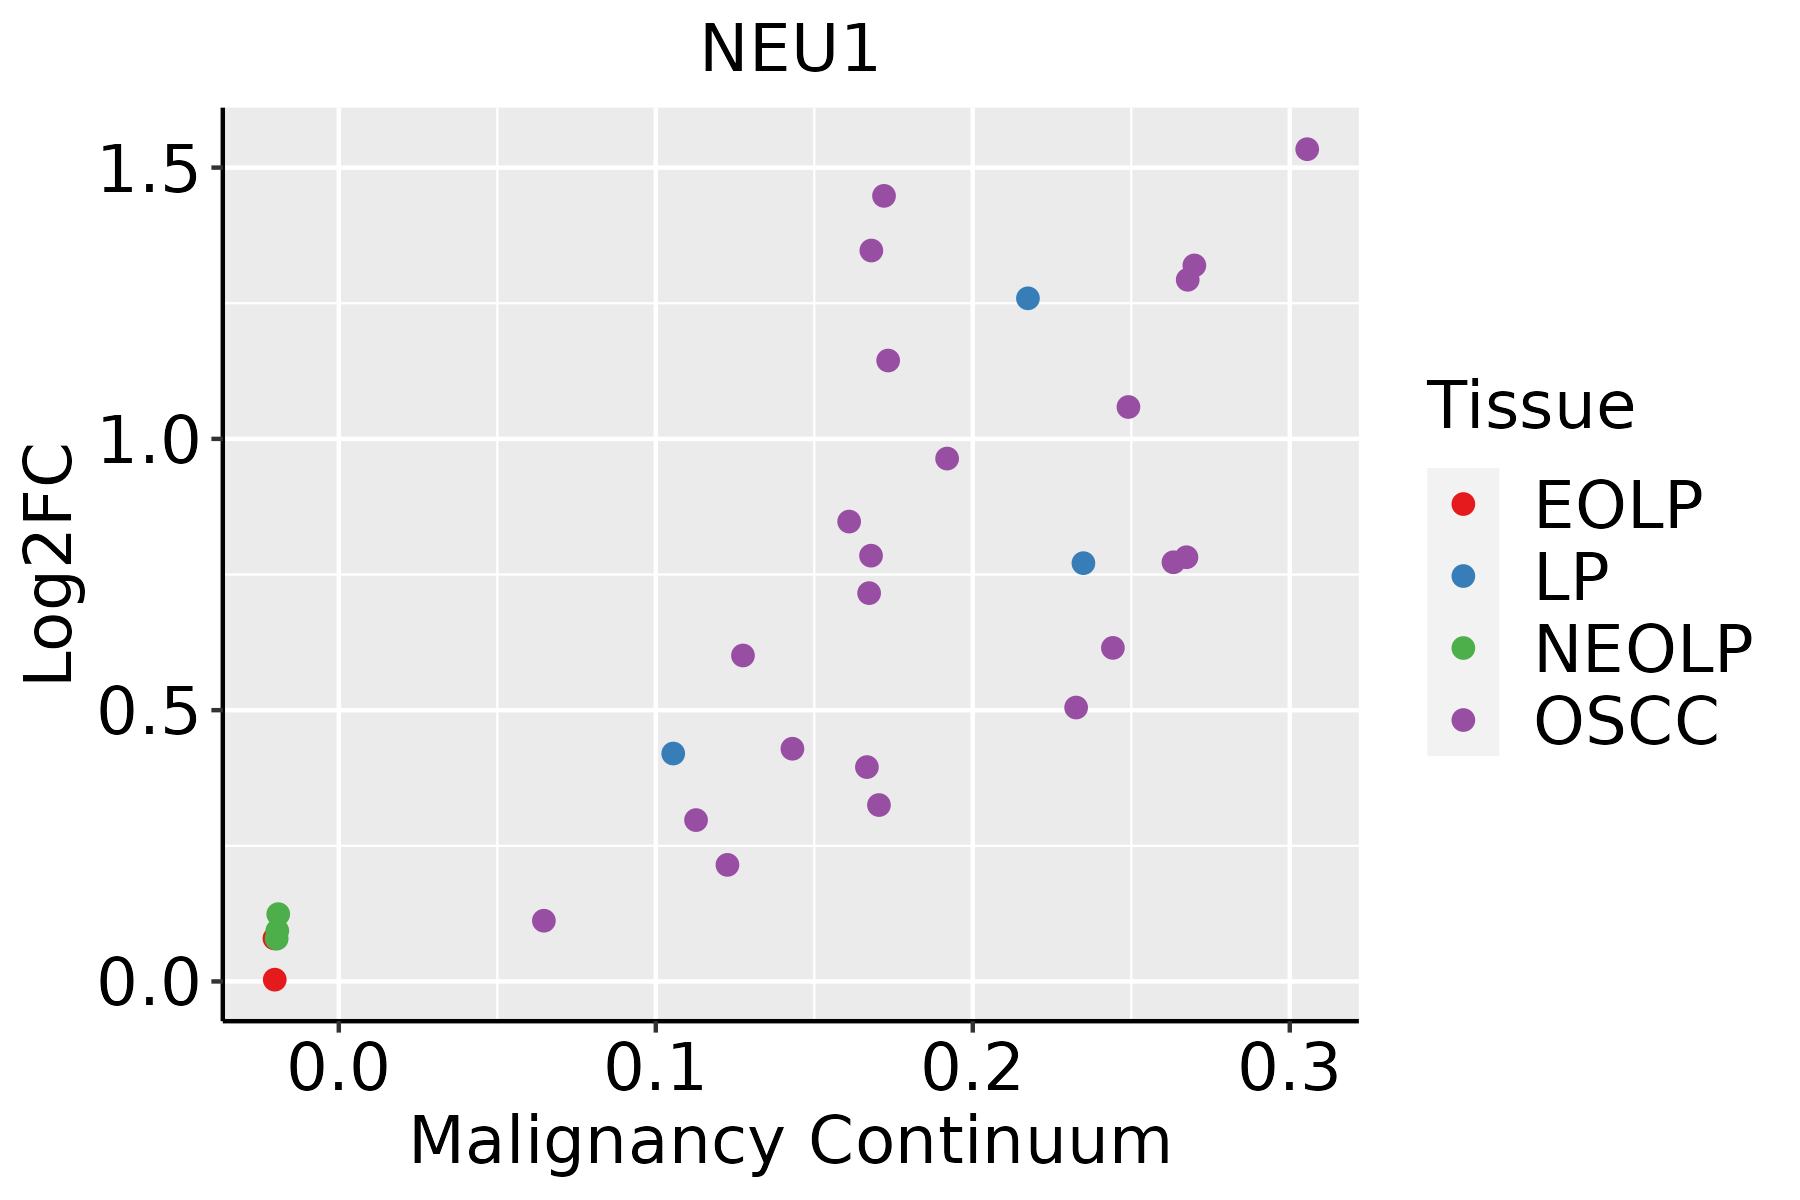 | EOLP: Erosive Oral lichen planus |
| LP: leukoplakia | ||
| NEOLP: Non-erosive oral lichen planus | ||
| OSCC: Oral squamous cell carcinoma | ||
| Thyroid | 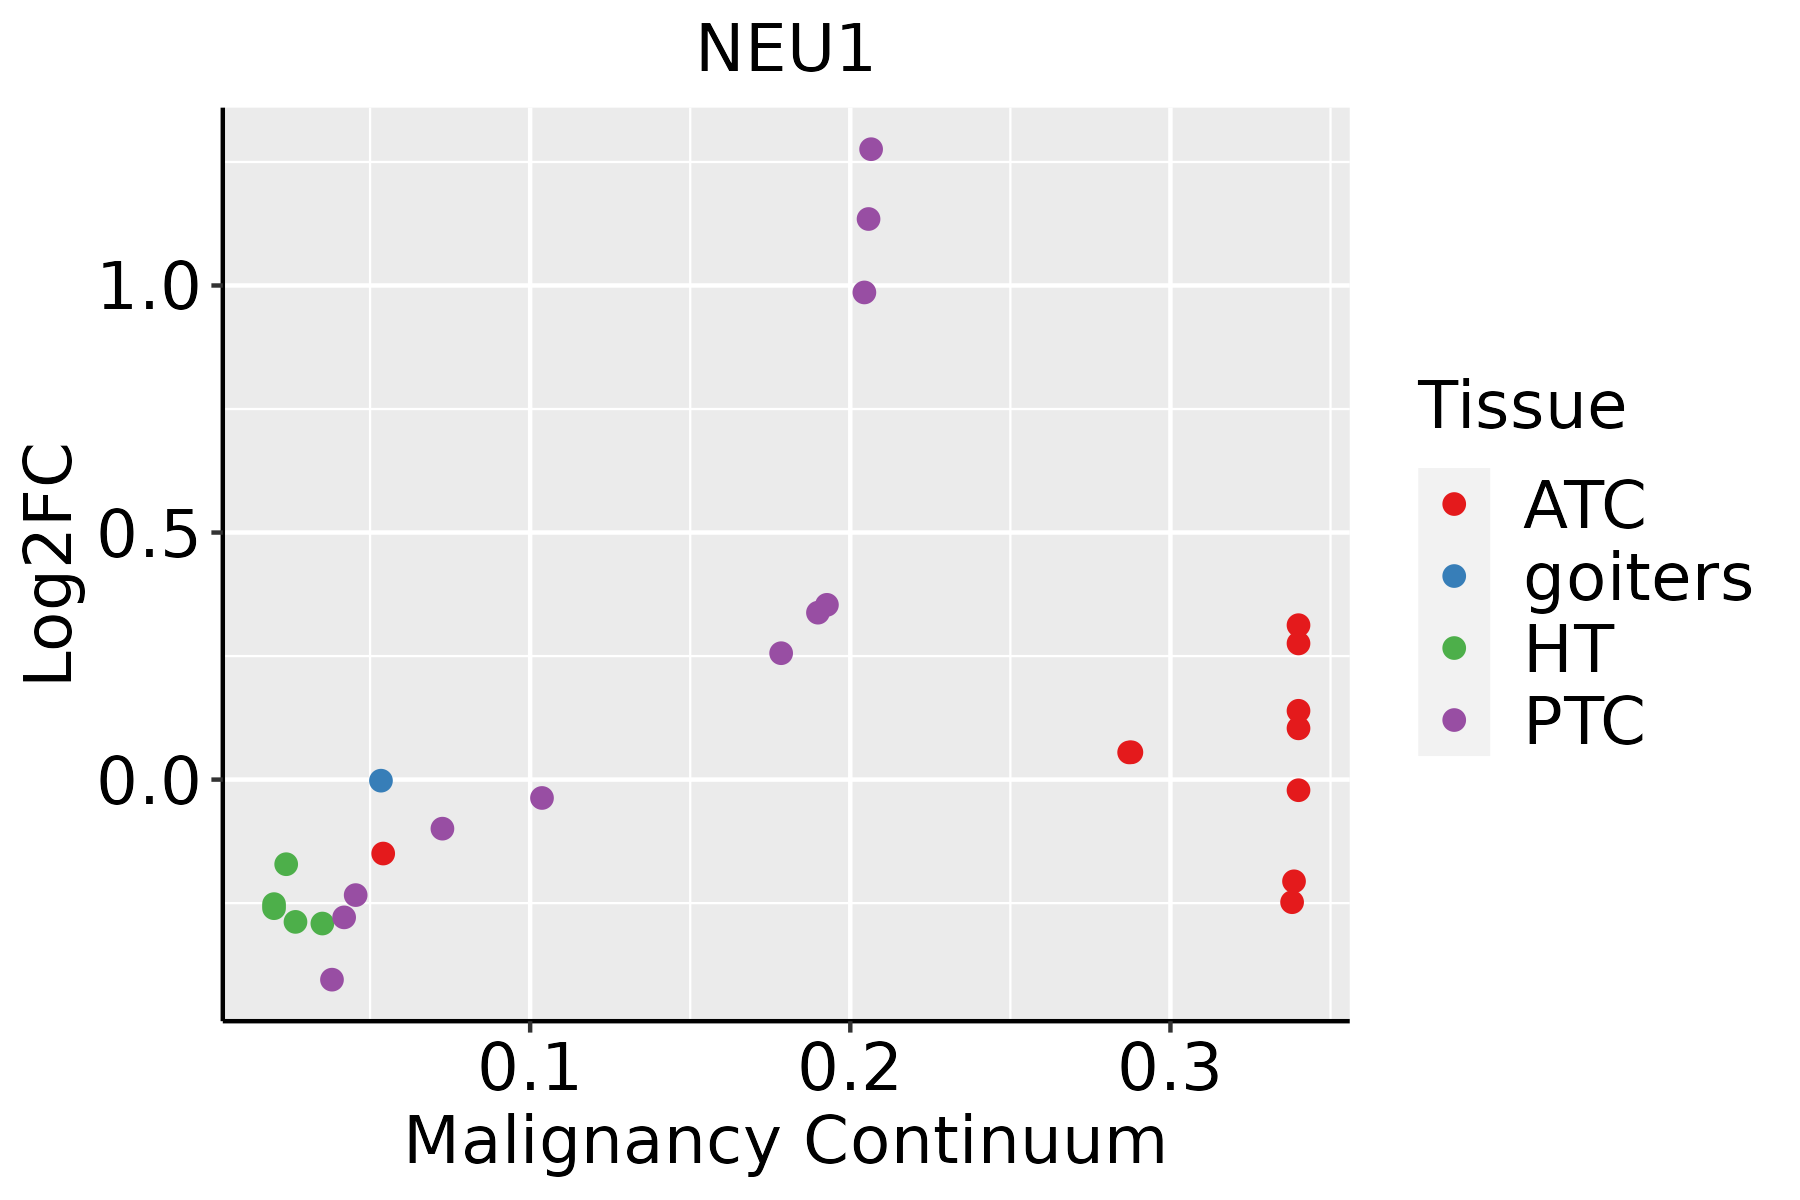 | ATC: Anaplastic thyroid cancer |
| HT: Hashimoto's thyroiditis | ||
| PTC: Papillary thyroid cancer |
| ∗log2FC in expression of this searched gene in stem-like cells from each diseased tissue sample relative to stem-like cells in normal samples in each tissue plotted against the malignancy continuum. Samples are colored based on if they are from different disease stage. |
Top |
Malignant transformation related pathway analysis |
| Find out the enriched GO biological processes and KEGG pathways involved in transition from healthy to precancer to cancer |
| Tissue | Disease Stage | Enriched GO biological Processes |
| Stomach | WIM |  |
| Stomach | SIM |  |
| Liver | NAFLD |  |
| Liver | Cirrhotic |  |
| Liver | HCC |  |
| ∗Top 15 enriched GO BP terms are showed in the bar plot of each disease state in each tissue. Each row represents a significant GO biological process which is colored according to the -log10(p.adjust). |
| Page: 1 2 3 4 5 6 7 8 9 |
| GO ID | Tissue | Disease Stage | Description | Gene Ratio | Bg Ratio | pvalue | p.adjust | Count |
| GO:0016052 | Colorectum | AD | carbohydrate catabolic process | 56/3918 | 154/18723 | 7.01e-06 | 1.73e-04 | 56 |
| GO:0016042 | Colorectum | AD | lipid catabolic process | 97/3918 | 320/18723 | 4.31e-05 | 7.56e-04 | 97 |
| GO:0044242 | Colorectum | AD | cellular lipid catabolic process | 66/3918 | 214/18723 | 3.96e-04 | 4.50e-03 | 66 |
| GO:00160421 | Colorectum | SER | lipid catabolic process | 77/2897 | 320/18723 | 3.52e-05 | 9.18e-04 | 77 |
| GO:00442421 | Colorectum | SER | cellular lipid catabolic process | 51/2897 | 214/18723 | 8.60e-04 | 1.05e-02 | 51 |
| GO:00160521 | Colorectum | SER | carbohydrate catabolic process | 38/2897 | 154/18723 | 1.92e-03 | 1.93e-02 | 38 |
| GO:00160522 | Colorectum | MSS | carbohydrate catabolic process | 45/3467 | 154/18723 | 7.93e-04 | 8.36e-03 | 45 |
| GO:00160422 | Colorectum | MSS | lipid catabolic process | 77/3467 | 320/18723 | 7.43e-03 | 4.71e-02 | 77 |
| GO:00066433 | Esophagus | ESCC | membrane lipid metabolic process | 130/8552 | 203/18723 | 9.29e-08 | 1.54e-06 | 130 |
| GO:00066652 | Esophagus | ESCC | sphingolipid metabolic process | 96/8552 | 155/18723 | 3.21e-05 | 2.66e-04 | 96 |
| GO:00066642 | Esophagus | ESCC | glycolipid metabolic process | 63/8552 | 100/18723 | 3.55e-04 | 2.06e-03 | 63 |
| GO:19035092 | Esophagus | ESCC | liposaccharide metabolic process | 63/8552 | 101/18723 | 5.25e-04 | 2.90e-03 | 63 |
| GO:001605216 | Esophagus | ESCC | carbohydrate catabolic process | 91/8552 | 154/18723 | 5.39e-04 | 2.97e-03 | 91 |
| GO:00442427 | Esophagus | ESCC | cellular lipid catabolic process | 121/8552 | 214/18723 | 8.63e-04 | 4.43e-03 | 121 |
| GO:19011362 | Esophagus | ESCC | carbohydrate derivative catabolic process | 99/8552 | 172/18723 | 1.11e-03 | 5.54e-03 | 99 |
| GO:00066721 | Esophagus | ESCC | ceramide metabolic process | 61/8552 | 102/18723 | 2.82e-03 | 1.19e-02 | 61 |
| GO:00160427 | Esophagus | ESCC | lipid catabolic process | 168/8552 | 320/18723 | 7.97e-03 | 2.84e-02 | 168 |
| GO:001605212 | Liver | Cirrhotic | carbohydrate catabolic process | 66/4634 | 154/18723 | 6.10e-07 | 1.32e-05 | 66 |
| GO:004424212 | Liver | Cirrhotic | cellular lipid catabolic process | 82/4634 | 214/18723 | 6.91e-06 | 1.08e-04 | 82 |
| GO:001604212 | Liver | Cirrhotic | lipid catabolic process | 112/4634 | 320/18723 | 2.31e-05 | 3.03e-04 | 112 |
| Page: 1 2 3 |
| Pathway ID | Tissue | Disease Stage | Description | Gene Ratio | Bg Ratio | pvalue | p.adjust | qvalue | Count |
| hsa04142 | Colorectum | SER | Lysosome | 38/1580 | 132/8465 | 2.87e-03 | 2.03e-02 | 1.47e-02 | 38 |
| hsa041421 | Colorectum | SER | Lysosome | 38/1580 | 132/8465 | 2.87e-03 | 2.03e-02 | 1.47e-02 | 38 |
| hsa041426 | Esophagus | HGIN | Lysosome | 33/1383 | 132/8465 | 6.65e-03 | 4.37e-02 | 3.47e-02 | 33 |
| hsa0414213 | Esophagus | HGIN | Lysosome | 33/1383 | 132/8465 | 6.65e-03 | 4.37e-02 | 3.47e-02 | 33 |
| hsa0414222 | Esophagus | ESCC | Lysosome | 102/4205 | 132/8465 | 5.11e-11 | 7.13e-10 | 3.65e-10 | 102 |
| hsa006003 | Esophagus | ESCC | Sphingolipid metabolism | 36/4205 | 53/8465 | 5.41e-03 | 1.36e-02 | 6.99e-03 | 36 |
| hsa0414232 | Esophagus | ESCC | Lysosome | 102/4205 | 132/8465 | 5.11e-11 | 7.13e-10 | 3.65e-10 | 102 |
| hsa0060012 | Esophagus | ESCC | Sphingolipid metabolism | 36/4205 | 53/8465 | 5.41e-03 | 1.36e-02 | 6.99e-03 | 36 |
| hsa041424 | Liver | Cirrhotic | Lysosome | 68/2530 | 132/8465 | 1.34e-07 | 1.97e-06 | 1.21e-06 | 68 |
| hsa0414211 | Liver | Cirrhotic | Lysosome | 68/2530 | 132/8465 | 1.34e-07 | 1.97e-06 | 1.21e-06 | 68 |
| hsa041422 | Liver | HCC | Lysosome | 100/4020 | 132/8465 | 2.32e-11 | 4.31e-10 | 2.40e-10 | 100 |
| hsa00511 | Liver | HCC | Other glycan degradation | 15/4020 | 18/8465 | 1.96e-03 | 6.91e-03 | 3.84e-03 | 15 |
| hsa00600 | Liver | HCC | Sphingolipid metabolism | 34/4020 | 53/8465 | 1.06e-02 | 2.71e-02 | 1.51e-02 | 34 |
| hsa041423 | Liver | HCC | Lysosome | 100/4020 | 132/8465 | 2.32e-11 | 4.31e-10 | 2.40e-10 | 100 |
| hsa005111 | Liver | HCC | Other glycan degradation | 15/4020 | 18/8465 | 1.96e-03 | 6.91e-03 | 3.84e-03 | 15 |
| hsa006001 | Liver | HCC | Sphingolipid metabolism | 34/4020 | 53/8465 | 1.06e-02 | 2.71e-02 | 1.51e-02 | 34 |
| hsa041425 | Oral cavity | OSCC | Lysosome | 87/3704 | 132/8465 | 1.97e-07 | 1.35e-06 | 6.86e-07 | 87 |
| hsa006002 | Oral cavity | OSCC | Sphingolipid metabolism | 33/3704 | 53/8465 | 5.00e-03 | 1.20e-02 | 6.13e-03 | 33 |
| hsa0414212 | Oral cavity | OSCC | Lysosome | 87/3704 | 132/8465 | 1.97e-07 | 1.35e-06 | 6.86e-07 | 87 |
| hsa0060011 | Oral cavity | OSCC | Sphingolipid metabolism | 33/3704 | 53/8465 | 5.00e-03 | 1.20e-02 | 6.13e-03 | 33 |
| Page: 1 2 |
Top |
Cell-cell communication analysis |
| Identification of potential cell-cell interactions between two cell types and their ligand-receptor pairs for different disease states |
| Ligand | Receptor | LRpair | Pathway | Tissue | Disease Stage |
| Page: 1 |
Top |
Single-cell gene regulatory network inference analysis |
| Find out the significant the regulons (TFs) and the target genes of each regulon across cell types for different disease states |
| TF | Cell Type | Tissue | Disease Stage | Target Gene | RSS | Regulon Activity |
| ∗The dot plots of a searched regulon are shown for all cell subpopulations in each disease state of each tissue based on the regulon specific score inferred using pySCENIC and by calculating the average expression. |
| Page: 1 |
Top |
Somatic mutation of malignant transformation related genes |
| Annotation of somatic variants for genes involved in malignant transformation |
| Hugo Symbol | Variant Class | Variant Classification | dbSNP RS | HGVSc | HGVSp | HGVSp Short | SWISSPROT | BIOTYPE | SIFT | PolyPhen | Tumor Sample Barcode | Tissue | Histology | Sex | Age | Stage | Therapy Types | Drugs | Outcome |
| NEU1 | SNV | Missense_Mutation | c.998C>G | p.Ser333Cys | p.S333C | Q99519 | protein_coding | deleterious(0) | probably_damaging(0.995) | TCGA-BH-A0DZ-01 | Breast | breast invasive carcinoma | Female | <65 | I/II | Chemotherapy | docetaxel | SD | |
| NEU1 | SNV | Missense_Mutation | c.28N>T | p.Leu10Phe | p.L10F | Q99519 | protein_coding | tolerated_low_confidence(0.27) | benign(0) | TCGA-BH-A0HF-01 | Breast | breast invasive carcinoma | Female | >=65 | I/II | Hormone Therapy | arimidex | SD | |
| NEU1 | deletion | Frame_Shift_Del | novel | c.889_898delNNNNNNNNNN | p.Asp297IlefsTer3 | p.D297Ifs*3 | Q99519 | protein_coding | TCGA-A2-A4S2-01 | Breast | breast invasive carcinoma | Female | <65 | III/IV | Chemotherapy | adriamycin | CR | ||
| NEU1 | insertion | Nonsense_Mutation | novel | c.1043_1044insAAAGGGGAAA | p.Trp348Ter | p.W348* | Q99519 | protein_coding | TCGA-BH-A0B1-01 | Breast | breast invasive carcinoma | Female | >=65 | I/II | Chemotherapy | adriamycin | SD | ||
| NEU1 | insertion | Frame_Shift_Ins | novel | c.1041_1042insGGAAAGATTGGGACAAGTGGCAGGAGAC | p.Trp348GlyfsTer56 | p.W348Gfs*56 | Q99519 | protein_coding | TCGA-BH-A0B1-01 | Breast | breast invasive carcinoma | Female | >=65 | I/II | Chemotherapy | adriamycin | SD | ||
| NEU1 | SNV | Missense_Mutation | c.640C>T | p.Arg214Cys | p.R214C | Q99519 | protein_coding | deleterious(0) | probably_damaging(0.998) | TCGA-2W-A8YY-01 | Cervix | cervical & endocervical cancer | Female | <65 | I/II | Chemotherapy | cisplatin | CR | |
| NEU1 | SNV | Missense_Mutation | c.1180N>A | p.Glu394Lys | p.E394K | Q99519 | protein_coding | deleterious(0) | probably_damaging(1) | TCGA-EX-A69L-01 | Cervix | cervical & endocervical cancer | Female | <65 | I/II | Unknown | Unknown | SD | |
| NEU1 | SNV | Missense_Mutation | c.118N>G | p.Leu40Val | p.L40V | Q99519 | protein_coding | tolerated(1) | benign(0.001) | TCGA-JW-A5VL-01 | Cervix | cervical & endocervical cancer | Female | <65 | I/II | Unknown | Unknown | SD | |
| NEU1 | SNV | Missense_Mutation | novel | c.98N>T | p.Ala33Val | p.A33V | Q99519 | protein_coding | tolerated(0.39) | benign(0) | TCGA-VS-A8QF-01 | Cervix | cervical & endocervical cancer | Female | <65 | I/II | Chemotherapy | cisplatin | CR |
| NEU1 | SNV | Missense_Mutation | c.314N>C | p.Gly105Ala | p.G105A | Q99519 | protein_coding | tolerated(0.09) | possibly_damaging(0.705) | TCGA-A6-2675-01 | Colorectum | colon adenocarcinoma | Male | >=65 | I/II | Unknown | Unknown | SD |
| Page: 1 2 3 4 |
Top |
Related drugs of malignant transformation related genes |
| Identification of chemicals and drugs interact with genes involved in malignant transfromation |
| (DGIdb 4.0) |
| Entrez ID | Symbol | Category | Interaction Types | Drug Claim Name | Drug Name | PMIDs |
| Page: 1 |

Copyright 2023-Present -The University of Texas Health Science Center at Houston |