
|
|||||
|
 | |
| |
| |
| |
| |
| |
|
Gene: MIR210HG |
Gene summary for MIR210HG |
| Gene information | Species | Human | Gene symbol | MIR210HG | Gene ID | 100506211 |
| Gene name | MIR210 host gene | |
| Gene Alias | MIR210HG | |
| Cytomap | 11p15.5 | |
| Gene Type | ncRNA | GO ID | NA | UniProtAcc | NA |
Top |
Malignant transformation analysis |
| Identification of the aberrant gene expression in precancerous and cancerous lesions by comparing the gene expression of stem-like cells in diseased tissues with normal stem cells |
| Entrez ID | Symbol | Replicates | Species | Organ | Tissue | Adj P-value | Log2FC | Malignancy |
| 100506211 | MIR210HG | HCC1_Meng | Human | Liver | HCC | 5.04e-32 | 6.62e-02 | 0.0246 |
| 100506211 | MIR210HG | HCC1 | Human | Liver | HCC | 3.79e-03 | 8.69e-01 | 0.5336 |
| 100506211 | MIR210HG | HCC2 | Human | Liver | HCC | 2.45e-17 | 3.03e+00 | 0.5341 |
| 100506211 | MIR210HG | S015 | Human | Liver | HCC | 3.30e-03 | 3.16e-01 | 0.2375 |
| 100506211 | MIR210HG | S029 | Human | Liver | HCC | 6.19e-07 | 3.84e-01 | 0.2581 |
| 100506211 | MIR210HG | C21 | Human | Oral cavity | OSCC | 5.82e-10 | 4.58e-01 | 0.2678 |
| 100506211 | MIR210HG | C43 | Human | Oral cavity | OSCC | 2.78e-23 | 4.89e-01 | 0.1704 |
| 100506211 | MIR210HG | C51 | Human | Oral cavity | OSCC | 6.87e-11 | 6.22e-01 | 0.2674 |
| 100506211 | MIR210HG | C08 | Human | Oral cavity | OSCC | 2.72e-07 | 2.02e-01 | 0.1919 |
| 100506211 | MIR210HG | SYSMH1 | Human | Oral cavity | OSCC | 1.37e-33 | 7.44e-01 | 0.1127 |
| 100506211 | MIR210HG | ATC09 | Human | Thyroid | ATC | 1.54e-16 | 5.67e-01 | 0.2871 |
| 100506211 | MIR210HG | ATC12 | Human | Thyroid | ATC | 1.19e-10 | 2.45e-01 | 0.34 |
| 100506211 | MIR210HG | ATC13 | Human | Thyroid | ATC | 1.15e-03 | 1.12e-01 | 0.34 |
| 100506211 | MIR210HG | ATC1 | Human | Thyroid | ATC | 1.41e-18 | 6.48e-01 | 0.2878 |
| 100506211 | MIR210HG | ATC4 | Human | Thyroid | ATC | 8.48e-13 | 3.05e-01 | 0.34 |
| 100506211 | MIR210HG | ATC5 | Human | Thyroid | ATC | 5.14e-03 | 1.15e-01 | 0.34 |
| Page: 1 |
| Tissue | Expression Dynamics | Abbreviation |
| Liver | 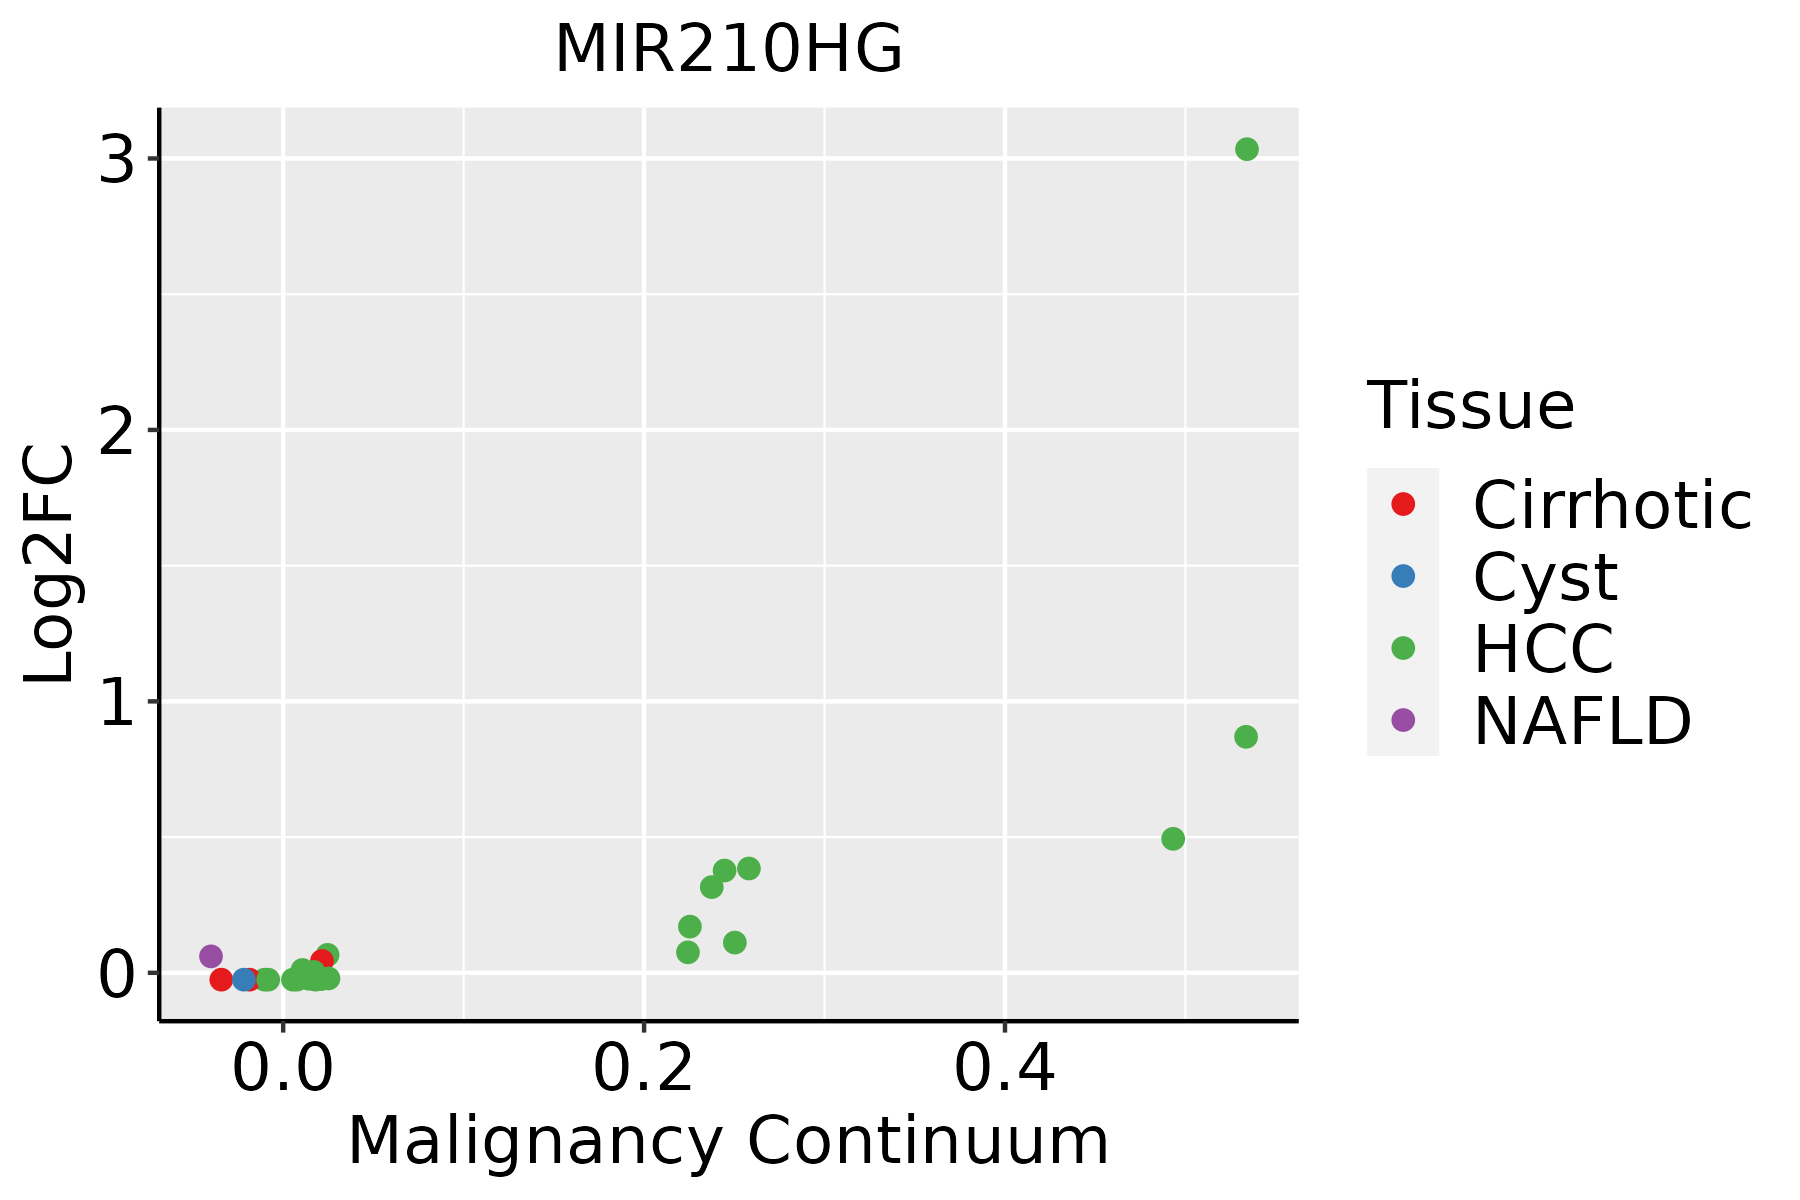 | HCC: Hepatocellular carcinoma |
| NAFLD: Non-alcoholic fatty liver disease | ||
| Oral Cavity | 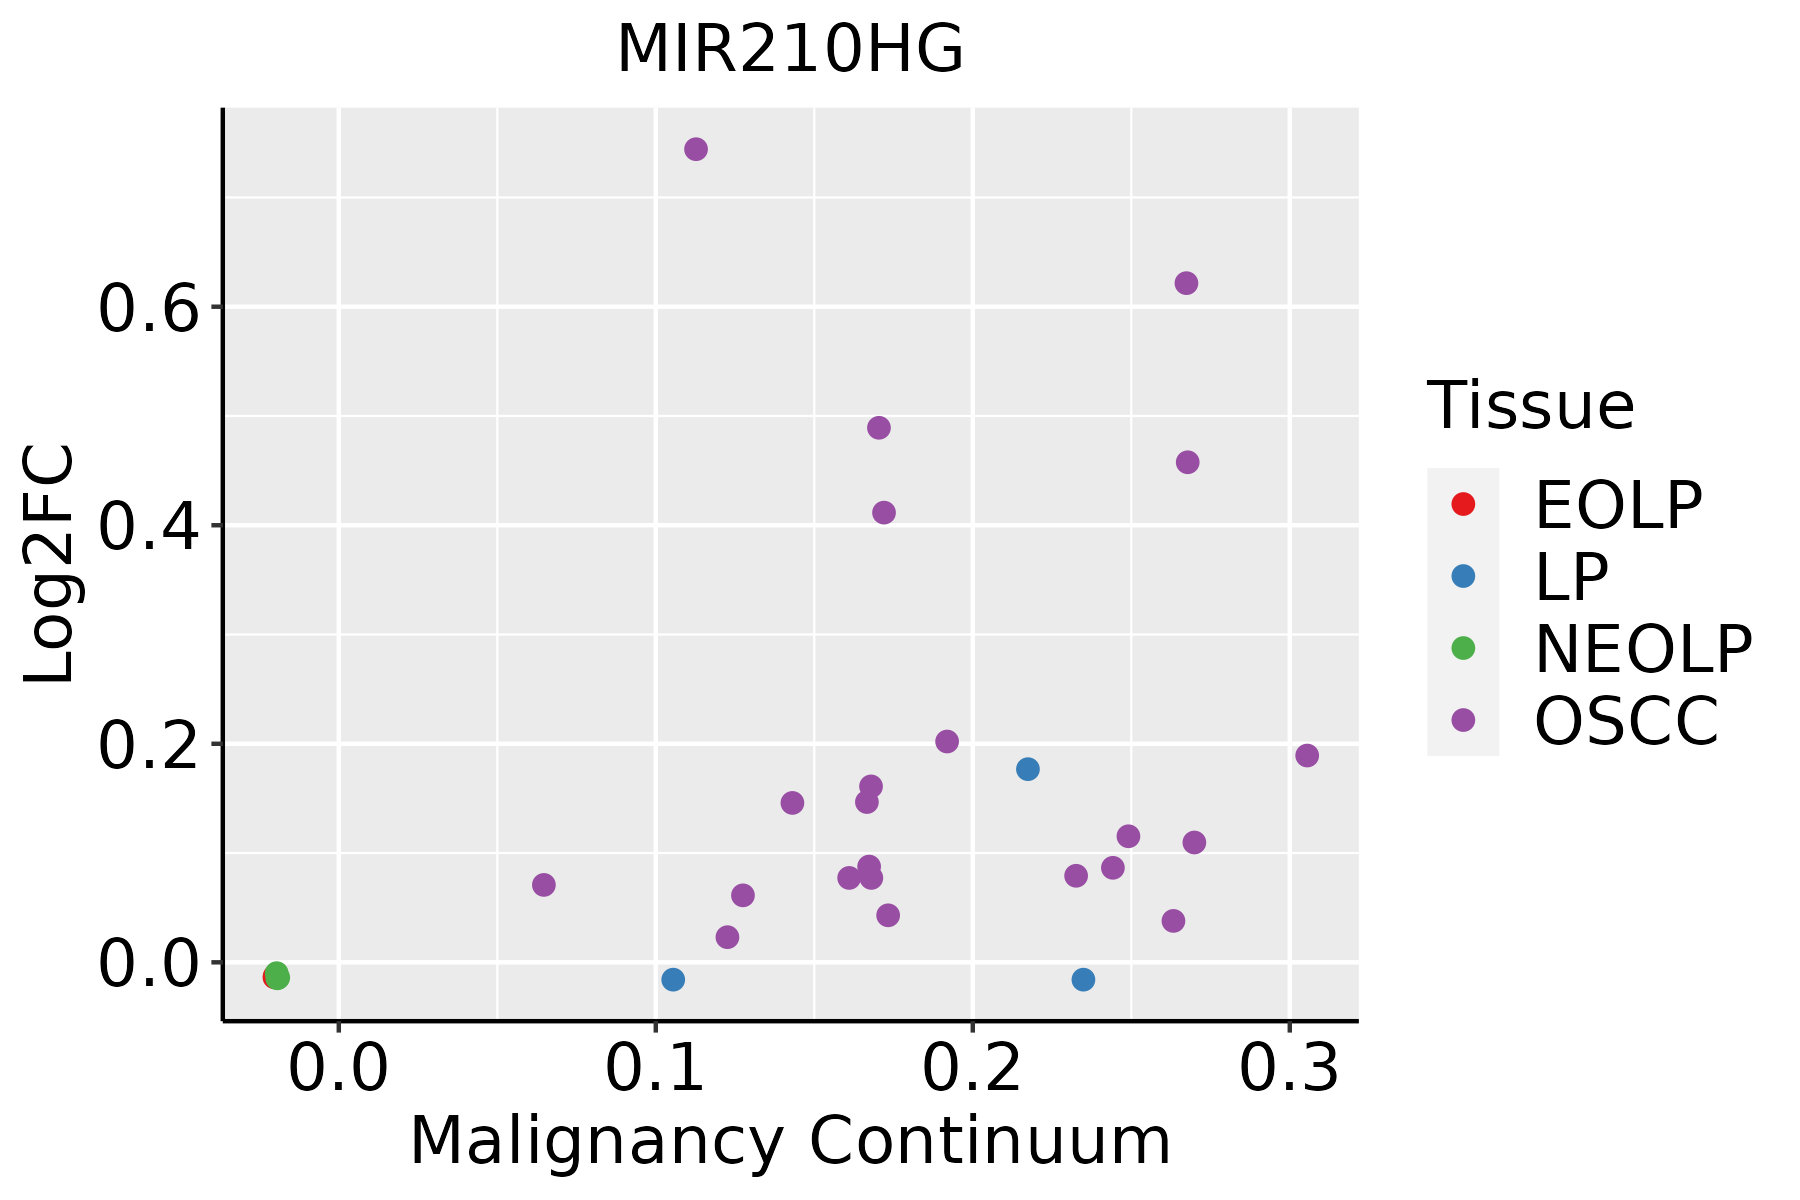 | EOLP: Erosive Oral lichen planus |
| LP: leukoplakia | ||
| NEOLP: Non-erosive oral lichen planus | ||
| OSCC: Oral squamous cell carcinoma | ||
| Thyroid | 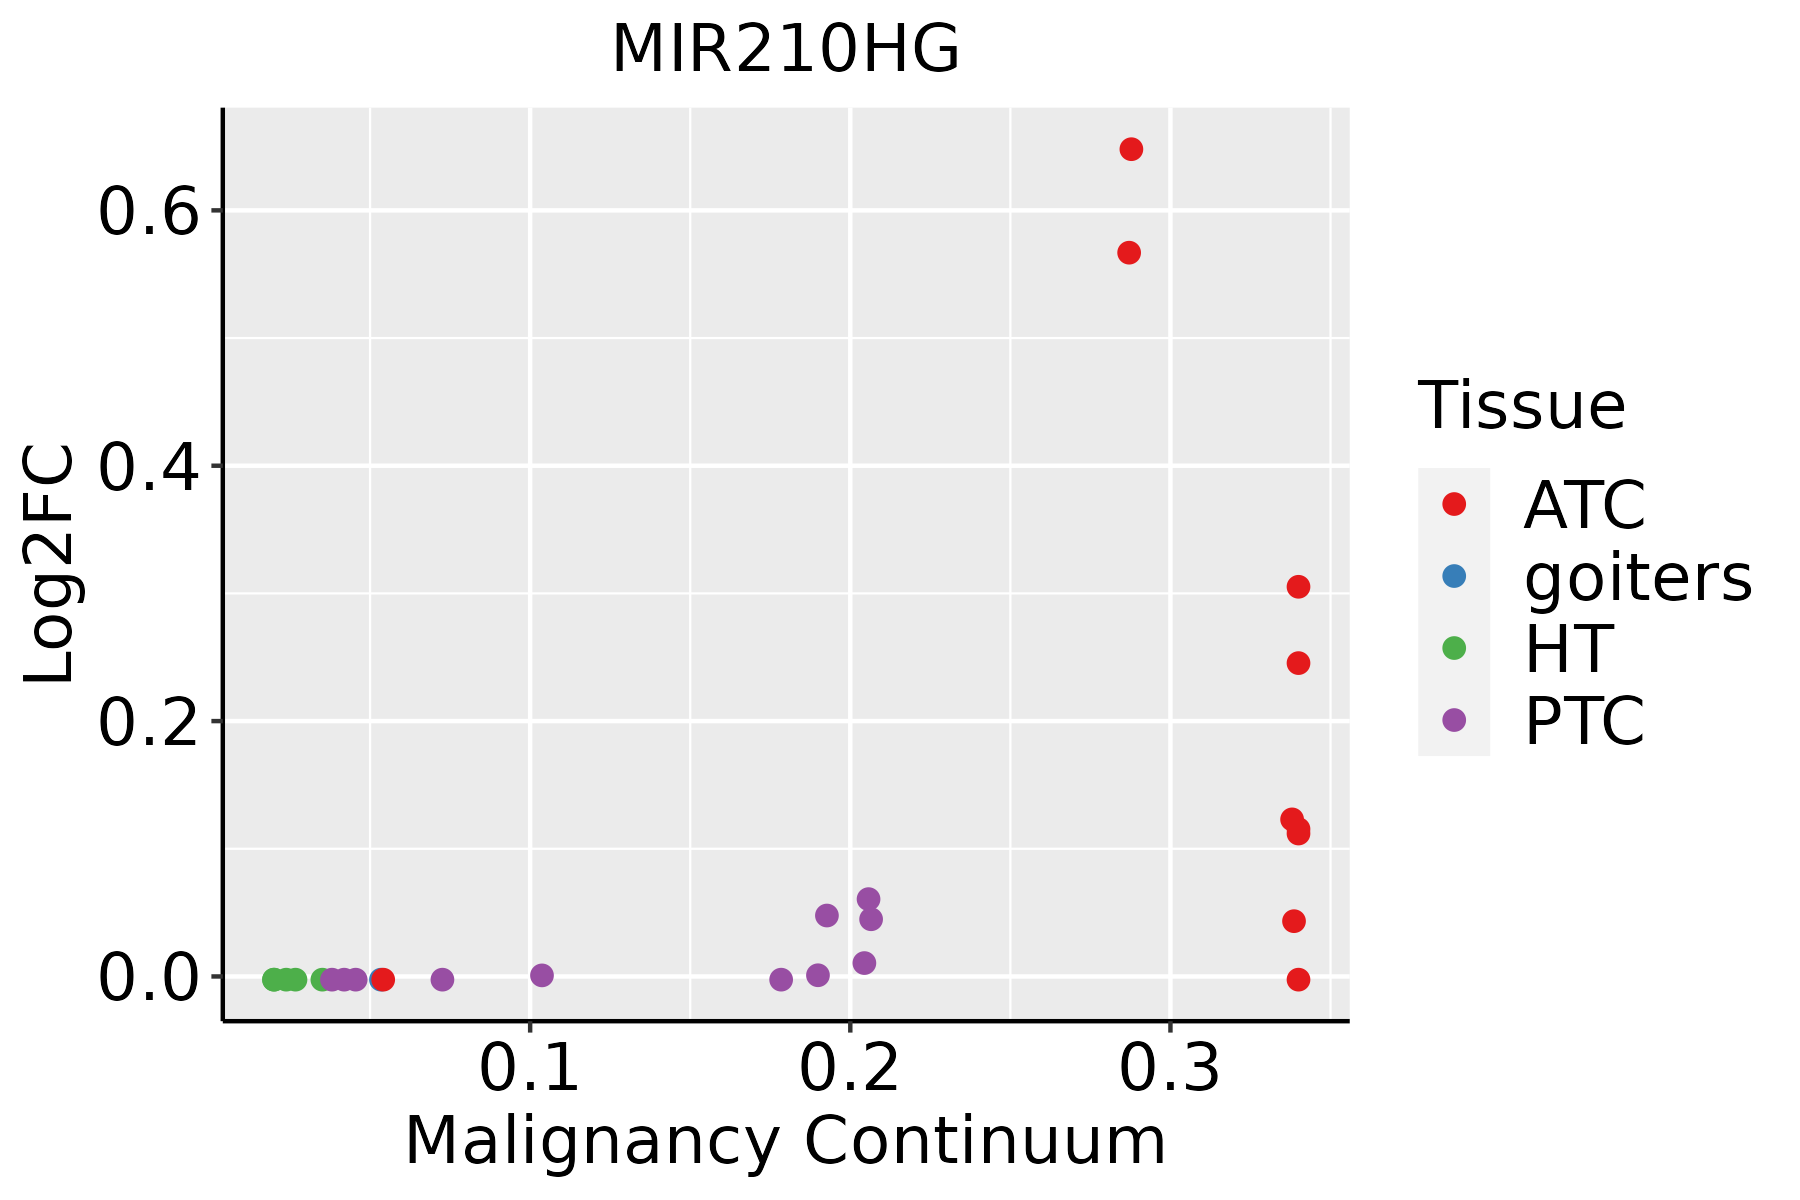 | ATC: Anaplastic thyroid cancer |
| HT: Hashimoto's thyroiditis | ||
| PTC: Papillary thyroid cancer |
| ∗log2FC in expression of this searched gene in stem-like cells from each diseased tissue sample relative to stem-like cells in normal samples in each tissue plotted against the malignancy continuum. Samples are colored based on if they are from different disease stage. |
Top |
Malignant transformation related pathway analysis |
| Find out the enriched GO biological processes and KEGG pathways involved in transition from healthy to precancer to cancer |
| Tissue | Disease Stage | Enriched GO biological Processes |
| Stomach | WIM |  |
| Stomach | SIM |  |
| Liver | NAFLD |  |
| Liver | Cirrhotic |  |
| Liver | HCC |  |
| ∗Top 15 enriched GO BP terms are showed in the bar plot of each disease state in each tissue. Each row represents a significant GO biological process which is colored according to the -log10(p.adjust). |
| Page: 1 2 3 4 5 6 7 8 9 |
| GO ID | Tissue | Disease Stage | Description | Gene Ratio | Bg Ratio | pvalue | p.adjust | Count |
| Page: 1 |
| Pathway ID | Tissue | Disease Stage | Description | Gene Ratio | Bg Ratio | pvalue | p.adjust | qvalue | Count |
| Page: 1 |
Top |
Cell-cell communication analysis |
| Identification of potential cell-cell interactions between two cell types and their ligand-receptor pairs for different disease states |
| Ligand | Receptor | LRpair | Pathway | Tissue | Disease Stage |
| Page: 1 |
Top |
Single-cell gene regulatory network inference analysis |
| Find out the significant the regulons (TFs) and the target genes of each regulon across cell types for different disease states |
| TF | Cell Type | Tissue | Disease Stage | Target Gene | RSS | Regulon Activity |
| ∗The dot plots of a searched regulon are shown for all cell subpopulations in each disease state of each tissue based on the regulon specific score inferred using pySCENIC and by calculating the average expression. |
| Page: 1 |
Top |
Somatic mutation of malignant transformation related genes |
| Annotation of somatic variants for genes involved in malignant transformation |
| Hugo Symbol | Variant Class | Variant Classification | dbSNP RS | HGVSc | HGVSp | HGVSp Short | SWISSPROT | BIOTYPE | SIFT | PolyPhen | Tumor Sample Barcode | Tissue | Histology | Sex | Age | Stage | Therapy Types | Drugs | Outcome |
| Page: 1 |
Top |
Related drugs of malignant transformation related genes |
| Identification of chemicals and drugs interact with genes involved in malignant transfromation |
| (DGIdb 4.0) |
| Entrez ID | Symbol | Category | Interaction Types | Drug Claim Name | Drug Name | PMIDs |
| Page: 1 |

Copyright 2023-Present -The University of Texas Health Science Center at Houston |