
|
|||||
|
 | |
| |
| |
| |
| |
| |
|
Gene: MICOS10 |
Gene summary for MICOS10 |
| Gene information | Species | Human | Gene symbol | MICOS10 | Gene ID | 440574 |
| Gene name | mitochondrial contact site and cristae organizing system subunit 10 | |
| Gene Alias | C1orf151 | |
| Cytomap | 1p36.13 | |
| Gene Type | protein-coding | GO ID | GO:0006996 | UniProtAcc | Q5TGZ0 |
Top |
Malignant transformation analysis |
| Identification of the aberrant gene expression in precancerous and cancerous lesions by comparing the gene expression of stem-like cells in diseased tissues with normal stem cells |
| Entrez ID | Symbol | Replicates | Species | Organ | Tissue | Adj P-value | Log2FC | Malignancy |
| 440574 | MICOS10 | CA_HPV_1 | Human | Cervix | CC | 2.04e-06 | -5.95e-02 | 0.0264 |
| 440574 | MICOS10 | CA_HPV_3 | Human | Cervix | CC | 1.26e-05 | 8.83e-02 | 0.0414 |
| 440574 | MICOS10 | CCI_1 | Human | Cervix | CC | 4.80e-16 | -8.32e-01 | 0.528 |
| 440574 | MICOS10 | CCI_2 | Human | Cervix | CC | 1.04e-09 | -7.67e-01 | 0.5249 |
| 440574 | MICOS10 | CCI_3 | Human | Cervix | CC | 1.99e-15 | -7.85e-01 | 0.516 |
| 440574 | MICOS10 | CCII_1 | Human | Cervix | CC | 3.00e-28 | -8.32e-01 | 0.3249 |
| 440574 | MICOS10 | Tumor | Human | Cervix | CC | 1.87e-49 | -8.32e-01 | 0.1241 |
| 440574 | MICOS10 | L1 | Human | Cervix | CC | 2.32e-07 | -1.08e-02 | 0.0802 |
| 440574 | MICOS10 | HTA11_3410_2000001011 | Human | Colorectum | AD | 8.02e-111 | 1.72e+00 | 0.0155 |
| 440574 | MICOS10 | HTA11_2487_2000001011 | Human | Colorectum | SER | 1.12e-86 | 2.01e+00 | -0.1808 |
| 440574 | MICOS10 | HTA11_2951_2000001011 | Human | Colorectum | AD | 8.37e-43 | 2.46e+00 | 0.0216 |
| 440574 | MICOS10 | HTA11_1938_2000001011 | Human | Colorectum | AD | 3.43e-82 | 2.35e+00 | -0.0811 |
| 440574 | MICOS10 | HTA11_78_2000001011 | Human | Colorectum | AD | 2.84e-40 | 1.05e+00 | -0.1088 |
| 440574 | MICOS10 | HTA11_347_2000001011 | Human | Colorectum | AD | 2.89e-107 | 2.13e+00 | -0.1954 |
| 440574 | MICOS10 | HTA11_411_2000001011 | Human | Colorectum | SER | 4.26e-36 | 2.53e+00 | -0.2602 |
| 440574 | MICOS10 | HTA11_2112_2000001011 | Human | Colorectum | SER | 4.49e-39 | 2.74e+00 | -0.2196 |
| 440574 | MICOS10 | HTA11_3361_2000001011 | Human | Colorectum | AD | 5.81e-83 | 2.60e+00 | -0.1207 |
| 440574 | MICOS10 | HTA11_83_2000001011 | Human | Colorectum | SER | 8.50e-65 | 2.30e+00 | -0.1526 |
| 440574 | MICOS10 | HTA11_696_2000001011 | Human | Colorectum | AD | 5.96e-133 | 2.67e+00 | -0.1464 |
| 440574 | MICOS10 | HTA11_866_2000001011 | Human | Colorectum | AD | 1.80e-114 | 2.23e+00 | -0.1001 |
| Page: 1 2 3 4 5 6 7 8 |
| Tissue | Expression Dynamics | Abbreviation |
| Cervix | 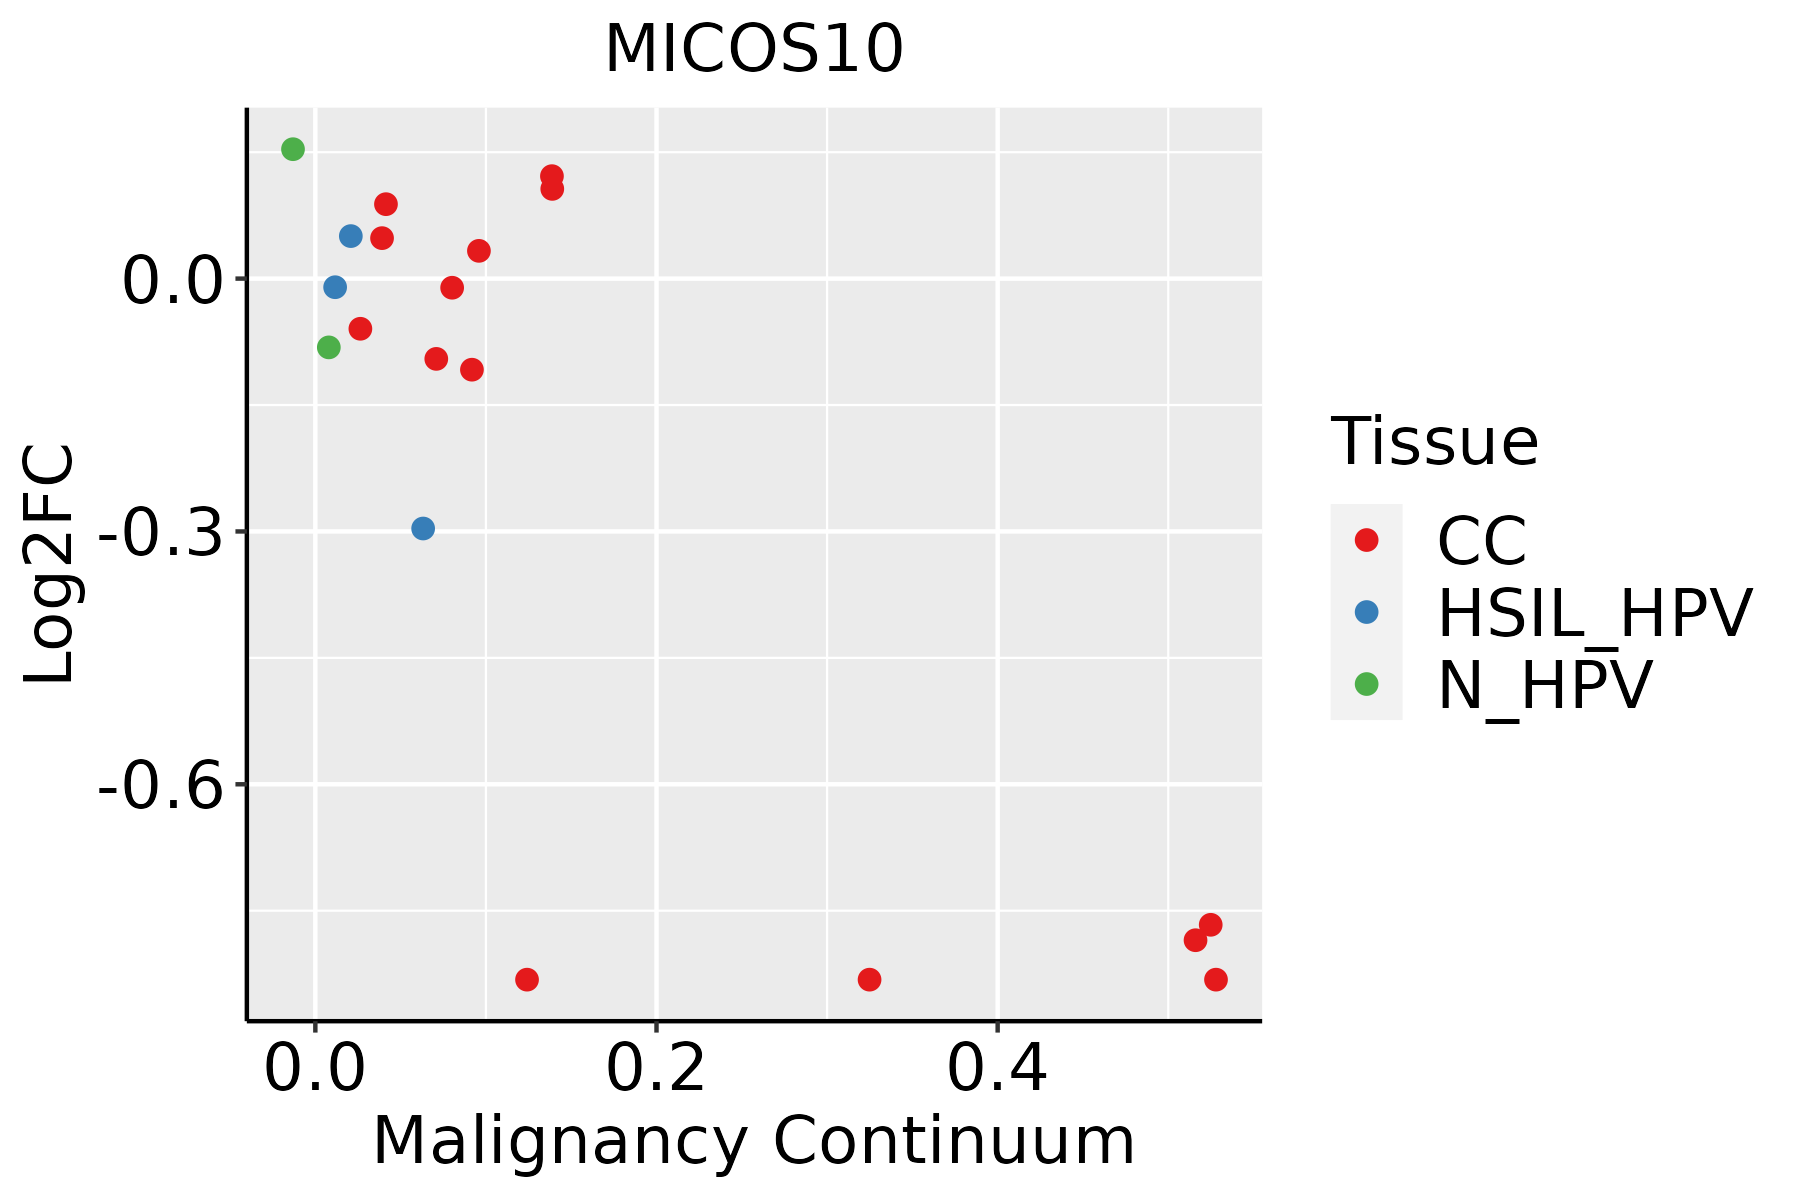 | CC: Cervix cancer |
| HSIL_HPV: HPV-infected high-grade squamous intraepithelial lesions | ||
| N_HPV: HPV-infected normal cervix | ||
| Colorectum (GSE201348) |  | FAP: Familial adenomatous polyposis |
| CRC: Colorectal cancer | ||
| Colorectum (HTA11) | 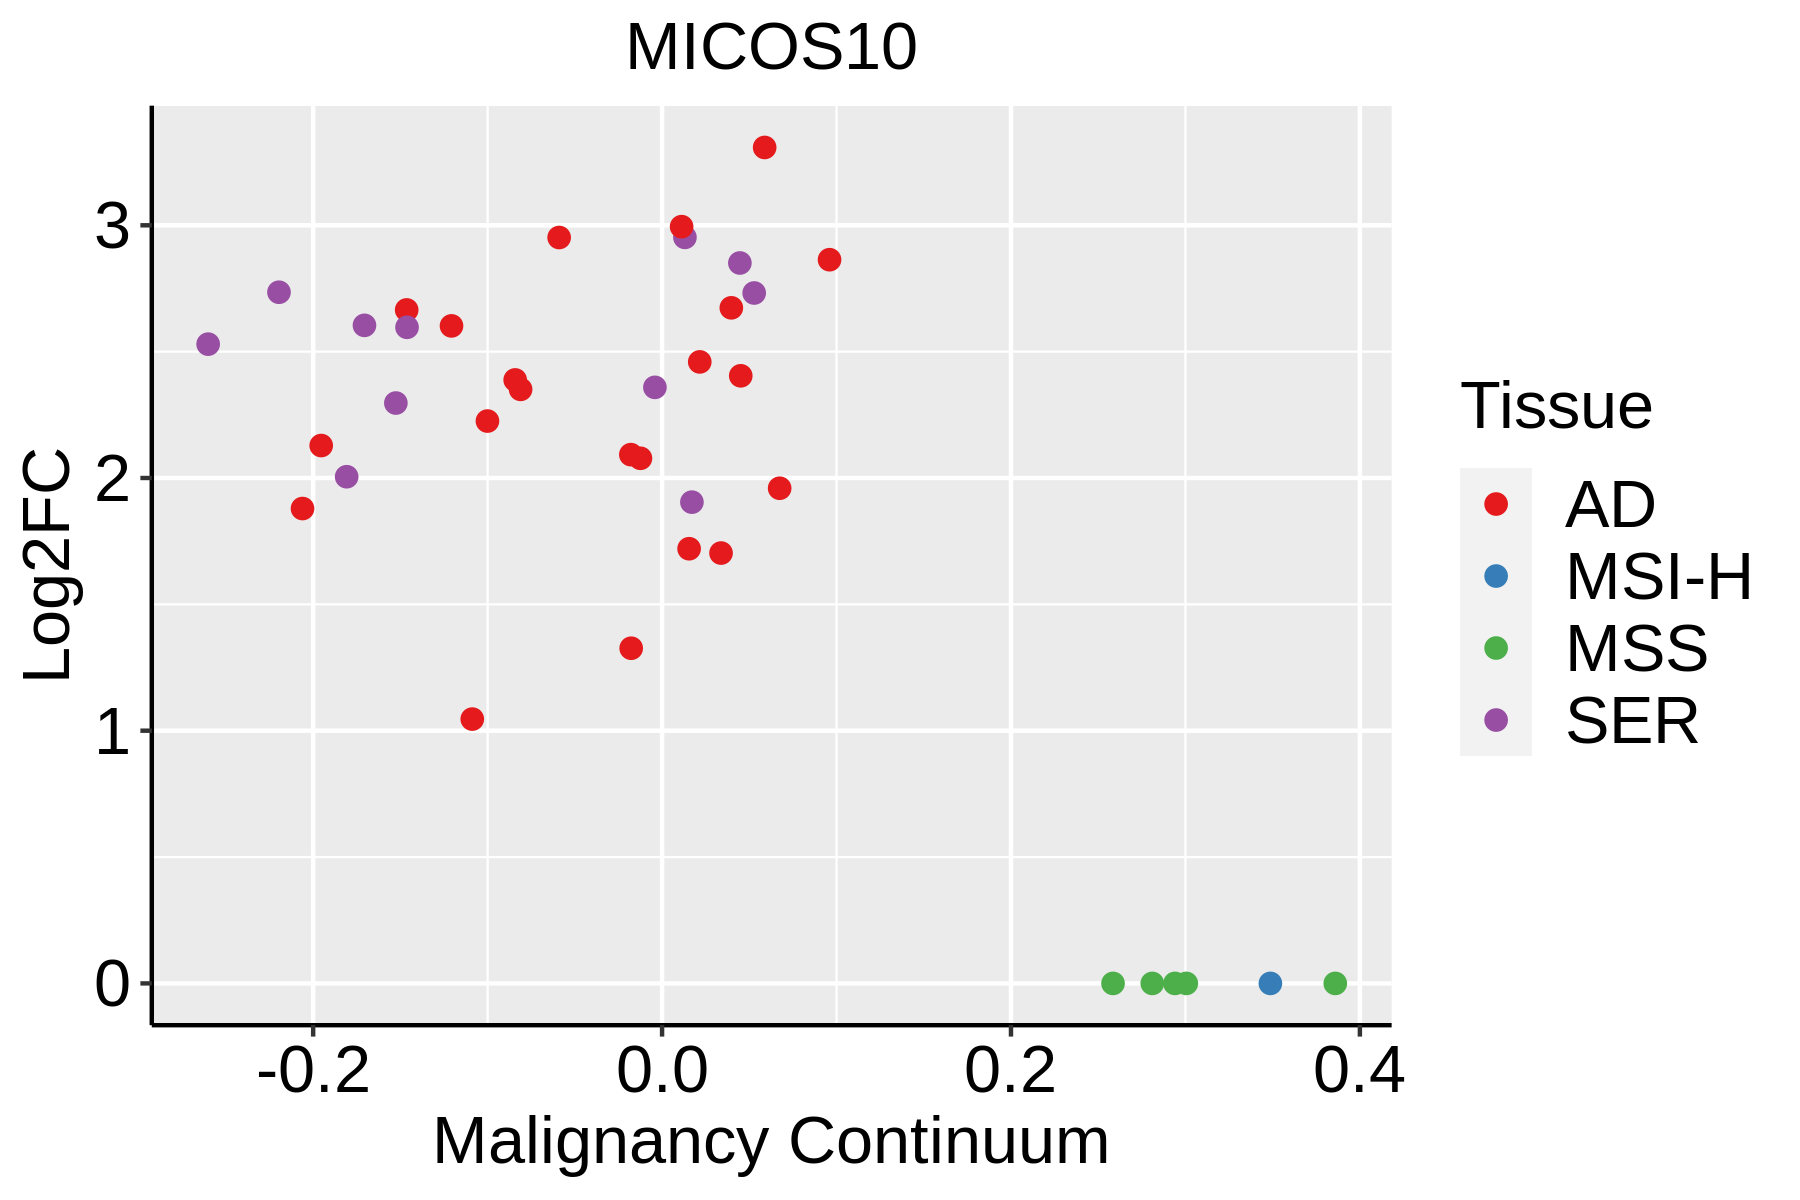 | AD: Adenomas |
| SER: Sessile serrated lesions | ||
| MSI-H: Microsatellite-high colorectal cancer | ||
| MSS: Microsatellite stable colorectal cancer | ||
| Endometrium | 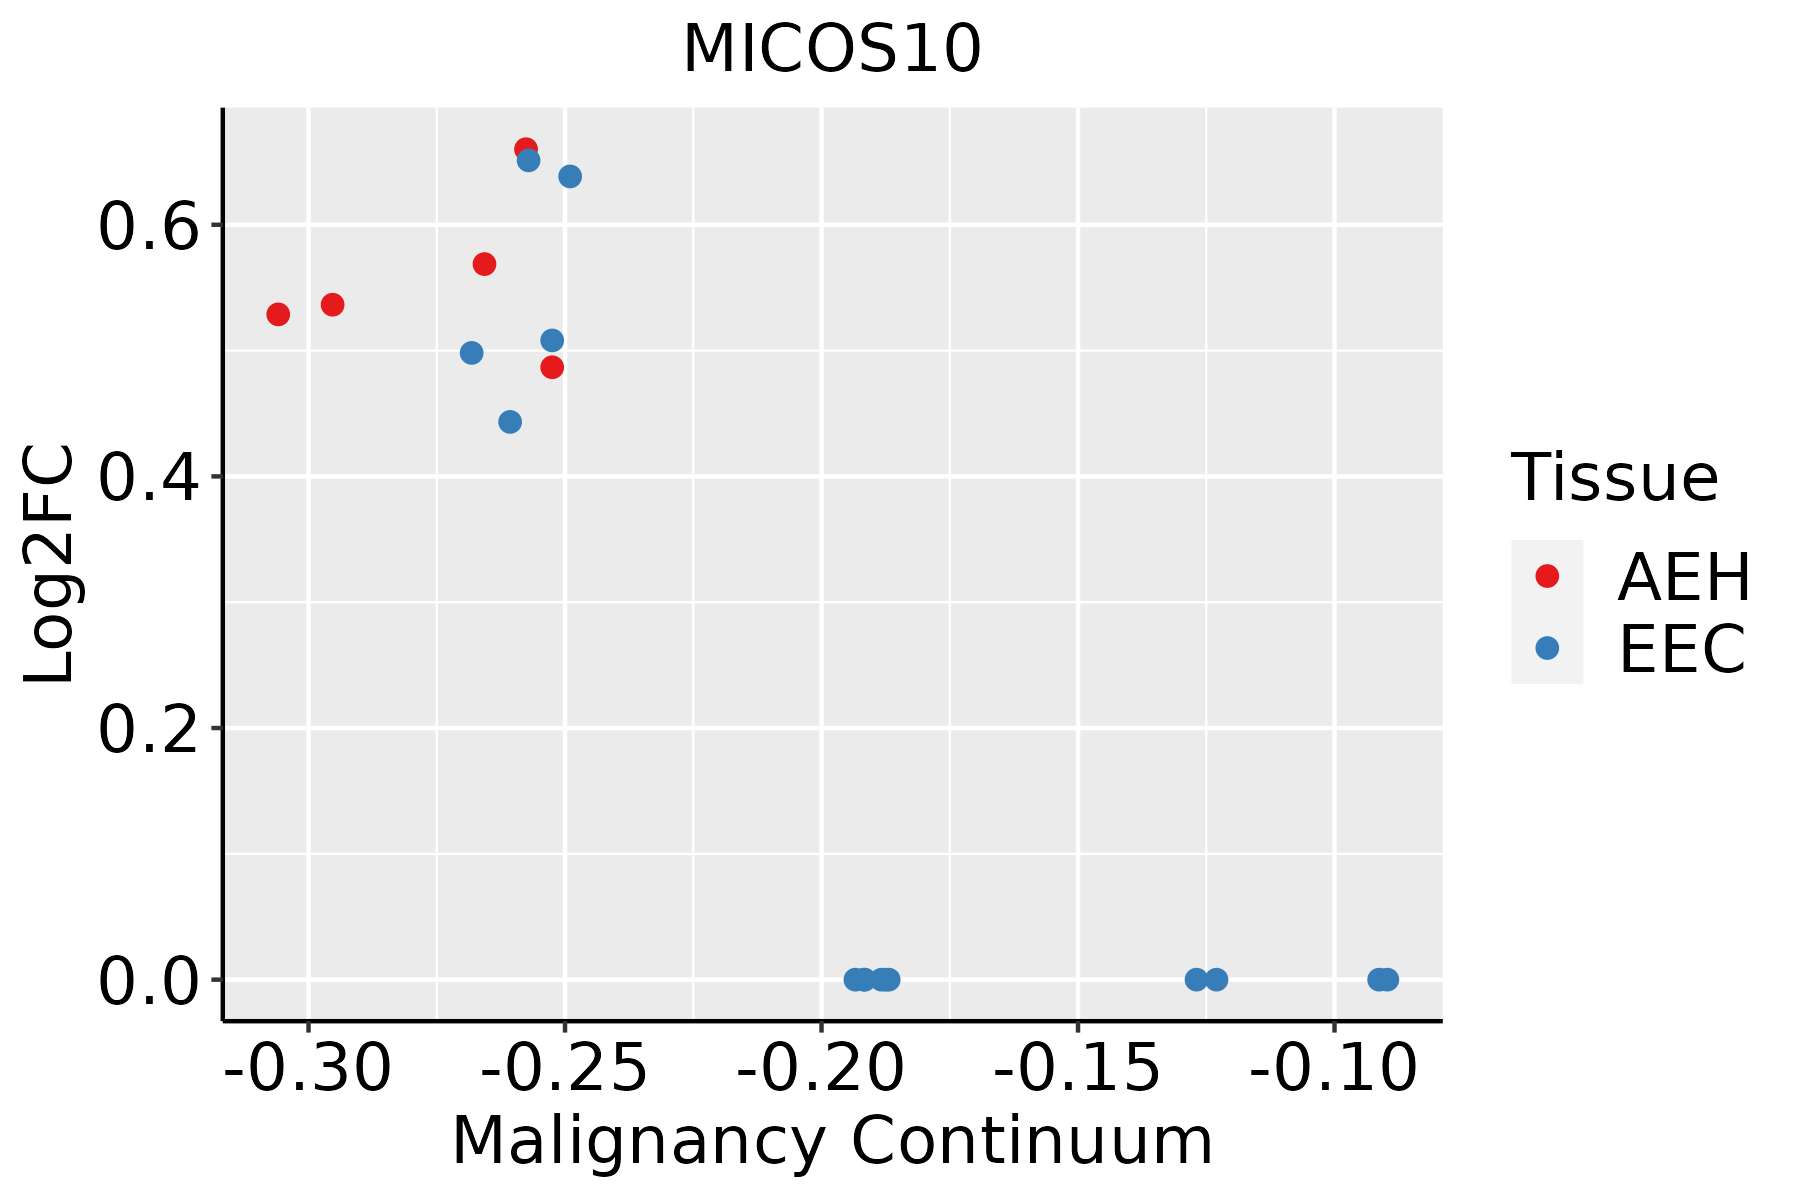 | AEH: Atypical endometrial hyperplasia |
| EEC: Endometrioid Cancer | ||
| Esophagus | 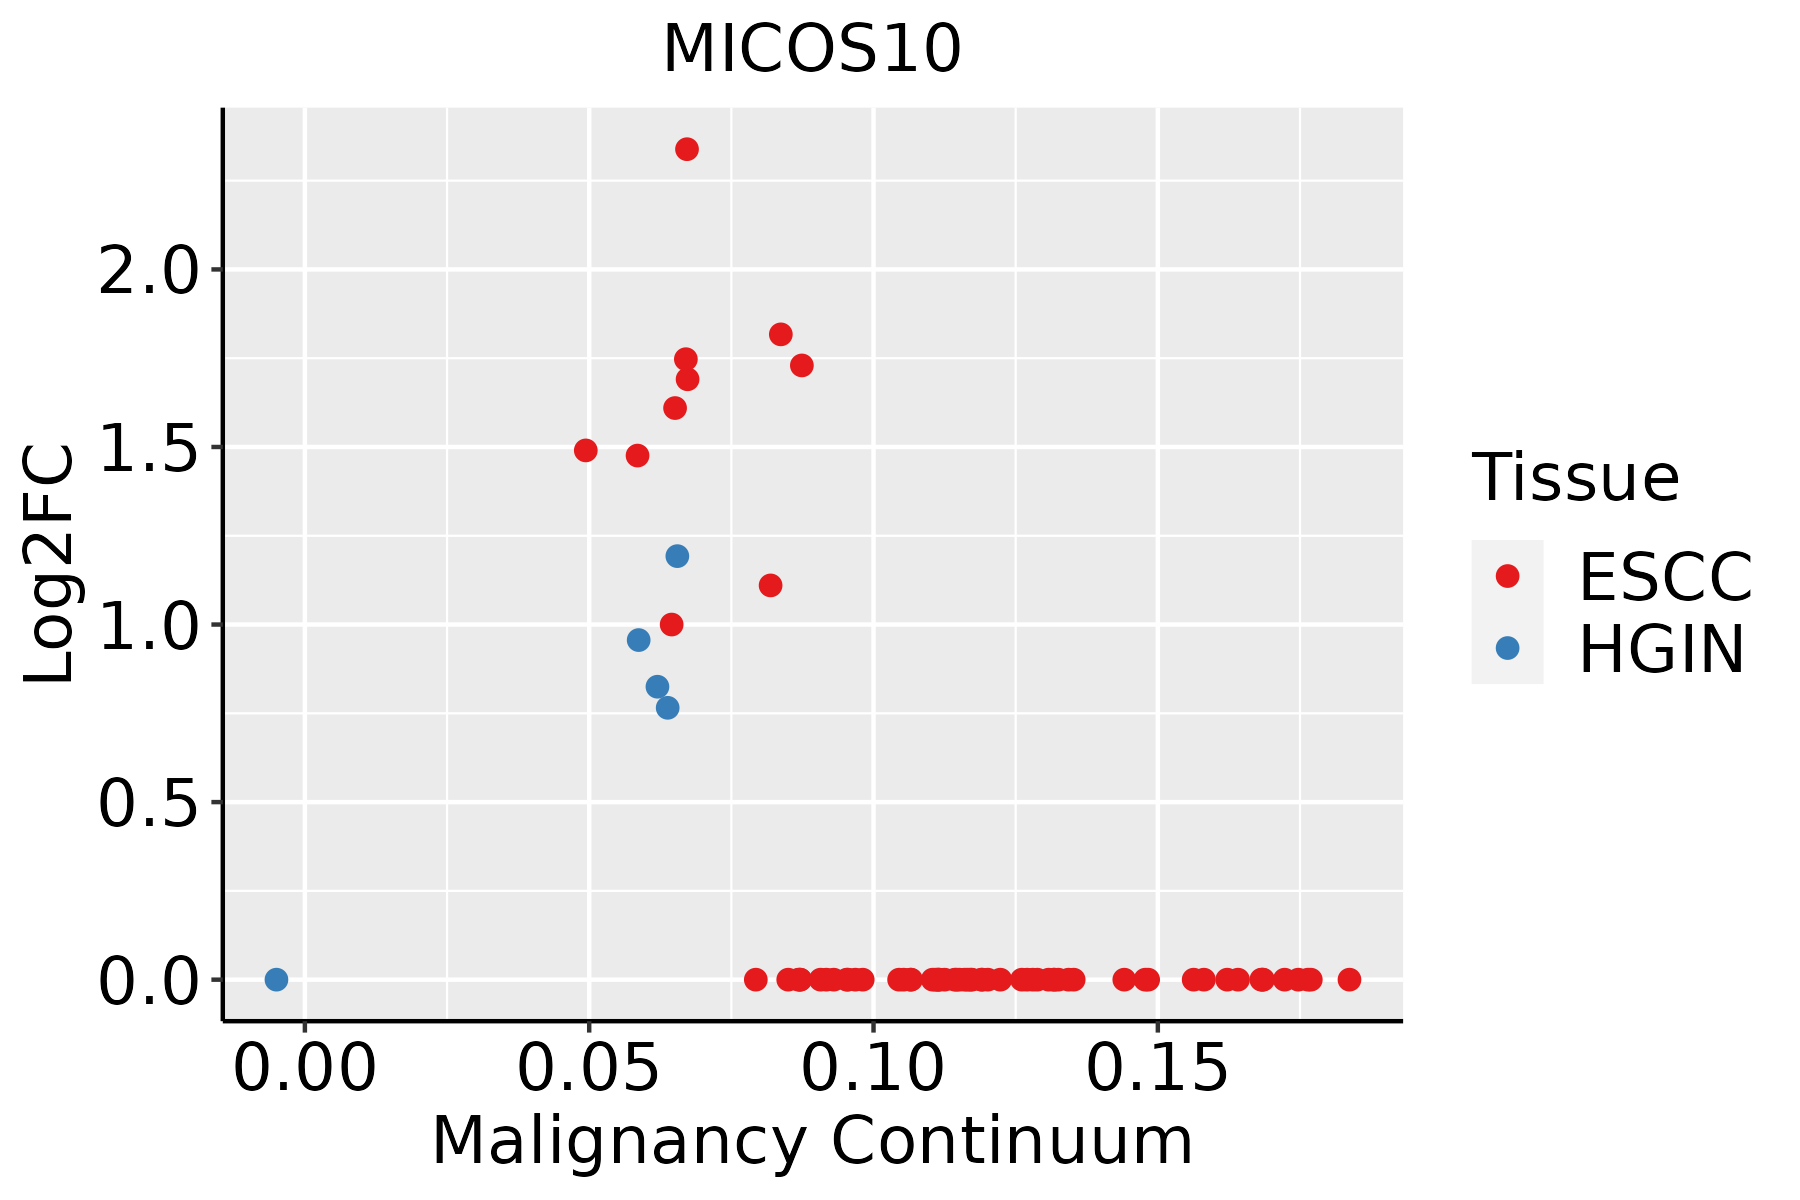 | ESCC: Esophageal squamous cell carcinoma |
| HGIN: High-grade intraepithelial neoplasias | ||
| LGIN: Low-grade intraepithelial neoplasias | ||
| GC |  | CAG: Chronic atrophic gastritis |
| CAG with IM: Chronic atrophic gastritis with intestinal metaplasia | ||
| CSG: Chronic superficial gastritis | ||
| GC: Gastric cancer | ||
| SIM: Severe intestinal metaplasia | ||
| WIM: Wild intestinal metaplasia | ||
| Lung |  | AAH: Atypical adenomatous hyperplasia |
| AIS: Adenocarcinoma in situ | ||
| IAC: Invasive lung adenocarcinoma | ||
| MIA: Minimally invasive adenocarcinoma | ||
| Prostate |  | BPH: Benign Prostatic Hyperplasia |
| Skin | 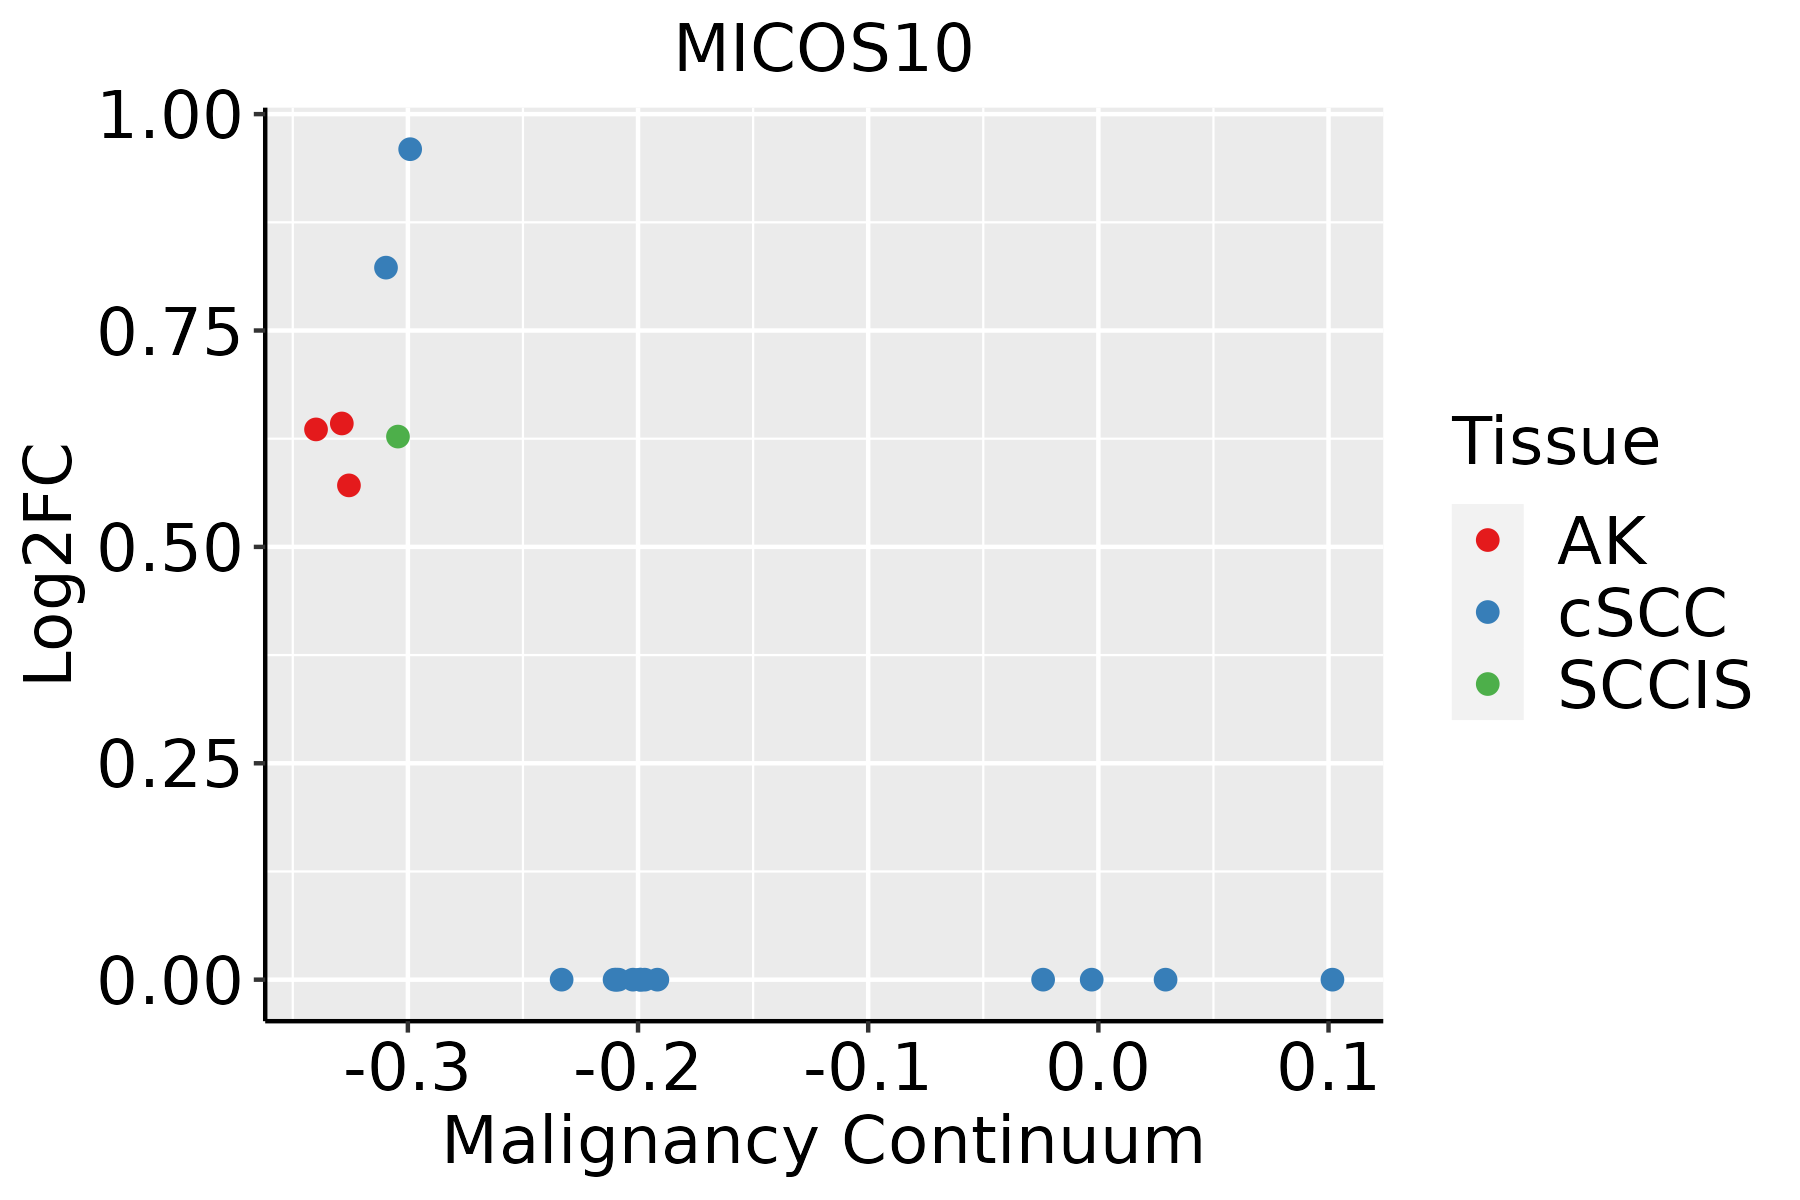 | AK: Actinic keratosis |
| cSCC: Cutaneous squamous cell carcinoma | ||
| SCCIS:squamous cell carcinoma in situ |
| ∗log2FC in expression of this searched gene in stem-like cells from each diseased tissue sample relative to stem-like cells in normal samples in each tissue plotted against the malignancy continuum. Samples are colored based on if they are from different disease stage. |
Top |
Malignant transformation related pathway analysis |
| Find out the enriched GO biological processes and KEGG pathways involved in transition from healthy to precancer to cancer |
| Tissue | Disease Stage | Enriched GO biological Processes |
| Stomach | WIM |  |
| Stomach | SIM |  |
| Liver | NAFLD |  |
| Liver | Cirrhotic |  |
| Liver | HCC |  |
| ∗Top 15 enriched GO BP terms are showed in the bar plot of each disease state in each tissue. Each row represents a significant GO biological process which is colored according to the -log10(p.adjust). |
| Page: 1 2 3 4 5 6 7 8 9 |
| GO ID | Tissue | Disease Stage | Description | Gene Ratio | Bg Ratio | pvalue | p.adjust | Count |
| GO:00070067 | Cervix | CC | mitochondrial membrane organization | 28/2311 | 116/18723 | 3.28e-04 | 3.47e-03 | 28 |
| GO:00070074 | Cervix | CC | inner mitochondrial membrane organization | 11/2311 | 38/18723 | 4.94e-03 | 2.95e-02 | 11 |
| GO:0007006 | Colorectum | AD | mitochondrial membrane organization | 48/3918 | 116/18723 | 4.53e-07 | 1.72e-05 | 48 |
| GO:0007007 | Colorectum | AD | inner mitochondrial membrane organization | 18/3918 | 38/18723 | 2.45e-04 | 3.09e-03 | 18 |
| GO:00070061 | Colorectum | SER | mitochondrial membrane organization | 38/2897 | 116/18723 | 2.66e-06 | 1.10e-04 | 38 |
| GO:00070071 | Colorectum | SER | inner mitochondrial membrane organization | 14/2897 | 38/18723 | 1.06e-03 | 1.23e-02 | 14 |
| GO:00070068 | Endometrium | AEH | mitochondrial membrane organization | 28/2100 | 116/18723 | 6.38e-05 | 9.94e-04 | 28 |
| GO:000700615 | Endometrium | EEC | mitochondrial membrane organization | 29/2168 | 116/18723 | 4.28e-05 | 7.09e-04 | 29 |
| GO:000700618 | Esophagus | HGIN | mitochondrial membrane organization | 37/2587 | 116/18723 | 4.61e-07 | 2.07e-05 | 37 |
| GO:00070076 | Esophagus | HGIN | inner mitochondrial membrane organization | 16/2587 | 38/18723 | 1.82e-05 | 4.93e-04 | 16 |
| GO:000700619 | Esophagus | ESCC | mitochondrial membrane organization | 93/8552 | 116/18723 | 2.16e-14 | 1.11e-12 | 93 |
| GO:000700713 | Esophagus | ESCC | inner mitochondrial membrane organization | 31/8552 | 38/18723 | 5.93e-06 | 6.10e-05 | 31 |
| GO:00070069 | Prostate | BPH | mitochondrial membrane organization | 35/3107 | 116/18723 | 1.98e-04 | 1.63e-03 | 35 |
| GO:000700616 | Prostate | Tumor | mitochondrial membrane organization | 35/3246 | 116/18723 | 4.65e-04 | 3.48e-03 | 35 |
| GO:000700620 | Skin | AK | mitochondrial membrane organization | 25/1910 | 116/18723 | 2.31e-04 | 2.56e-03 | 25 |
| GO:0007006110 | Skin | cSCC | mitochondrial membrane organization | 64/4864 | 116/18723 | 2.16e-11 | 1.08e-09 | 64 |
| GO:00070077 | Skin | cSCC | inner mitochondrial membrane organization | 24/4864 | 38/18723 | 1.54e-06 | 2.62e-05 | 24 |
| GO:00070064 | Stomach | GC | mitochondrial membrane organization | 18/1159 | 116/18723 | 2.71e-04 | 4.44e-03 | 18 |
| GO:000700611 | Stomach | CAG with IM | mitochondrial membrane organization | 18/1050 | 116/18723 | 7.92e-05 | 1.86e-03 | 18 |
| GO:000700621 | Stomach | CSG | mitochondrial membrane organization | 18/1034 | 116/18723 | 6.51e-05 | 1.61e-03 | 18 |
| Page: 1 |
| Pathway ID | Tissue | Disease Stage | Description | Gene Ratio | Bg Ratio | pvalue | p.adjust | qvalue | Count |
| Page: 1 |
Top |
Cell-cell communication analysis |
| Identification of potential cell-cell interactions between two cell types and their ligand-receptor pairs for different disease states |
| Ligand | Receptor | LRpair | Pathway | Tissue | Disease Stage |
| Page: 1 |
Top |
Single-cell gene regulatory network inference analysis |
| Find out the significant the regulons (TFs) and the target genes of each regulon across cell types for different disease states |
| TF | Cell Type | Tissue | Disease Stage | Target Gene | RSS | Regulon Activity |
| ∗The dot plots of a searched regulon are shown for all cell subpopulations in each disease state of each tissue based on the regulon specific score inferred using pySCENIC and by calculating the average expression. |
| Page: 1 |
Top |
Somatic mutation of malignant transformation related genes |
| Annotation of somatic variants for genes involved in malignant transformation |
| Hugo Symbol | Variant Class | Variant Classification | dbSNP RS | HGVSc | HGVSp | HGVSp Short | SWISSPROT | BIOTYPE | SIFT | PolyPhen | Tumor Sample Barcode | Tissue | Histology | Sex | Age | Stage | Therapy Types | Drugs | Outcome |
| Page: 1 |
Top |
Related drugs of malignant transformation related genes |
| Identification of chemicals and drugs interact with genes involved in malignant transfromation |
| (DGIdb 4.0) |
| Entrez ID | Symbol | Category | Interaction Types | Drug Claim Name | Drug Name | PMIDs |
| Page: 1 |

Copyright 2023-Present -The University of Texas Health Science Center at Houston |