
|
|||||
|
 | |
| |
| |
| |
| |
| |
|
Gene: METRNL |
Gene summary for METRNL |
| Gene information | Species | Human | Gene symbol | METRNL | Gene ID | 284207 |
| Gene name | meteorin like, glial cell differentiation regulator | |
| Gene Alias | METRNL | |
| Cytomap | 17q25.3 | |
| Gene Type | protein-coding | GO ID | GO:0006950 | UniProtAcc | Q641Q3 |
Top |
Malignant transformation analysis |
| Identification of the aberrant gene expression in precancerous and cancerous lesions by comparing the gene expression of stem-like cells in diseased tissues with normal stem cells |
| Entrez ID | Symbol | Replicates | Species | Organ | Tissue | Adj P-value | Log2FC | Malignancy |
| 284207 | METRNL | HTA11_2487_2000001011 | Human | Colorectum | SER | 1.40e-03 | 2.77e-01 | -0.1808 |
| 284207 | METRNL | HTA11_1938_2000001011 | Human | Colorectum | AD | 8.33e-03 | 2.67e-01 | -0.0811 |
| 284207 | METRNL | HTA11_347_2000001011 | Human | Colorectum | AD | 3.15e-11 | 3.29e-01 | -0.1954 |
| 284207 | METRNL | HTA11_2112_2000001011 | Human | Colorectum | SER | 1.30e-03 | 5.22e-01 | -0.2196 |
| 284207 | METRNL | HTA11_696_2000001011 | Human | Colorectum | AD | 7.65e-12 | 2.98e-01 | -0.1464 |
| 284207 | METRNL | HTA11_866_2000001011 | Human | Colorectum | AD | 3.41e-06 | 1.38e-01 | -0.1001 |
| 284207 | METRNL | HTA11_1391_2000001011 | Human | Colorectum | AD | 1.54e-02 | 1.93e-01 | -0.059 |
| 284207 | METRNL | HTA11_5212_2000001011 | Human | Colorectum | AD | 1.41e-05 | 4.15e-01 | -0.2061 |
| 284207 | METRNL | HTA11_7696_3000711011 | Human | Colorectum | AD | 4.41e-05 | 1.61e-01 | 0.0674 |
| 284207 | METRNL | HTA11_99999970781_79442 | Human | Colorectum | MSS | 7.05e-03 | 9.31e-02 | 0.294 |
| 284207 | METRNL | HTA11_99999971662_82457 | Human | Colorectum | MSS | 1.11e-02 | 9.64e-02 | 0.3859 |
| 284207 | METRNL | GSM5252132_BPH389PrGF | Human | Prostate | BPH | 2.06e-12 | 6.31e-01 | -0.2247 |
| 284207 | METRNL | GSM5252133_BPH389PrSF | Human | Prostate | BPH | 3.32e-03 | 5.45e-01 | -0.2027 |
| 284207 | METRNL | GSM5252134_BPH511PrG_Fcol_3GEX | Human | Prostate | BPH | 2.06e-08 | 3.28e-01 | -0.1433 |
| 284207 | METRNL | GSM5252135_BPH511PrPUr_Fcol_3GEX | Human | Prostate | BPH | 8.39e-18 | 6.26e-01 | -0.1833 |
| 284207 | METRNL | GSM5252136_BPH556PrGA1_Fcol | Human | Prostate | BPH | 3.31e-14 | 4.49e-01 | -0.23 |
| 284207 | METRNL | GSM5252137_BPH556PrGA2_Fcol | Human | Prostate | BPH | 5.33e-15 | 5.89e-01 | -0.23 |
| 284207 | METRNL | Dong_P1 | Human | Prostate | Tumor | 1.47e-12 | 1.03e-01 | 0.035 |
| 284207 | METRNL | Dong_P5 | Human | Prostate | Tumor | 1.33e-03 | -1.87e-02 | 0.053 |
| 284207 | METRNL | male-WTA | Human | Thyroid | PTC | 4.77e-36 | 2.76e-01 | 0.1037 |
| Page: 1 2 |
| Tissue | Expression Dynamics | Abbreviation |
| Colorectum (GSE201348) |  | FAP: Familial adenomatous polyposis |
| CRC: Colorectal cancer | ||
| Colorectum (HTA11) |  | AD: Adenomas |
| SER: Sessile serrated lesions | ||
| MSI-H: Microsatellite-high colorectal cancer | ||
| MSS: Microsatellite stable colorectal cancer | ||
| Prostate | 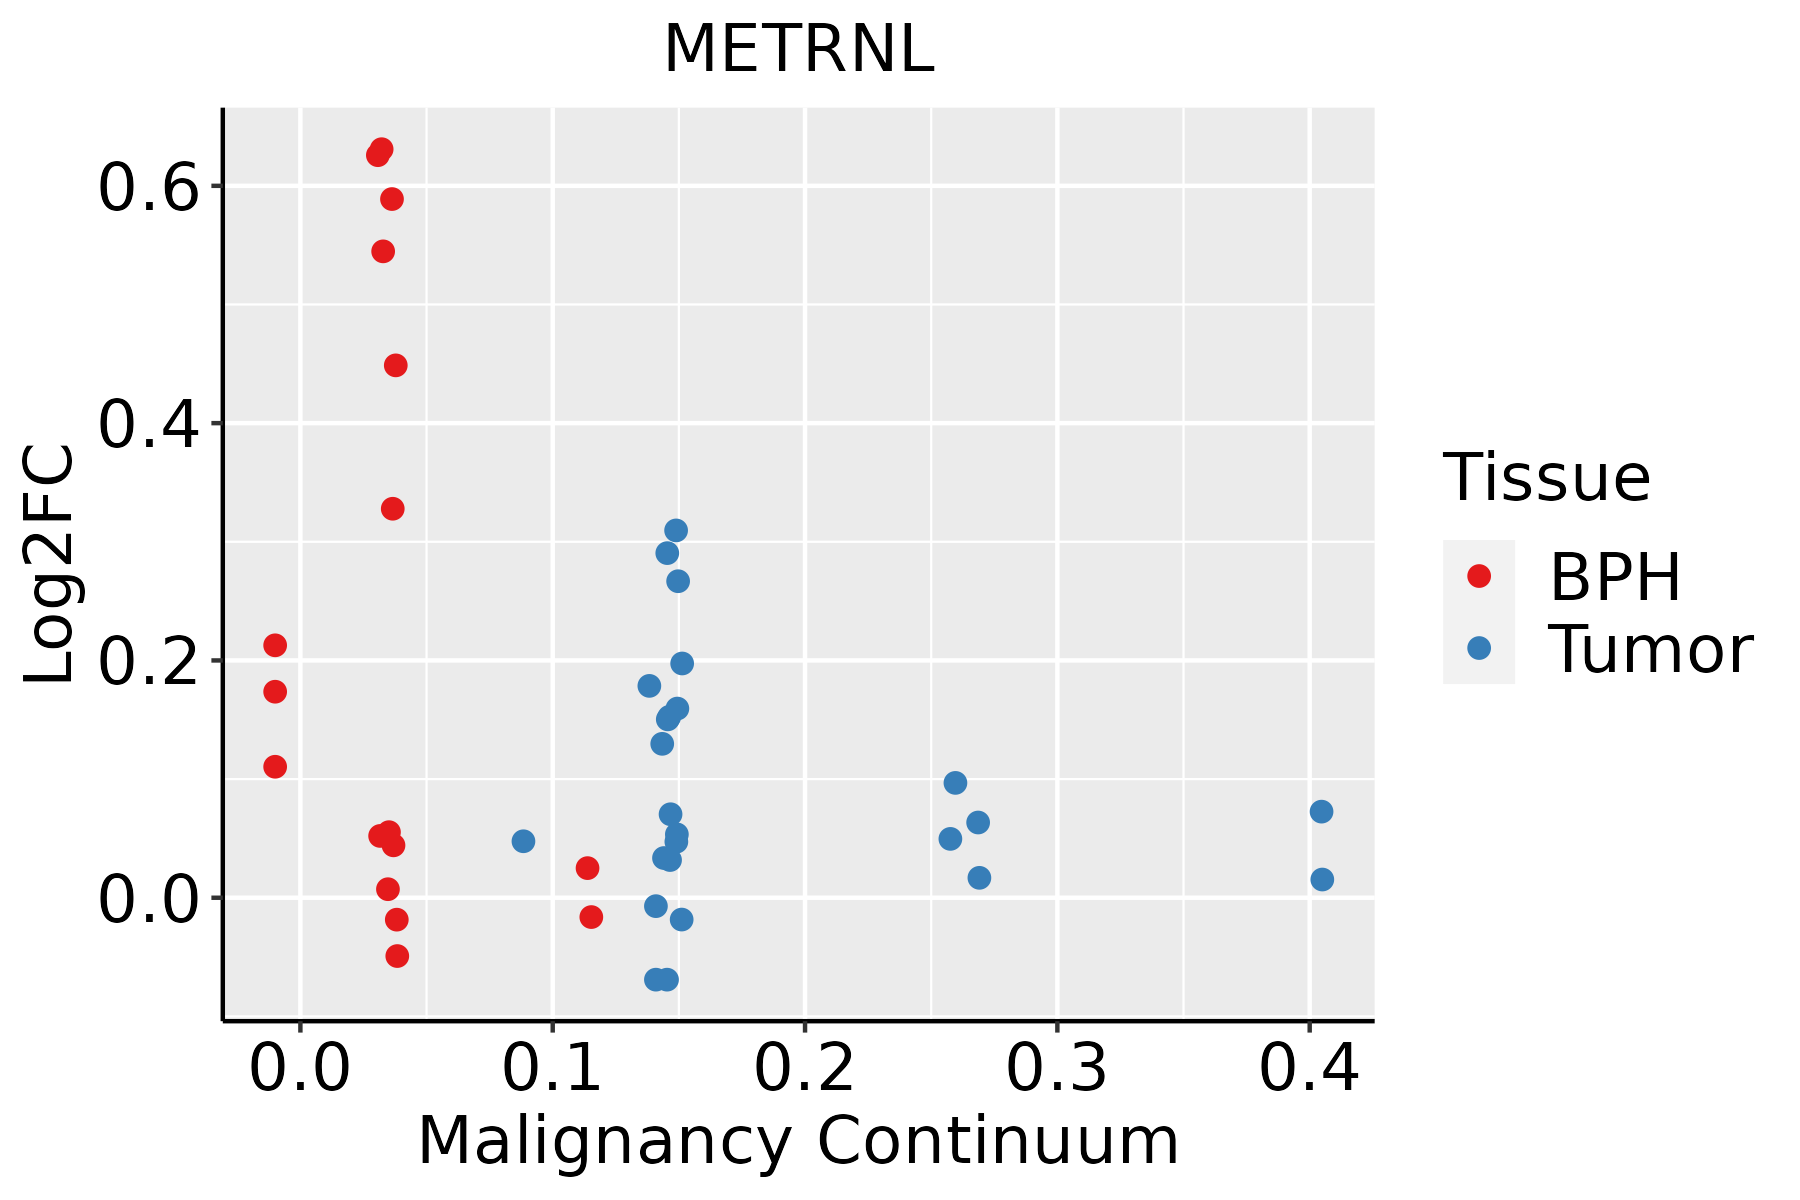 | BPH: Benign Prostatic Hyperplasia |
| Thyroid | 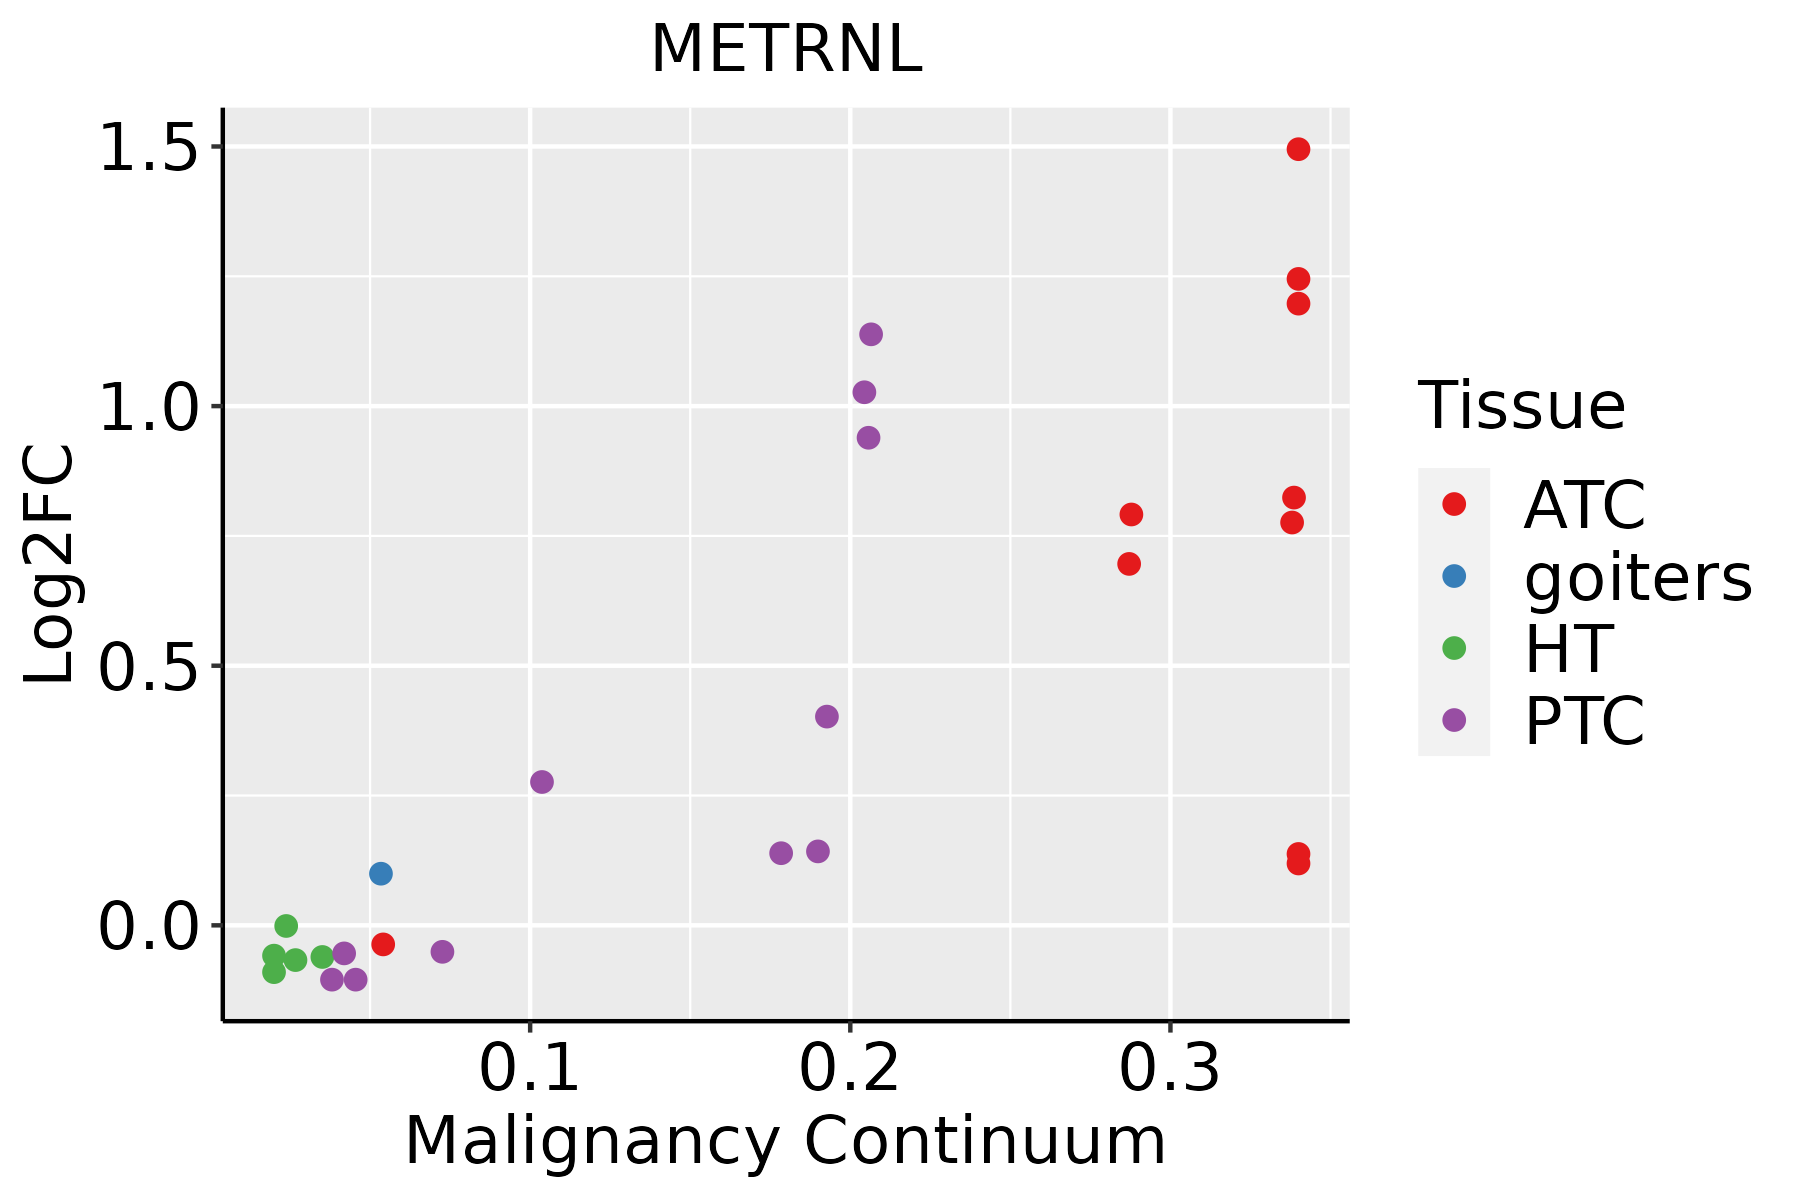 | ATC: Anaplastic thyroid cancer |
| HT: Hashimoto's thyroiditis | ||
| PTC: Papillary thyroid cancer |
| ∗log2FC in expression of this searched gene in stem-like cells from each diseased tissue sample relative to stem-like cells in normal samples in each tissue plotted against the malignancy continuum. Samples are colored based on if they are from different disease stage. |
Top |
Malignant transformation related pathway analysis |
| Find out the enriched GO biological processes and KEGG pathways involved in transition from healthy to precancer to cancer |
| Tissue | Disease Stage | Enriched GO biological Processes |
| Stomach | WIM |  |
| Stomach | SIM |  |
| Liver | NAFLD |  |
| Liver | Cirrhotic |  |
| Liver | HCC |  |
| ∗Top 15 enriched GO BP terms are showed in the bar plot of each disease state in each tissue. Each row represents a significant GO biological process which is colored according to the -log10(p.adjust). |
| Page: 1 2 3 4 5 6 7 8 9 |
| GO ID | Tissue | Disease Stage | Description | Gene Ratio | Bg Ratio | pvalue | p.adjust | Count |
| GO:0009409 | Colorectum | AD | response to cold | 22/3918 | 49/18723 | 1.40e-04 | 1.98e-03 | 22 |
| GO:00094091 | Colorectum | SER | response to cold | 16/2897 | 49/18723 | 2.11e-03 | 2.06e-02 | 16 |
| GO:0045444 | Colorectum | SER | fat cell differentiation | 51/2897 | 229/18723 | 3.96e-03 | 3.26e-02 | 51 |
| GO:0045600 | Colorectum | SER | positive regulation of fat cell differentiation | 19/2897 | 66/18723 | 4.29e-03 | 3.45e-02 | 19 |
| GO:00094092 | Colorectum | MSS | response to cold | 19/3467 | 49/18723 | 7.20e-04 | 7.70e-03 | 19 |
| GO:000926610 | Prostate | BPH | response to temperature stimulus | 56/3107 | 178/18723 | 6.74e-07 | 1.30e-05 | 56 |
| GO:00454447 | Prostate | BPH | fat cell differentiation | 59/3107 | 229/18723 | 2.60e-04 | 2.04e-03 | 59 |
| GO:00455982 | Prostate | BPH | regulation of fat cell differentiation | 36/3107 | 139/18723 | 3.43e-03 | 1.76e-02 | 36 |
| GO:00456005 | Prostate | BPH | positive regulation of fat cell differentiation | 20/3107 | 66/18723 | 4.09e-03 | 2.03e-02 | 20 |
| GO:00148232 | Prostate | BPH | response to activity | 21/3107 | 76/18723 | 1.05e-02 | 4.39e-02 | 21 |
| GO:000926615 | Prostate | Tumor | response to temperature stimulus | 59/3246 | 178/18723 | 2.14e-07 | 5.21e-06 | 59 |
| GO:004544414 | Prostate | Tumor | fat cell differentiation | 69/3246 | 229/18723 | 1.22e-06 | 2.28e-05 | 69 |
| GO:004559811 | Prostate | Tumor | regulation of fat cell differentiation | 39/3246 | 139/18723 | 1.11e-03 | 7.12e-03 | 39 |
| GO:004560012 | Prostate | Tumor | positive regulation of fat cell differentiation | 22/3246 | 66/18723 | 1.21e-03 | 7.66e-03 | 22 |
| GO:00094099 | Prostate | Tumor | response to cold | 17/3246 | 49/18723 | 2.61e-03 | 1.43e-02 | 17 |
| GO:001482311 | Prostate | Tumor | response to activity | 22/3246 | 76/18723 | 8.37e-03 | 3.65e-02 | 22 |
| GO:004544418 | Thyroid | PTC | fat cell differentiation | 102/5968 | 229/18723 | 3.66e-05 | 3.40e-04 | 102 |
| GO:0009266111 | Thyroid | PTC | response to temperature stimulus | 81/5968 | 178/18723 | 9.20e-05 | 7.63e-04 | 81 |
| GO:004560015 | Thyroid | PTC | positive regulation of fat cell differentiation | 33/5968 | 66/18723 | 1.63e-03 | 9.01e-03 | 33 |
| GO:004559814 | Thyroid | PTC | regulation of fat cell differentiation | 59/5968 | 139/18723 | 5.50e-03 | 2.50e-02 | 59 |
| Page: 1 2 |
| Pathway ID | Tissue | Disease Stage | Description | Gene Ratio | Bg Ratio | pvalue | p.adjust | qvalue | Count |
| Page: 1 |
Top |
Cell-cell communication analysis |
| Identification of potential cell-cell interactions between two cell types and their ligand-receptor pairs for different disease states |
| Ligand | Receptor | LRpair | Pathway | Tissue | Disease Stage |
| Page: 1 |
Top |
Single-cell gene regulatory network inference analysis |
| Find out the significant the regulons (TFs) and the target genes of each regulon across cell types for different disease states |
| TF | Cell Type | Tissue | Disease Stage | Target Gene | RSS | Regulon Activity |
| ∗The dot plots of a searched regulon are shown for all cell subpopulations in each disease state of each tissue based on the regulon specific score inferred using pySCENIC and by calculating the average expression. |
| Page: 1 |
Top |
Somatic mutation of malignant transformation related genes |
| Annotation of somatic variants for genes involved in malignant transformation |
| Hugo Symbol | Variant Class | Variant Classification | dbSNP RS | HGVSc | HGVSp | HGVSp Short | SWISSPROT | BIOTYPE | SIFT | PolyPhen | Tumor Sample Barcode | Tissue | Histology | Sex | Age | Stage | Therapy Types | Drugs | Outcome |
| METRNL | SNV | Missense_Mutation | c.670N>A | p.Ala224Thr | p.A224T | Q641Q3 | protein_coding | tolerated(0.25) | benign(0.011) | TCGA-BH-A0HB-01 | Breast | breast invasive carcinoma | Female | <65 | I/II | Chemotherapy | docetaxel | SD | |
| METRNL | SNV | Missense_Mutation | rs199503836 | c.418C>T | p.Arg140Trp | p.R140W | Q641Q3 | protein_coding | deleterious(0) | possibly_damaging(0.648) | TCGA-BH-A6R9-01 | Breast | breast invasive carcinoma | Female | <65 | I/II | Unknown | Unknown | SD |
| METRNL | SNV | Missense_Mutation | rs141250936 | c.659N>A | p.Arg220Gln | p.R220Q | Q641Q3 | protein_coding | tolerated(0.95) | benign(0.001) | TCGA-2W-A8YY-01 | Cervix | cervical & endocervical cancer | Female | <65 | I/II | Chemotherapy | cisplatin | CR |
| METRNL | SNV | Missense_Mutation | rs776659125 | c.733G>A | p.Glu245Lys | p.E245K | Q641Q3 | protein_coding | tolerated(0.54) | benign(0.011) | TCGA-AA-3502-01 | Colorectum | colon adenocarcinoma | Male | >=65 | I/II | Unknown | Unknown | SD |
| METRNL | SNV | Missense_Mutation | c.407N>A | p.Gly136Asp | p.G136D | Q641Q3 | protein_coding | tolerated(0.62) | benign(0.013) | TCGA-AD-6964-01 | Colorectum | colon adenocarcinoma | Male | <65 | III/IV | Chemotherapy | folfox | PD | |
| METRNL | SNV | Missense_Mutation | rs770115888 | c.784N>A | p.Val262Met | p.V262M | Q641Q3 | protein_coding | deleterious(0) | probably_damaging(0.999) | TCGA-AZ-6601-01 | Colorectum | colon adenocarcinoma | Male | >=65 | I/II | Unknown | Unknown | PD |
| METRNL | SNV | Missense_Mutation | rs368186952 | c.832N>A | p.Gly278Arg | p.G278R | Q641Q3 | protein_coding | deleterious(0) | probably_damaging(1) | TCGA-CK-6746-01 | Colorectum | colon adenocarcinoma | Female | >=65 | I/II | Unknown | Unknown | SD |
| METRNL | SNV | Missense_Mutation | rs140067828 | c.533N>T | p.Ala178Val | p.A178V | Q641Q3 | protein_coding | tolerated(0.21) | benign(0.005) | TCGA-EI-6507-01 | Colorectum | rectum adenocarcinoma | Male | <65 | I/II | Unknown | Unknown | SD |
| METRNL | SNV | Missense_Mutation | novel | c.514N>A | p.Leu172Met | p.L172M | Q641Q3 | protein_coding | deleterious(0.01) | probably_damaging(0.984) | TCGA-F5-6814-01 | Colorectum | rectum adenocarcinoma | Male | <65 | I/II | Unknown | Unknown | SD |
| METRNL | deletion | Frame_Shift_Del | c.902delN | p.Leu303Ter | p.L303* | Q641Q3 | protein_coding | TCGA-AY-6197-01 | Colorectum | colon adenocarcinoma | Male | <65 | I/II | Unknown | Unknown | SD |
| Page: 1 2 3 |
Top |
Related drugs of malignant transformation related genes |
| Identification of chemicals and drugs interact with genes involved in malignant transfromation |
| (DGIdb 4.0) |
| Entrez ID | Symbol | Category | Interaction Types | Drug Claim Name | Drug Name | PMIDs |
| Page: 1 |

Copyright 2023-Present -The University of Texas Health Science Center at Houston |