
|
|||||
|
 | |
| |
| |
| |
| |
| |
|
Gene: MANEA |
Gene summary for MANEA |
| Gene information | Species | Human | Gene symbol | MANEA | Gene ID | 79694 |
| Gene name | mannosidase endo-alpha | |
| Gene Alias | ENDO | |
| Cytomap | 6q16.1 | |
| Gene Type | protein-coding | GO ID | GO:0000139 | UniProtAcc | Q5SRI9 |
Top |
Malignant transformation analysis |
| Identification of the aberrant gene expression in precancerous and cancerous lesions by comparing the gene expression of stem-like cells in diseased tissues with normal stem cells |
| Entrez ID | Symbol | Replicates | Species | Organ | Tissue | Adj P-value | Log2FC | Malignancy |
| 79694 | MANEA | HCC1_Meng | Human | Liver | HCC | 2.81e-47 | 1.25e-01 | 0.0246 |
| 79694 | MANEA | HCC2_Meng | Human | Liver | HCC | 9.16e-11 | 1.11e-01 | 0.0107 |
| 79694 | MANEA | HCC1 | Human | Liver | HCC | 2.77e-06 | 2.78e+00 | 0.5336 |
| 79694 | MANEA | HCC2 | Human | Liver | HCC | 2.29e-06 | 2.01e+00 | 0.5341 |
| 79694 | MANEA | S014 | Human | Liver | HCC | 2.91e-15 | 4.84e-01 | 0.2254 |
| 79694 | MANEA | S015 | Human | Liver | HCC | 6.29e-14 | 6.27e-01 | 0.2375 |
| 79694 | MANEA | S016 | Human | Liver | HCC | 6.57e-27 | 7.00e-01 | 0.2243 |
| 79694 | MANEA | S027 | Human | Liver | HCC | 7.08e-05 | 5.27e-01 | 0.2446 |
| 79694 | MANEA | S028 | Human | Liver | HCC | 1.98e-14 | 4.66e-01 | 0.2503 |
| 79694 | MANEA | S029 | Human | Liver | HCC | 1.72e-14 | 5.16e-01 | 0.2581 |
| Page: 1 |
| Tissue | Expression Dynamics | Abbreviation |
| Liver | 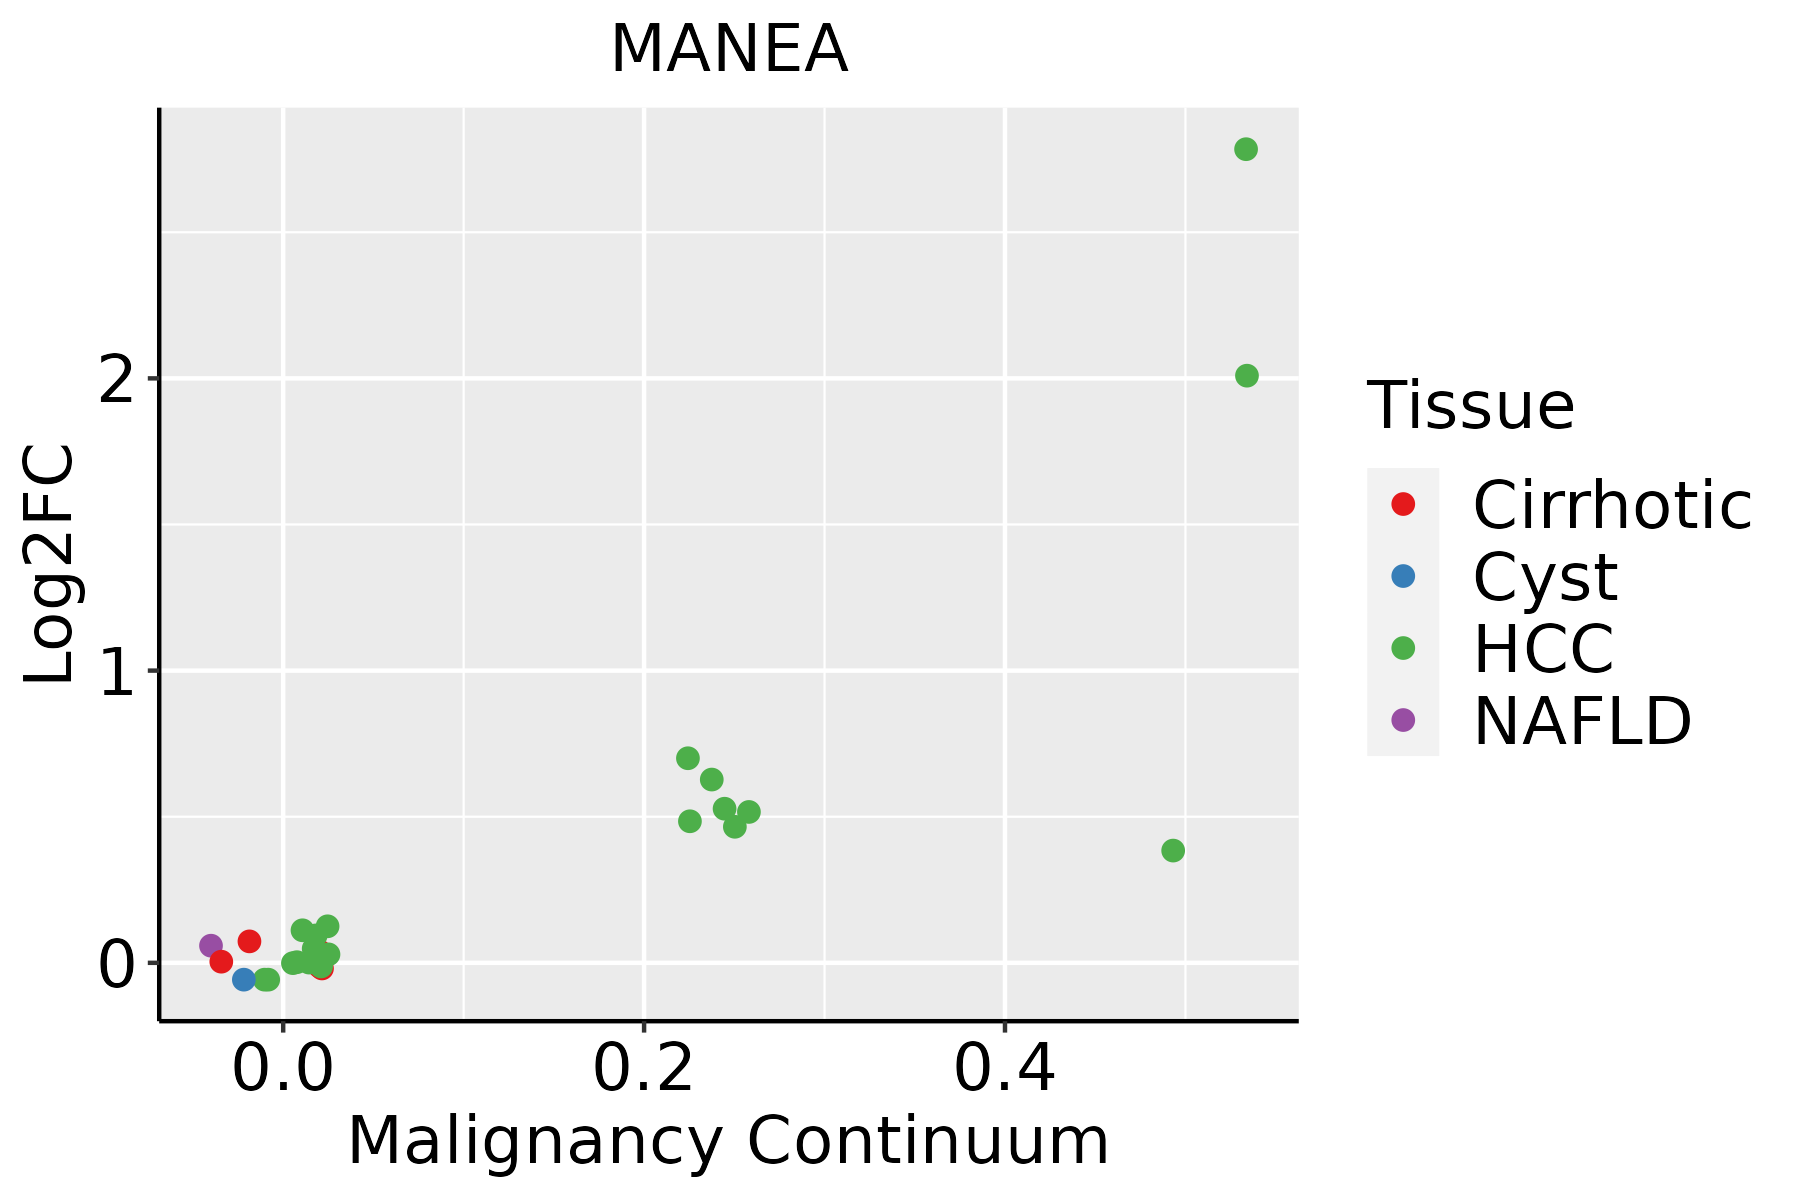 | HCC: Hepatocellular carcinoma |
| NAFLD: Non-alcoholic fatty liver disease | ||
| Prostate | 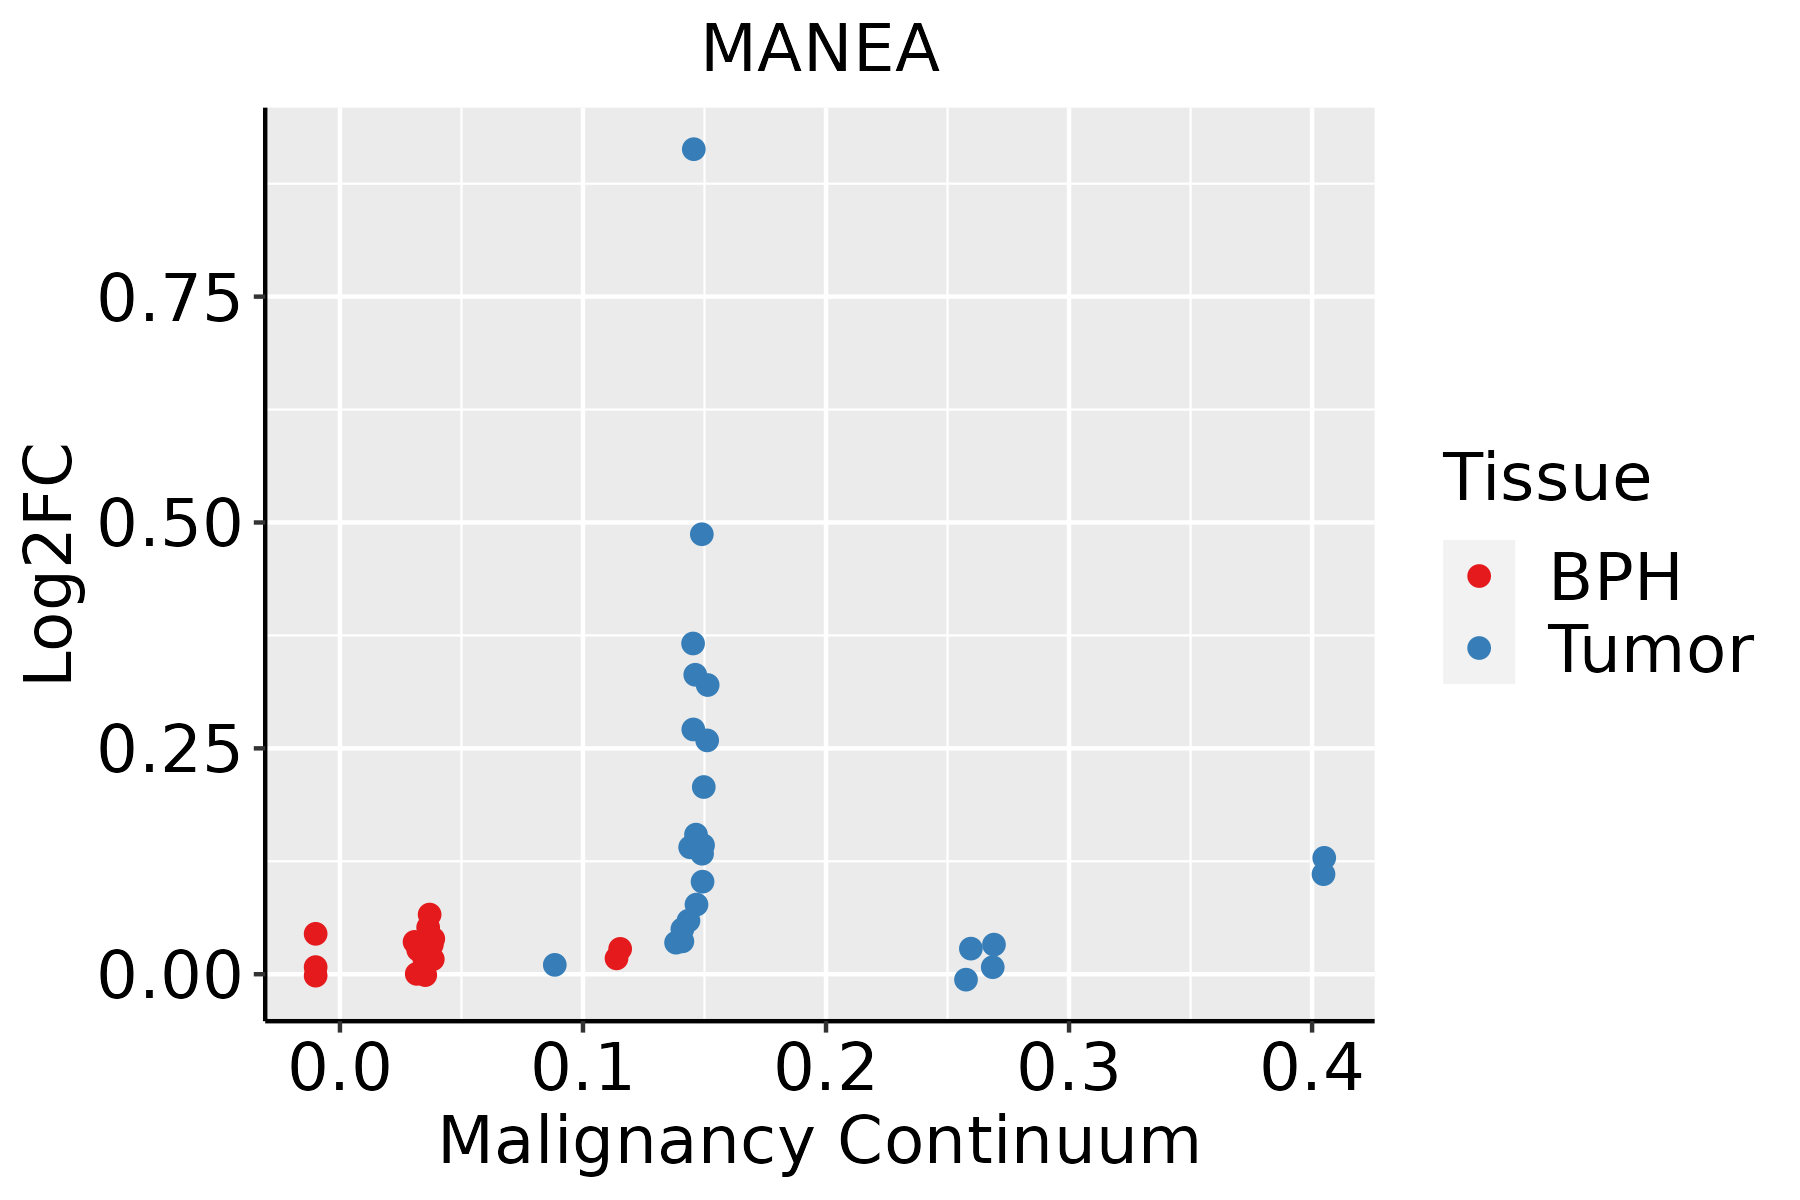 | BPH: Benign Prostatic Hyperplasia |
| ∗log2FC in expression of this searched gene in stem-like cells from each diseased tissue sample relative to stem-like cells in normal samples in each tissue plotted against the malignancy continuum. Samples are colored based on if they are from different disease stage. |
Top |
Malignant transformation related pathway analysis |
| Find out the enriched GO biological processes and KEGG pathways involved in transition from healthy to precancer to cancer |
| Tissue | Disease Stage | Enriched GO biological Processes |
| Stomach | WIM |  |
| Stomach | SIM |  |
| Liver | NAFLD |  |
| Liver | Cirrhotic |  |
| Liver | HCC |  |
| ∗Top 15 enriched GO BP terms are showed in the bar plot of each disease state in each tissue. Each row represents a significant GO biological process which is colored according to the -log10(p.adjust). |
| Page: 1 2 3 4 5 6 7 8 9 |
| GO ID | Tissue | Disease Stage | Description | Gene Ratio | Bg Ratio | pvalue | p.adjust | Count |
| Page: 1 |
| Pathway ID | Tissue | Disease Stage | Description | Gene Ratio | Bg Ratio | pvalue | p.adjust | qvalue | Count |
| Page: 1 |
Top |
Cell-cell communication analysis |
| Identification of potential cell-cell interactions between two cell types and their ligand-receptor pairs for different disease states |
| Ligand | Receptor | LRpair | Pathway | Tissue | Disease Stage |
| Page: 1 |
Top |
Single-cell gene regulatory network inference analysis |
| Find out the significant the regulons (TFs) and the target genes of each regulon across cell types for different disease states |
| TF | Cell Type | Tissue | Disease Stage | Target Gene | RSS | Regulon Activity |
| ∗The dot plots of a searched regulon are shown for all cell subpopulations in each disease state of each tissue based on the regulon specific score inferred using pySCENIC and by calculating the average expression. |
| Page: 1 |
Top |
Somatic mutation of malignant transformation related genes |
| Annotation of somatic variants for genes involved in malignant transformation |
| Hugo Symbol | Variant Class | Variant Classification | dbSNP RS | HGVSc | HGVSp | HGVSp Short | SWISSPROT | BIOTYPE | SIFT | PolyPhen | Tumor Sample Barcode | Tissue | Histology | Sex | Age | Stage | Therapy Types | Drugs | Outcome |
| MANEA | SNV | Missense_Mutation | rs772610838 | c.1165N>A | p.Ala389Thr | p.A389T | Q5SRI9 | protein_coding | deleterious(0.01) | probably_damaging(0.998) | TCGA-A8-A076-01 | Breast | breast invasive carcinoma | Female | >=65 | I/II | Hormone Therapy | anastrozole | SD |
| MANEA | SNV | Missense_Mutation | c.782C>T | p.Ala261Val | p.A261V | Q5SRI9 | protein_coding | tolerated(0.54) | benign(0) | TCGA-AR-A24Z-01 | Breast | breast invasive carcinoma | Female | <65 | I/II | Chemotherapy | doxorubicin | SD | |
| MANEA | SNV | Missense_Mutation | novel | c.452N>T | p.Gly151Val | p.G151V | Q5SRI9 | protein_coding | deleterious(0) | probably_damaging(0.963) | TCGA-S3-AA10-01 | Breast | breast invasive carcinoma | Female | >=65 | I/II | Chemotherapy | cytoxan | CR |
| MANEA | insertion | Nonsense_Mutation | novel | c.541_542insAATAG | p.Ile181LysfsTer2 | p.I181Kfs*2 | Q5SRI9 | protein_coding | TCGA-A8-A097-01 | Breast | breast invasive carcinoma | Female | >=65 | I/II | Hormone Therapy | tamoxiphen | SD | ||
| MANEA | insertion | Nonsense_Mutation | novel | c.541_542insAATAG | p.Ile181LysfsTer2 | p.I181Kfs*2 | Q5SRI9 | protein_coding | TCGA-AQ-A04H-01 | Breast | breast invasive carcinoma | Female | <65 | III/IV | Chemotherapy | taxotere | SD | ||
| MANEA | SNV | Missense_Mutation | c.208N>A | p.Glu70Lys | p.E70K | Q5SRI9 | protein_coding | tolerated(0.77) | benign(0.048) | TCGA-HM-A4S6-01 | Cervix | cervical & endocervical cancer | Female | <65 | III/IV | Chemotherapy | cisplatin | CR | |
| MANEA | SNV | Missense_Mutation | novel | c.742N>T | p.His248Tyr | p.H248Y | Q5SRI9 | protein_coding | deleterious(0.02) | probably_damaging(0.998) | TCGA-MY-A913-01 | Cervix | cervical & endocervical cancer | Female | <65 | I/II | Chemotherapy | cisplatin | CR |
| MANEA | SNV | Missense_Mutation | c.79N>C | p.Lys27Gln | p.K27Q | Q5SRI9 | protein_coding | deleterious(0.01) | probably_damaging(0.986) | TCGA-AA-3510-01 | Colorectum | colon adenocarcinoma | Male | >=65 | I/II | Unknown | Unknown | SD | |
| MANEA | SNV | Missense_Mutation | novel | c.54N>G | p.Phe18Leu | p.F18L | Q5SRI9 | protein_coding | tolerated(0.38) | benign(0) | TCGA-AA-3984-01 | Colorectum | colon adenocarcinoma | Female | <65 | I/II | Unknown | Unknown | SD |
| MANEA | SNV | Missense_Mutation | novel | c.528N>A | p.Met176Ile | p.M176I | Q5SRI9 | protein_coding | tolerated(0.92) | benign(0.001) | TCGA-AY-6197-01 | Colorectum | colon adenocarcinoma | Male | <65 | I/II | Unknown | Unknown | SD |
| Page: 1 2 3 4 5 6 7 8 |
Top |
Related drugs of malignant transformation related genes |
| Identification of chemicals and drugs interact with genes involved in malignant transfromation |
| (DGIdb 4.0) |
| Entrez ID | Symbol | Category | Interaction Types | Drug Claim Name | Drug Name | PMIDs |
| Page: 1 |

Copyright 2023-Present -The University of Texas Health Science Center at Houston |