
|
|||||
|
 | |
| |
| |
| |
| |
| |
|
Gene: HDGFL2 |
Gene summary for HDGFL2 |
| Gene information | Species | Human | Gene symbol | HDGFL2 | Gene ID | 84717 |
| Gene name | HDGF like 2 | |
| Gene Alias | HDGF-2 | |
| Cytomap | 19p13.3 | |
| Gene Type | protein-coding | GO ID | GO:0001558 | UniProtAcc | Q7Z4V5 |
Top |
Malignant transformation analysis |
| Identification of the aberrant gene expression in precancerous and cancerous lesions by comparing the gene expression of stem-like cells in diseased tissues with normal stem cells |
| Entrez ID | Symbol | Replicates | Species | Organ | Tissue | Adj P-value | Log2FC | Malignancy |
| 84717 | HDGFL2 | S014 | Human | Liver | HCC | 6.64e-15 | 5.35e-01 | 0.2254 |
| 84717 | HDGFL2 | S015 | Human | Liver | HCC | 2.08e-07 | 3.84e-01 | 0.2375 |
| 84717 | HDGFL2 | S016 | Human | Liver | HCC | 3.78e-12 | 3.82e-01 | 0.2243 |
| 84717 | HDGFL2 | S027 | Human | Liver | HCC | 4.81e-11 | 7.71e-01 | 0.2446 |
| 84717 | HDGFL2 | S028 | Human | Liver | HCC | 9.05e-23 | 7.26e-01 | 0.2503 |
| 84717 | HDGFL2 | S029 | Human | Liver | HCC | 7.52e-18 | 6.46e-01 | 0.2581 |
| 84717 | HDGFL2 | male-WTA | Human | Thyroid | PTC | 5.88e-09 | 1.61e-01 | 0.1037 |
| 84717 | HDGFL2 | PTC01 | Human | Thyroid | PTC | 2.61e-10 | 2.26e-01 | 0.1899 |
| 84717 | HDGFL2 | PTC04 | Human | Thyroid | PTC | 5.71e-10 | 2.15e-01 | 0.1927 |
| 84717 | HDGFL2 | PTC05 | Human | Thyroid | PTC | 6.73e-21 | 6.17e-01 | 0.2065 |
| 84717 | HDGFL2 | PTC06 | Human | Thyroid | PTC | 6.91e-41 | 8.47e-01 | 0.2057 |
| 84717 | HDGFL2 | PTC07 | Human | Thyroid | PTC | 4.37e-34 | 6.15e-01 | 0.2044 |
| 84717 | HDGFL2 | ATC09 | Human | Thyroid | ATC | 2.42e-11 | 4.03e-01 | 0.2871 |
| 84717 | HDGFL2 | ATC11 | Human | Thyroid | ATC | 5.35e-04 | 4.72e-01 | 0.3386 |
| 84717 | HDGFL2 | ATC12 | Human | Thyroid | ATC | 5.71e-10 | 2.25e-01 | 0.34 |
| 84717 | HDGFL2 | ATC13 | Human | Thyroid | ATC | 4.07e-52 | 9.87e-01 | 0.34 |
| 84717 | HDGFL2 | ATC1 | Human | Thyroid | ATC | 1.33e-13 | 5.16e-01 | 0.2878 |
| 84717 | HDGFL2 | ATC2 | Human | Thyroid | ATC | 3.39e-19 | 1.20e+00 | 0.34 |
| 84717 | HDGFL2 | ATC3 | Human | Thyroid | ATC | 6.22e-03 | 2.95e-01 | 0.338 |
| 84717 | HDGFL2 | ATC4 | Human | Thyroid | ATC | 6.15e-14 | 3.08e-01 | 0.34 |
| Page: 1 2 |
| Tissue | Expression Dynamics | Abbreviation |
| Liver | 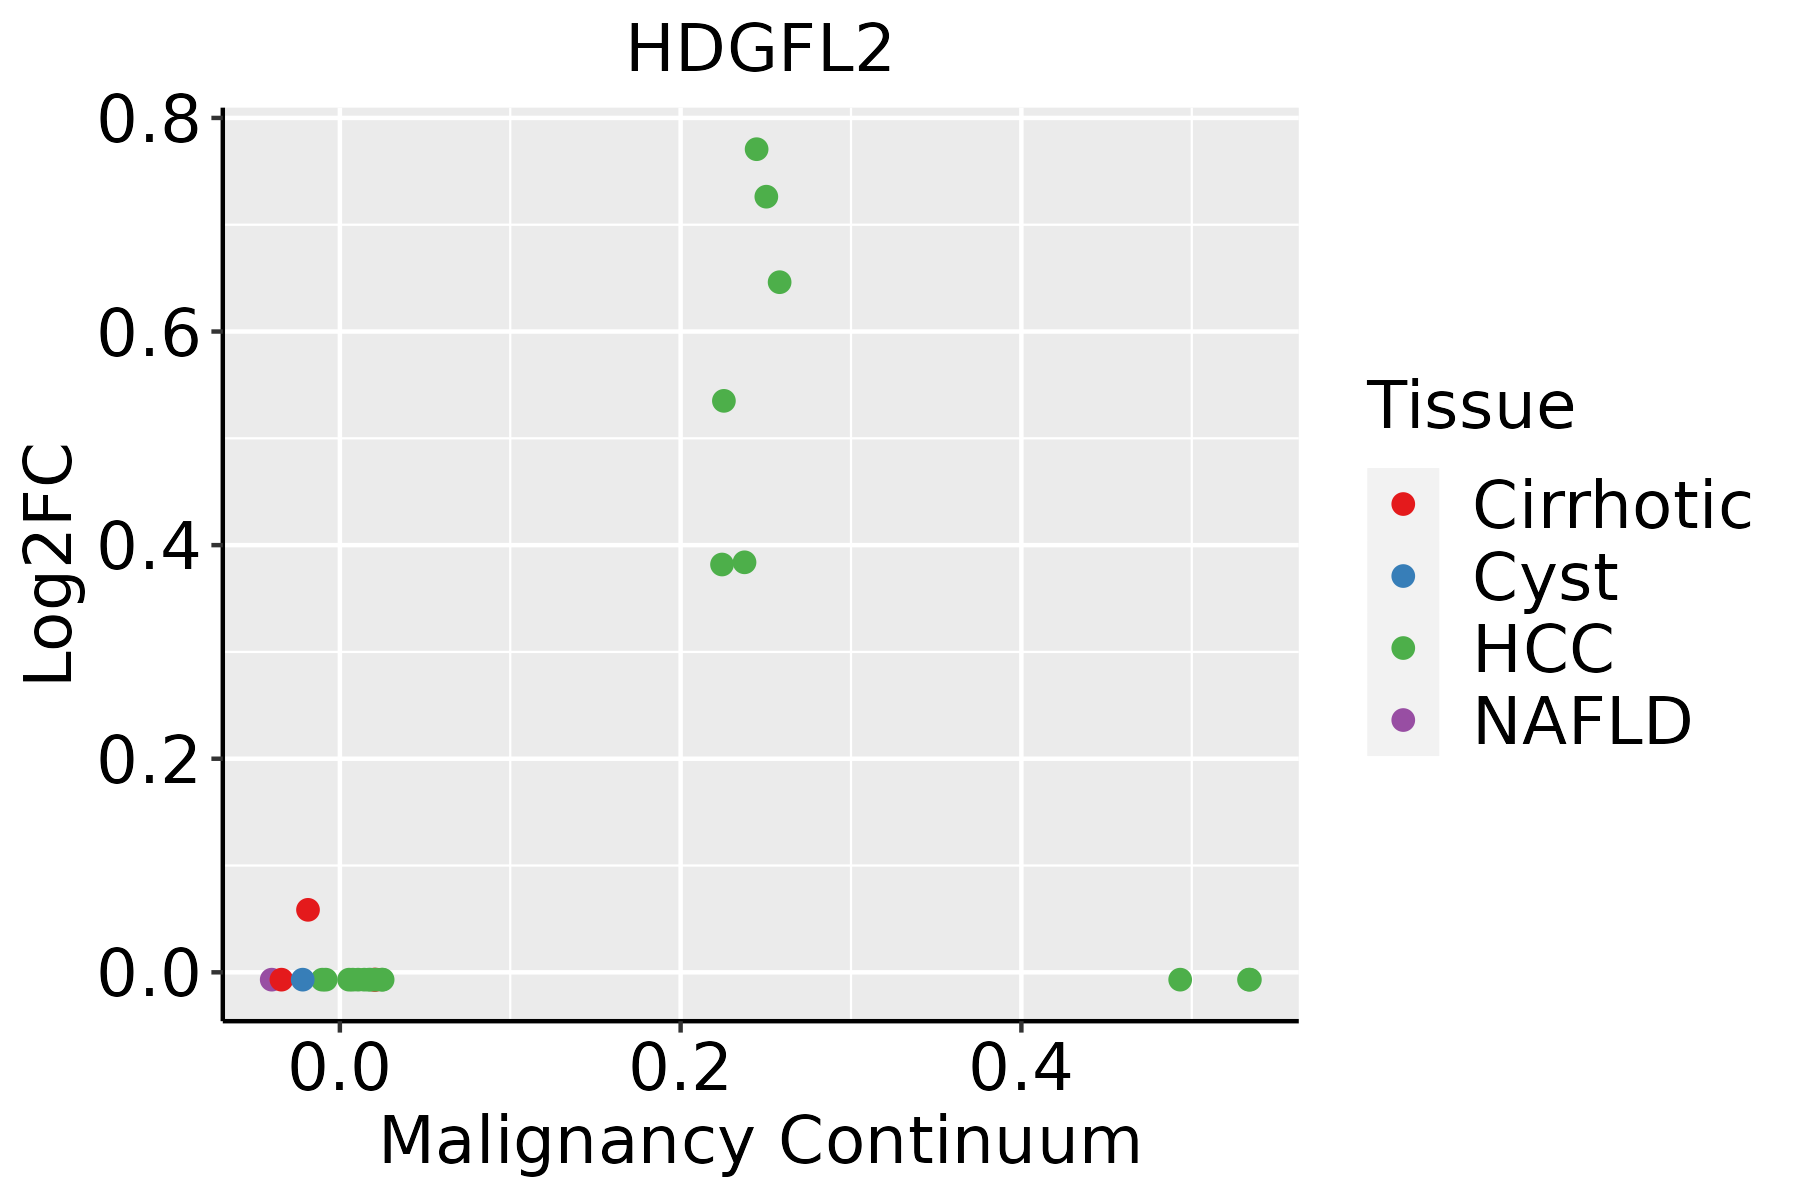 | HCC: Hepatocellular carcinoma |
| NAFLD: Non-alcoholic fatty liver disease | ||
| Thyroid | 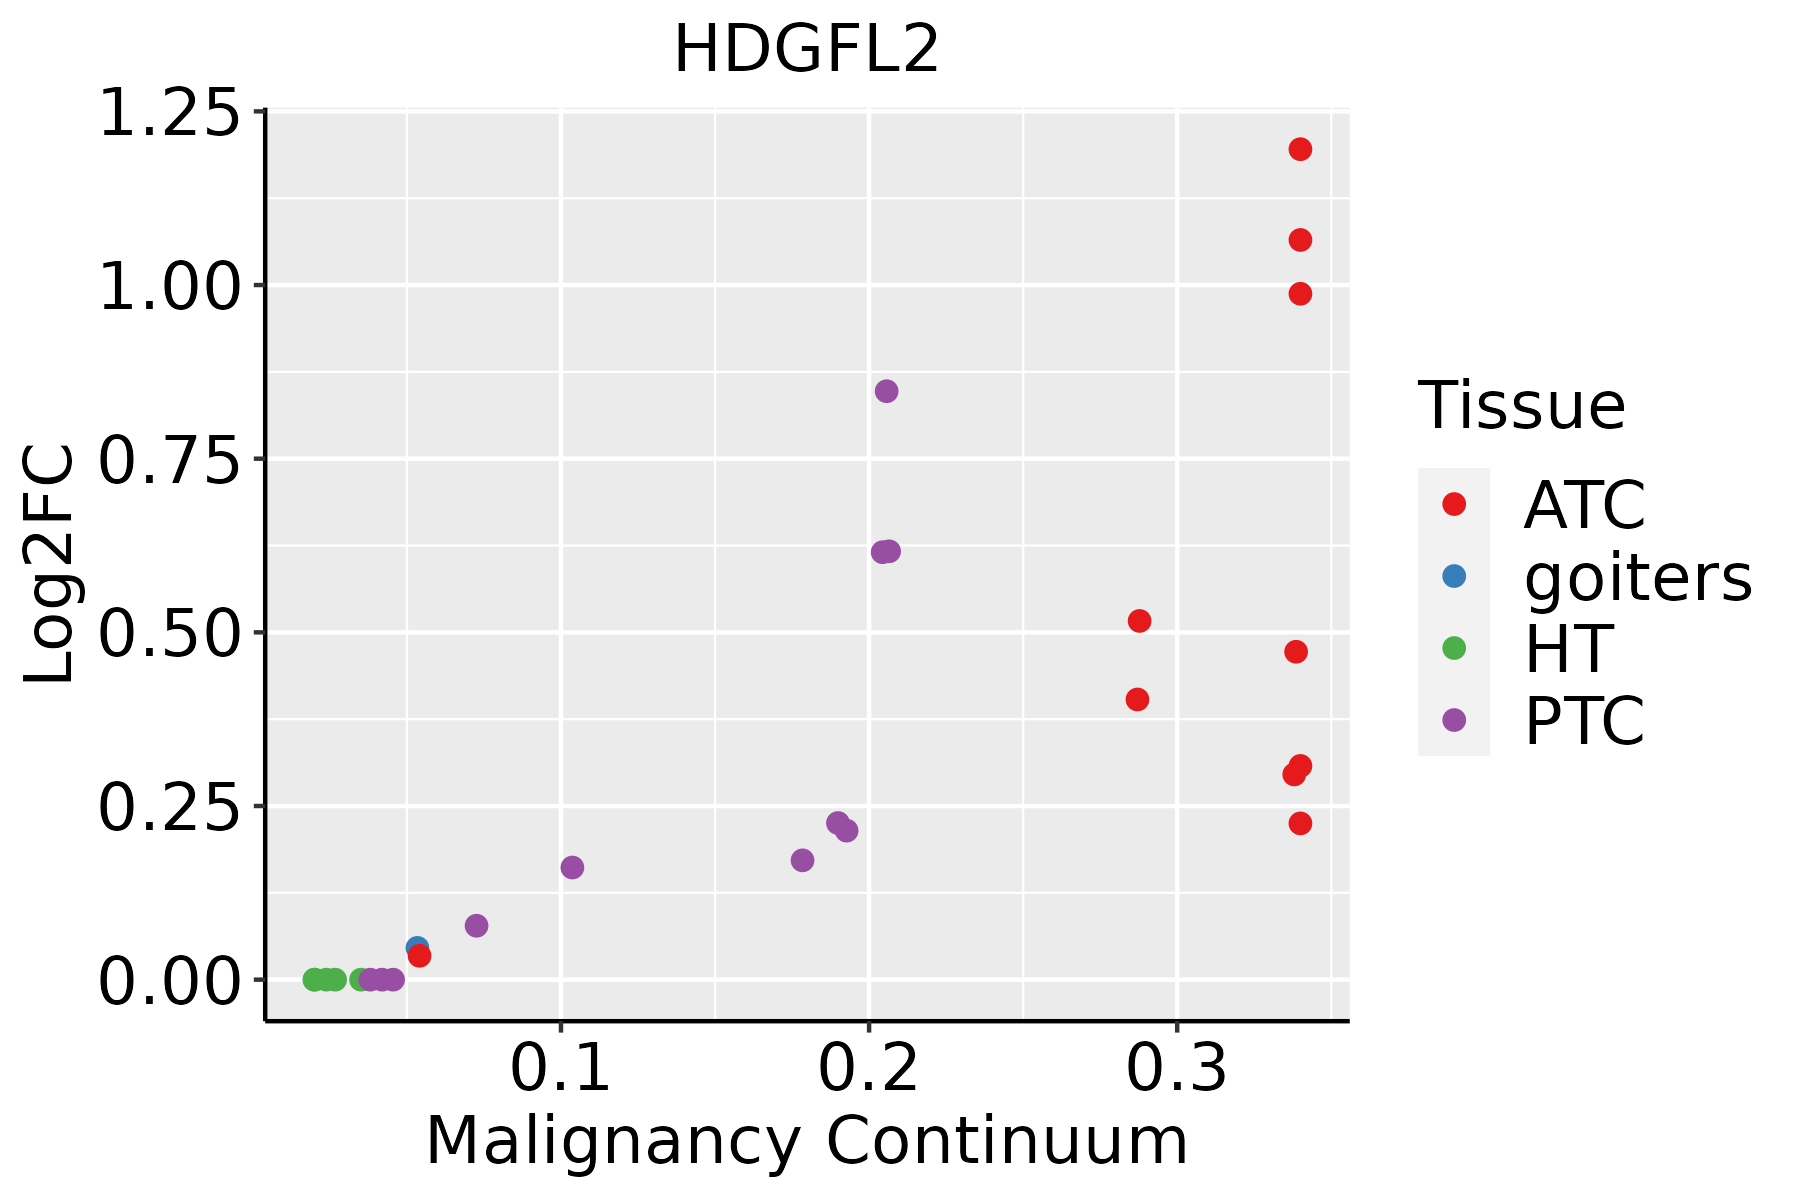 | ATC: Anaplastic thyroid cancer |
| HT: Hashimoto's thyroiditis | ||
| PTC: Papillary thyroid cancer |
| ∗log2FC in expression of this searched gene in stem-like cells from each diseased tissue sample relative to stem-like cells in normal samples in each tissue plotted against the malignancy continuum. Samples are colored based on if they are from different disease stage. |
Top |
Malignant transformation related pathway analysis |
| Find out the enriched GO biological processes and KEGG pathways involved in transition from healthy to precancer to cancer |
| Tissue | Disease Stage | Enriched GO biological Processes |
| Stomach | WIM |  |
| Stomach | SIM |  |
| Liver | NAFLD |  |
| Liver | Cirrhotic |  |
| Liver | HCC |  |
| ∗Top 15 enriched GO BP terms are showed in the bar plot of each disease state in each tissue. Each row represents a significant GO biological process which is colored according to the -log10(p.adjust). |
| Page: 1 2 3 4 5 6 7 8 9 |
| GO ID | Tissue | Disease Stage | Description | Gene Ratio | Bg Ratio | pvalue | p.adjust | Count |
| GO:001604921 | Liver | HCC | cell growth | 269/7958 | 482/18723 | 1.84e-09 | 5.35e-08 | 269 |
| GO:000155821 | Liver | HCC | regulation of cell growth | 228/7958 | 414/18723 | 1.34e-07 | 2.55e-06 | 228 |
| GO:003030711 | Liver | HCC | positive regulation of cell growth | 88/7958 | 166/18723 | 3.95e-03 | 1.74e-02 | 88 |
| GO:004592711 | Liver | HCC | positive regulation of growth | 128/7958 | 259/18723 | 1.41e-02 | 4.99e-02 | 128 |
| GO:0016049112 | Thyroid | PTC | cell growth | 225/5968 | 482/18723 | 4.75e-12 | 2.07e-10 | 225 |
| GO:0001558111 | Thyroid | PTC | regulation of cell growth | 188/5968 | 414/18723 | 4.13e-09 | 1.09e-07 | 188 |
| GO:003030718 | Thyroid | PTC | positive regulation of cell growth | 71/5968 | 166/18723 | 1.98e-03 | 1.06e-02 | 71 |
| GO:001604927 | Thyroid | ATC | cell growth | 241/6293 | 482/18723 | 4.27e-14 | 2.35e-12 | 241 |
| GO:000155826 | Thyroid | ATC | regulation of cell growth | 201/6293 | 414/18723 | 1.57e-10 | 4.76e-09 | 201 |
| GO:003030719 | Thyroid | ATC | positive regulation of cell growth | 74/6293 | 166/18723 | 2.06e-03 | 9.73e-03 | 74 |
| GO:004592720 | Thyroid | ATC | positive regulation of growth | 106/6293 | 259/18723 | 7.90e-03 | 3.06e-02 | 106 |
| Page: 1 |
| Pathway ID | Tissue | Disease Stage | Description | Gene Ratio | Bg Ratio | pvalue | p.adjust | qvalue | Count |
| Page: 1 |
Top |
Cell-cell communication analysis |
| Identification of potential cell-cell interactions between two cell types and their ligand-receptor pairs for different disease states |
| Ligand | Receptor | LRpair | Pathway | Tissue | Disease Stage |
| Page: 1 |
Top |
Single-cell gene regulatory network inference analysis |
| Find out the significant the regulons (TFs) and the target genes of each regulon across cell types for different disease states |
| TF | Cell Type | Tissue | Disease Stage | Target Gene | RSS | Regulon Activity |
| ∗The dot plots of a searched regulon are shown for all cell subpopulations in each disease state of each tissue based on the regulon specific score inferred using pySCENIC and by calculating the average expression. |
| Page: 1 |
Top |
Somatic mutation of malignant transformation related genes |
| Annotation of somatic variants for genes involved in malignant transformation |
| Hugo Symbol | Variant Class | Variant Classification | dbSNP RS | HGVSc | HGVSp | HGVSp Short | SWISSPROT | BIOTYPE | SIFT | PolyPhen | Tumor Sample Barcode | Tissue | Histology | Sex | Age | Stage | Therapy Types | Drugs | Outcome |
| Page: 1 |
Top |
Related drugs of malignant transformation related genes |
| Identification of chemicals and drugs interact with genes involved in malignant transfromation |
| (DGIdb 4.0) |
| Entrez ID | Symbol | Category | Interaction Types | Drug Claim Name | Drug Name | PMIDs |
| Page: 1 |

Copyright 2023-Present -The University of Texas Health Science Center at Houston |