
|
|||||
|
 | |
| |
| |
| |
| |
| |
|
Gene: FHOD3 |
Gene summary for FHOD3 |
| Gene information | Species | Human | Gene symbol | FHOD3 | Gene ID | 80206 |
| Gene name | formin homology 2 domain containing 3 | |
| Gene Alias | CMH28 | |
| Cytomap | 18q12.2 | |
| Gene Type | protein-coding | GO ID | GO:0006996 | UniProtAcc | Q2V2M9 |
Top |
Malignant transformation analysis |
| Identification of the aberrant gene expression in precancerous and cancerous lesions by comparing the gene expression of stem-like cells in diseased tissues with normal stem cells |
| Entrez ID | Symbol | Replicates | Species | Organ | Tissue | Adj P-value | Log2FC | Malignancy |
| 80206 | FHOD3 | P2T-E | Human | Esophagus | ESCC | 7.11e-18 | 3.33e-01 | 0.1177 |
| 80206 | FHOD3 | P5T-E | Human | Esophagus | ESCC | 1.52e-12 | 2.12e-01 | 0.1327 |
| 80206 | FHOD3 | P10T-E | Human | Esophagus | ESCC | 2.81e-32 | 6.67e-01 | 0.116 |
| 80206 | FHOD3 | P11T-E | Human | Esophagus | ESCC | 1.06e-06 | 4.77e-01 | 0.1426 |
| 80206 | FHOD3 | P12T-E | Human | Esophagus | ESCC | 3.14e-07 | 2.81e-01 | 0.1122 |
| 80206 | FHOD3 | P16T-E | Human | Esophagus | ESCC | 4.90e-04 | 7.08e-02 | 0.1153 |
| 80206 | FHOD3 | P22T-E | Human | Esophagus | ESCC | 7.56e-15 | 2.16e-01 | 0.1236 |
| 80206 | FHOD3 | P23T-E | Human | Esophagus | ESCC | 8.96e-06 | 1.91e-01 | 0.108 |
| 80206 | FHOD3 | P24T-E | Human | Esophagus | ESCC | 2.24e-08 | 2.77e-01 | 0.1287 |
| 80206 | FHOD3 | P32T-E | Human | Esophagus | ESCC | 1.19e-05 | 1.99e-01 | 0.1666 |
| 80206 | FHOD3 | P36T-E | Human | Esophagus | ESCC | 5.20e-14 | 6.02e-01 | 0.1187 |
| 80206 | FHOD3 | P37T-E | Human | Esophagus | ESCC | 1.59e-23 | 4.57e-01 | 0.1371 |
| 80206 | FHOD3 | P44T-E | Human | Esophagus | ESCC | 1.26e-06 | 2.03e-01 | 0.1096 |
| 80206 | FHOD3 | P47T-E | Human | Esophagus | ESCC | 8.24e-06 | 2.26e-01 | 0.1067 |
| 80206 | FHOD3 | P52T-E | Human | Esophagus | ESCC | 2.17e-08 | 2.87e-01 | 0.1555 |
| 80206 | FHOD3 | P61T-E | Human | Esophagus | ESCC | 9.06e-05 | 1.35e-01 | 0.099 |
| 80206 | FHOD3 | P62T-E | Human | Esophagus | ESCC | 1.20e-10 | 3.18e-01 | 0.1302 |
| 80206 | FHOD3 | P74T-E | Human | Esophagus | ESCC | 1.56e-05 | 2.39e-01 | 0.1479 |
| 80206 | FHOD3 | P75T-E | Human | Esophagus | ESCC | 1.33e-03 | 1.82e-01 | 0.1125 |
| 80206 | FHOD3 | P76T-E | Human | Esophagus | ESCC | 3.41e-04 | 1.81e-01 | 0.1207 |
| Page: 1 2 |
| Tissue | Expression Dynamics | Abbreviation |
| Esophagus | 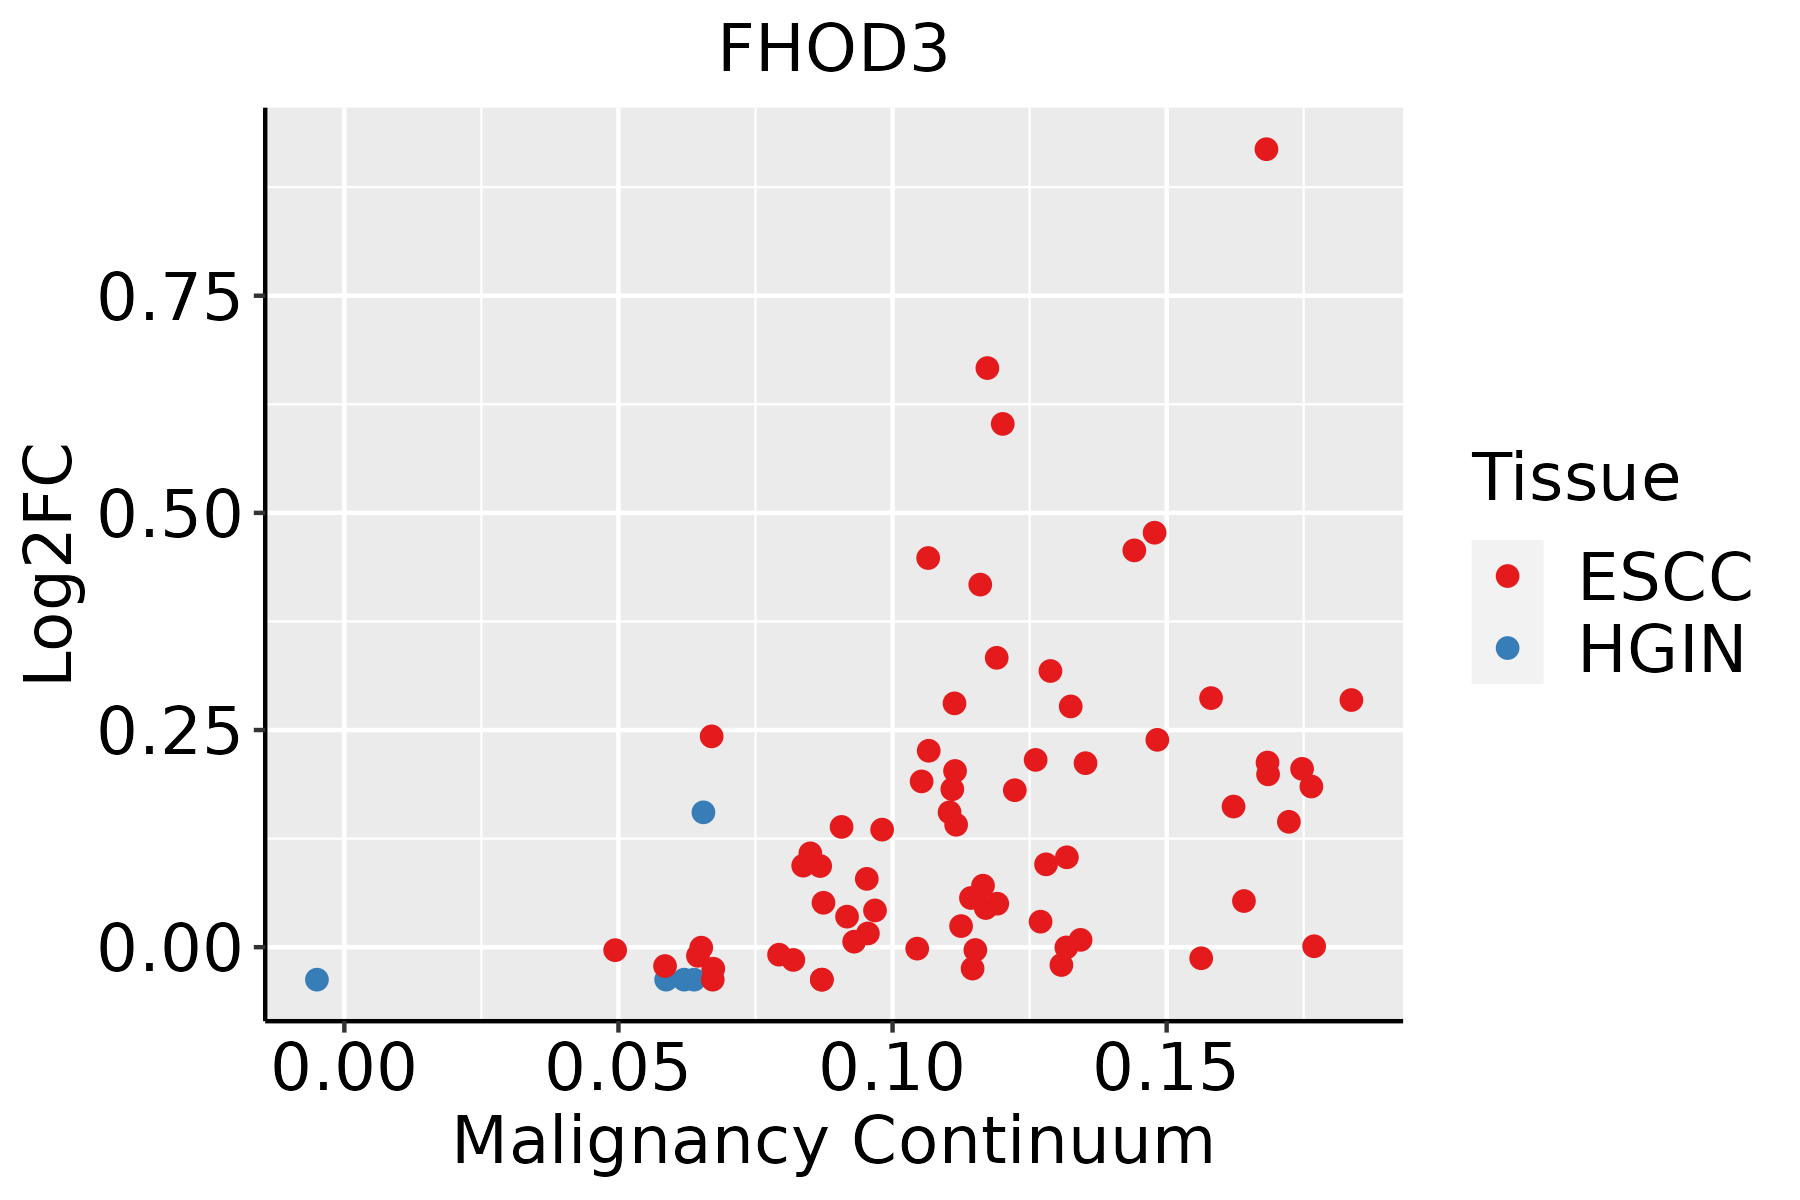 | ESCC: Esophageal squamous cell carcinoma |
| HGIN: High-grade intraepithelial neoplasias | ||
| LGIN: Low-grade intraepithelial neoplasias | ||
| Thyroid | 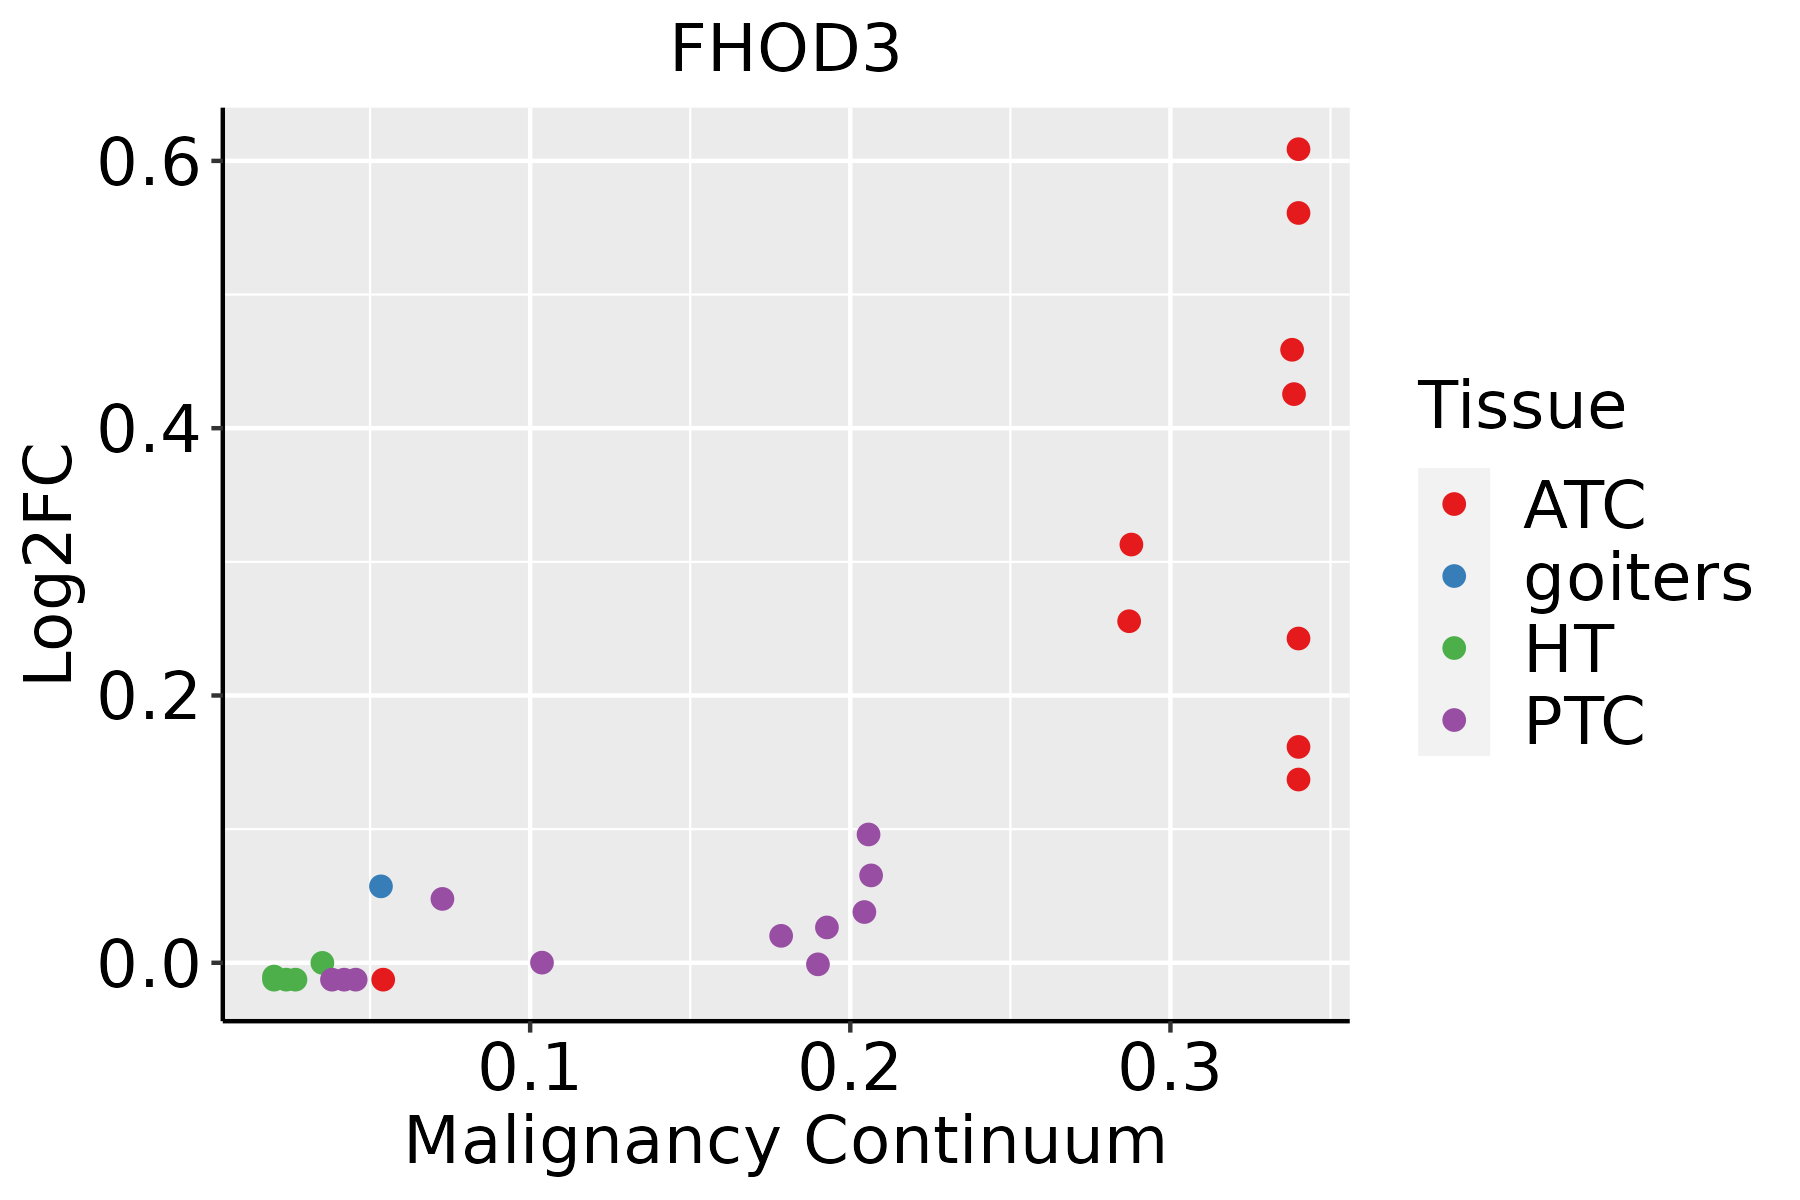 | ATC: Anaplastic thyroid cancer |
| HT: Hashimoto's thyroiditis | ||
| PTC: Papillary thyroid cancer |
| ∗log2FC in expression of this searched gene in stem-like cells from each diseased tissue sample relative to stem-like cells in normal samples in each tissue plotted against the malignancy continuum. Samples are colored based on if they are from different disease stage. |
Top |
Malignant transformation related pathway analysis |
| Find out the enriched GO biological processes and KEGG pathways involved in transition from healthy to precancer to cancer |
| Tissue | Disease Stage | Enriched GO biological Processes |
| Stomach | WIM |  |
| Stomach | SIM |  |
| Liver | NAFLD |  |
| Liver | Cirrhotic |  |
| Liver | HCC |  |
| ∗Top 15 enriched GO BP terms are showed in the bar plot of each disease state in each tissue. Each row represents a significant GO biological process which is colored according to the -log10(p.adjust). |
| Page: 1 2 3 4 5 6 7 8 9 |
| GO ID | Tissue | Disease Stage | Description | Gene Ratio | Bg Ratio | pvalue | p.adjust | Count |
| GO:0043254111 | Esophagus | ESCC | regulation of protein-containing complex assembly | 278/8552 | 428/18723 | 3.81e-16 | 2.77e-14 | 278 |
| GO:1902903111 | Esophagus | ESCC | regulation of supramolecular fiber organization | 237/8552 | 383/18723 | 9.06e-11 | 2.75e-09 | 237 |
| GO:0010639110 | Esophagus | ESCC | negative regulation of organelle organization | 215/8552 | 348/18723 | 8.20e-10 | 2.01e-08 | 215 |
| GO:0051258111 | Esophagus | ESCC | protein polymerization | 183/8552 | 297/18723 | 1.94e-08 | 3.75e-07 | 183 |
| GO:000701527 | Esophagus | ESCC | actin filament organization | 259/8552 | 442/18723 | 2.37e-08 | 4.50e-07 | 259 |
| GO:003253520 | Esophagus | ESCC | regulation of cellular component size | 227/8552 | 383/18723 | 4.77e-08 | 8.60e-07 | 227 |
| GO:0032970111 | Esophagus | ESCC | regulation of actin filament-based process | 231/8552 | 397/18723 | 2.91e-07 | 4.20e-06 | 231 |
| GO:0032956111 | Esophagus | ESCC | regulation of actin cytoskeleton organization | 210/8552 | 358/18723 | 4.40e-07 | 6.00e-06 | 210 |
| GO:0032271111 | Esophagus | ESCC | regulation of protein polymerization | 143/8552 | 233/18723 | 9.21e-07 | 1.17e-05 | 143 |
| GO:011005327 | Esophagus | ESCC | regulation of actin filament organization | 166/8552 | 278/18723 | 1.54e-06 | 1.85e-05 | 166 |
| GO:000815420 | Esophagus | ESCC | actin polymerization or depolymerization | 130/8552 | 218/18723 | 2.19e-05 | 1.88e-04 | 130 |
| GO:003086517 | Esophagus | ESCC | cortical cytoskeleton organization | 44/8552 | 61/18723 | 2.50e-05 | 2.13e-04 | 44 |
| GO:0030041110 | Esophagus | ESCC | actin filament polymerization | 114/8552 | 191/18723 | 6.46e-05 | 4.92e-04 | 114 |
| GO:000806419 | Esophagus | ESCC | regulation of actin polymerization or depolymerization | 112/8552 | 188/18723 | 8.31e-05 | 6.06e-04 | 112 |
| GO:003083218 | Esophagus | ESCC | regulation of actin filament length | 112/8552 | 189/18723 | 1.13e-04 | 7.85e-04 | 112 |
| GO:003083320 | Esophagus | ESCC | regulation of actin filament polymerization | 103/8552 | 172/18723 | 1.19e-04 | 8.15e-04 | 103 |
| GO:0031333110 | Esophagus | ESCC | negative regulation of protein-containing complex assembly | 86/8552 | 141/18723 | 1.74e-04 | 1.14e-03 | 86 |
| GO:003086610 | Esophagus | ESCC | cortical actin cytoskeleton organization | 28/8552 | 40/18723 | 1.61e-03 | 7.50e-03 | 28 |
| GO:006053716 | Esophagus | ESCC | muscle tissue development | 211/8552 | 403/18723 | 3.84e-03 | 1.56e-02 | 211 |
| GO:003103219 | Esophagus | ESCC | actomyosin structure organization | 108/8552 | 196/18723 | 4.86e-03 | 1.88e-02 | 108 |
| Page: 1 2 3 |
| Pathway ID | Tissue | Disease Stage | Description | Gene Ratio | Bg Ratio | pvalue | p.adjust | qvalue | Count |
| Page: 1 |
Top |
Cell-cell communication analysis |
| Identification of potential cell-cell interactions between two cell types and their ligand-receptor pairs for different disease states |
| Ligand | Receptor | LRpair | Pathway | Tissue | Disease Stage |
| Page: 1 |
Top |
Single-cell gene regulatory network inference analysis |
| Find out the significant the regulons (TFs) and the target genes of each regulon across cell types for different disease states |
| TF | Cell Type | Tissue | Disease Stage | Target Gene | RSS | Regulon Activity |
| ∗The dot plots of a searched regulon are shown for all cell subpopulations in each disease state of each tissue based on the regulon specific score inferred using pySCENIC and by calculating the average expression. |
| Page: 1 |
Top |
Somatic mutation of malignant transformation related genes |
| Annotation of somatic variants for genes involved in malignant transformation |
| Hugo Symbol | Variant Class | Variant Classification | dbSNP RS | HGVSc | HGVSp | HGVSp Short | SWISSPROT | BIOTYPE | SIFT | PolyPhen | Tumor Sample Barcode | Tissue | Histology | Sex | Age | Stage | Therapy Types | Drugs | Outcome |
| FHOD3 | SNV | Missense_Mutation | novel | c.2030N>G | p.Tyr677Cys | p.Y677C | Q2V2M9 | protein_coding | tolerated_low_confidence(0.05) | probably_damaging(0.992) | TCGA-A2-A0D2-01 | Breast | breast invasive carcinoma | Female | <65 | I/II | Chemotherapy | adriamycin | SD |
| FHOD3 | SNV | Missense_Mutation | rs201185019 | c.4790N>A | p.Arg1597Gln | p.R1597Q | Q2V2M9 | protein_coding | deleterious(0) | probably_damaging(0.96) | TCGA-A7-A26E-01 | Breast | breast invasive carcinoma | Female | >=65 | III/IV | Chemotherapy | cytoxan | SD |
| FHOD3 | SNV | Missense_Mutation | rs747642309 | c.3194N>G | p.Gln1065Arg | p.Q1065R | Q2V2M9 | protein_coding | tolerated(0.26) | probably_damaging(0.977) | TCGA-AO-A128-01 | Breast | breast invasive carcinoma | Female | <65 | I/II | Chemotherapy | doxorubicin | SD |
| FHOD3 | SNV | Missense_Mutation | rs778305842 | c.4018N>A | p.Gly1340Arg | p.G1340R | Q2V2M9 | protein_coding | deleterious(0) | probably_damaging(1) | TCGA-AO-A128-01 | Breast | breast invasive carcinoma | Female | <65 | I/II | Chemotherapy | doxorubicin | SD |
| FHOD3 | SNV | Missense_Mutation | c.2418G>T | p.Arg806Ser | p.R806S | Q2V2M9 | protein_coding | deleterious_low_confidence(0.04) | benign(0.381) | TCGA-AR-A1AY-01 | Breast | breast invasive carcinoma | Female | >=65 | I/II | Unspecific | Doxorubicin | SD | |
| FHOD3 | SNV | Missense_Mutation | c.2903N>G | p.Ala968Gly | p.A968G | Q2V2M9 | protein_coding | tolerated(0.18) | benign(0.013) | TCGA-AR-A24V-01 | Breast | breast invasive carcinoma | Female | <65 | I/II | Chemotherapy | doxorubicin | SD | |
| FHOD3 | SNV | Missense_Mutation | c.3329N>G | p.Leu1110Arg | p.L1110R | Q2V2M9 | protein_coding | deleterious(0) | probably_damaging(0.983) | TCGA-C8-A12K-01 | Breast | breast invasive carcinoma | Female | >=65 | I/II | Unknown | Unknown | SD | |
| FHOD3 | SNV | Missense_Mutation | c.2536T>G | p.Leu846Val | p.L846V | Q2V2M9 | protein_coding | tolerated(0.35) | benign(0.017) | TCGA-D8-A1JF-01 | Breast | breast invasive carcinoma | Female | >=65 | III/IV | Unknown | Unknown | SD | |
| FHOD3 | SNV | Missense_Mutation | c.4300N>C | p.Phe1434Leu | p.F1434L | Q2V2M9 | protein_coding | deleterious(0.02) | probably_damaging(0.995) | TCGA-D8-A1XW-01 | Breast | breast invasive carcinoma | Female | <65 | I/II | Chemotherapy | adriamycin+cyclophosphamide | SD | |
| FHOD3 | SNV | Missense_Mutation | c.2255N>G | p.Glu752Gly | p.E752G | Q2V2M9 | protein_coding | tolerated_low_confidence(0.15) | benign(0.005) | TCGA-E2-A14W-01 | Breast | breast invasive carcinoma | Male | >=65 | I/II | Chemotherapy | cytoxan | SD |
| Page: 1 2 3 4 5 6 7 8 9 10 11 12 13 14 15 16 17 18 19 20 21 22 23 |
Top |
Related drugs of malignant transformation related genes |
| Identification of chemicals and drugs interact with genes involved in malignant transfromation |
| (DGIdb 4.0) |
| Entrez ID | Symbol | Category | Interaction Types | Drug Claim Name | Drug Name | PMIDs |
| Page: 1 |

Copyright 2023-Present -The University of Texas Health Science Center at Houston |