
|
|||||
|
 | |
| |
| |
| |
| |
| |
|
Gene: ERG28 |
Gene summary for ERG28 |
| Gene information | Species | Human | Gene symbol | ERG28 | Gene ID | 11161 |
| Gene name | ergosterol biosynthesis 28 homolog | |
| Gene Alias | C14orf1 | |
| Cytomap | 14q24.3 | |
| Gene Type | protein-coding | GO ID | GO:0006629 | UniProtAcc | Q6FII3 |
Top |
Malignant transformation analysis |
| Identification of the aberrant gene expression in precancerous and cancerous lesions by comparing the gene expression of stem-like cells in diseased tissues with normal stem cells |
| Entrez ID | Symbol | Replicates | Species | Organ | Tissue | Adj P-value | Log2FC | Malignancy |
| 11161 | ERG28 | HTA11_2487_2000001011 | Human | Colorectum | SER | 5.37e-03 | 2.60e-01 | -0.1808 |
| 11161 | ERG28 | HTA11_1938_2000001011 | Human | Colorectum | AD | 2.71e-02 | 2.25e-01 | -0.0811 |
| 11161 | ERG28 | HTA11_347_2000001011 | Human | Colorectum | AD | 7.01e-06 | 2.09e-01 | -0.1954 |
| 11161 | ERG28 | HTA11_411_2000001011 | Human | Colorectum | SER | 4.39e-04 | 5.29e-01 | -0.2602 |
| 11161 | ERG28 | HTA11_2112_2000001011 | Human | Colorectum | SER | 6.17e-06 | 5.95e-01 | -0.2196 |
| 11161 | ERG28 | HTA11_696_2000001011 | Human | Colorectum | AD | 1.31e-11 | 3.55e-01 | -0.1464 |
| 11161 | ERG28 | HTA11_1391_2000001011 | Human | Colorectum | AD | 4.80e-06 | 3.15e-01 | -0.059 |
| 11161 | ERG28 | HTA11_866_3004761011 | Human | Colorectum | AD | 1.87e-05 | 2.32e-01 | 0.096 |
| 11161 | ERG28 | LZE2T | Human | Esophagus | ESCC | 1.52e-08 | 1.00e+00 | 0.082 |
| 11161 | ERG28 | LZE4T | Human | Esophagus | ESCC | 6.89e-31 | 8.30e-01 | 0.0811 |
| 11161 | ERG28 | LZE5T | Human | Esophagus | ESCC | 6.95e-12 | 6.74e-01 | 0.0514 |
| 11161 | ERG28 | LZE7T | Human | Esophagus | ESCC | 2.07e-15 | 6.60e-01 | 0.0667 |
| 11161 | ERG28 | LZE8T | Human | Esophagus | ESCC | 2.41e-13 | 4.15e-01 | 0.067 |
| 11161 | ERG28 | LZE20T | Human | Esophagus | ESCC | 3.87e-19 | 5.77e-01 | 0.0662 |
| 11161 | ERG28 | LZE21D1 | Human | Esophagus | HGIN | 5.38e-03 | 3.30e-01 | 0.0632 |
| 11161 | ERG28 | LZE22D1 | Human | Esophagus | HGIN | 6.34e-08 | 3.09e-01 | 0.0595 |
| 11161 | ERG28 | LZE22T | Human | Esophagus | ESCC | 1.54e-17 | 1.02e+00 | 0.068 |
| 11161 | ERG28 | LZE24T | Human | Esophagus | ESCC | 8.36e-42 | 9.72e-01 | 0.0596 |
| 11161 | ERG28 | LZE21T | Human | Esophagus | ESCC | 1.16e-05 | 3.66e-01 | 0.0655 |
| 11161 | ERG28 | LZE6T | Human | Esophagus | ESCC | 7.17e-11 | 4.51e-01 | 0.0845 |
| Page: 1 2 3 |
| Tissue | Expression Dynamics | Abbreviation |
| Colorectum (GSE201348) |  | FAP: Familial adenomatous polyposis |
| CRC: Colorectal cancer | ||
| Colorectum (HTA11) | 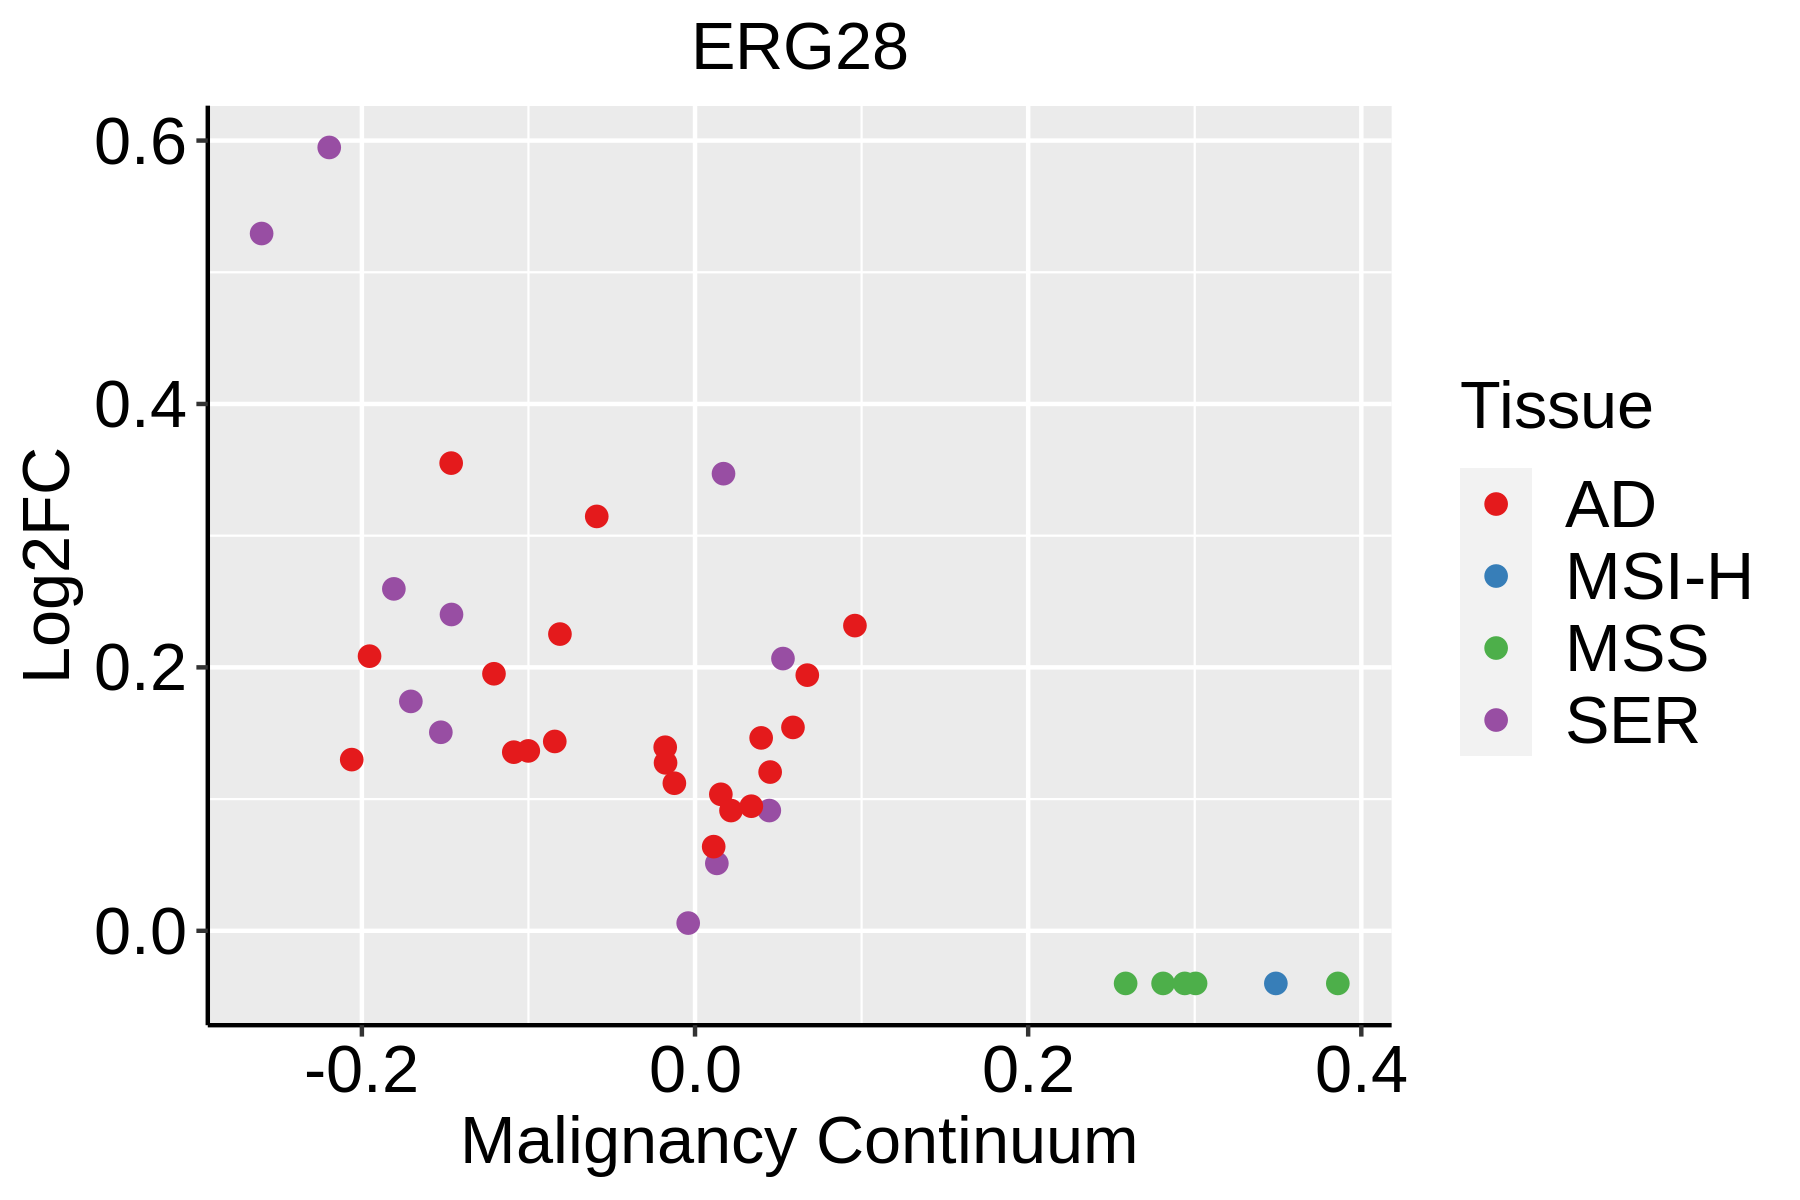 | AD: Adenomas |
| SER: Sessile serrated lesions | ||
| MSI-H: Microsatellite-high colorectal cancer | ||
| MSS: Microsatellite stable colorectal cancer | ||
| Esophagus | 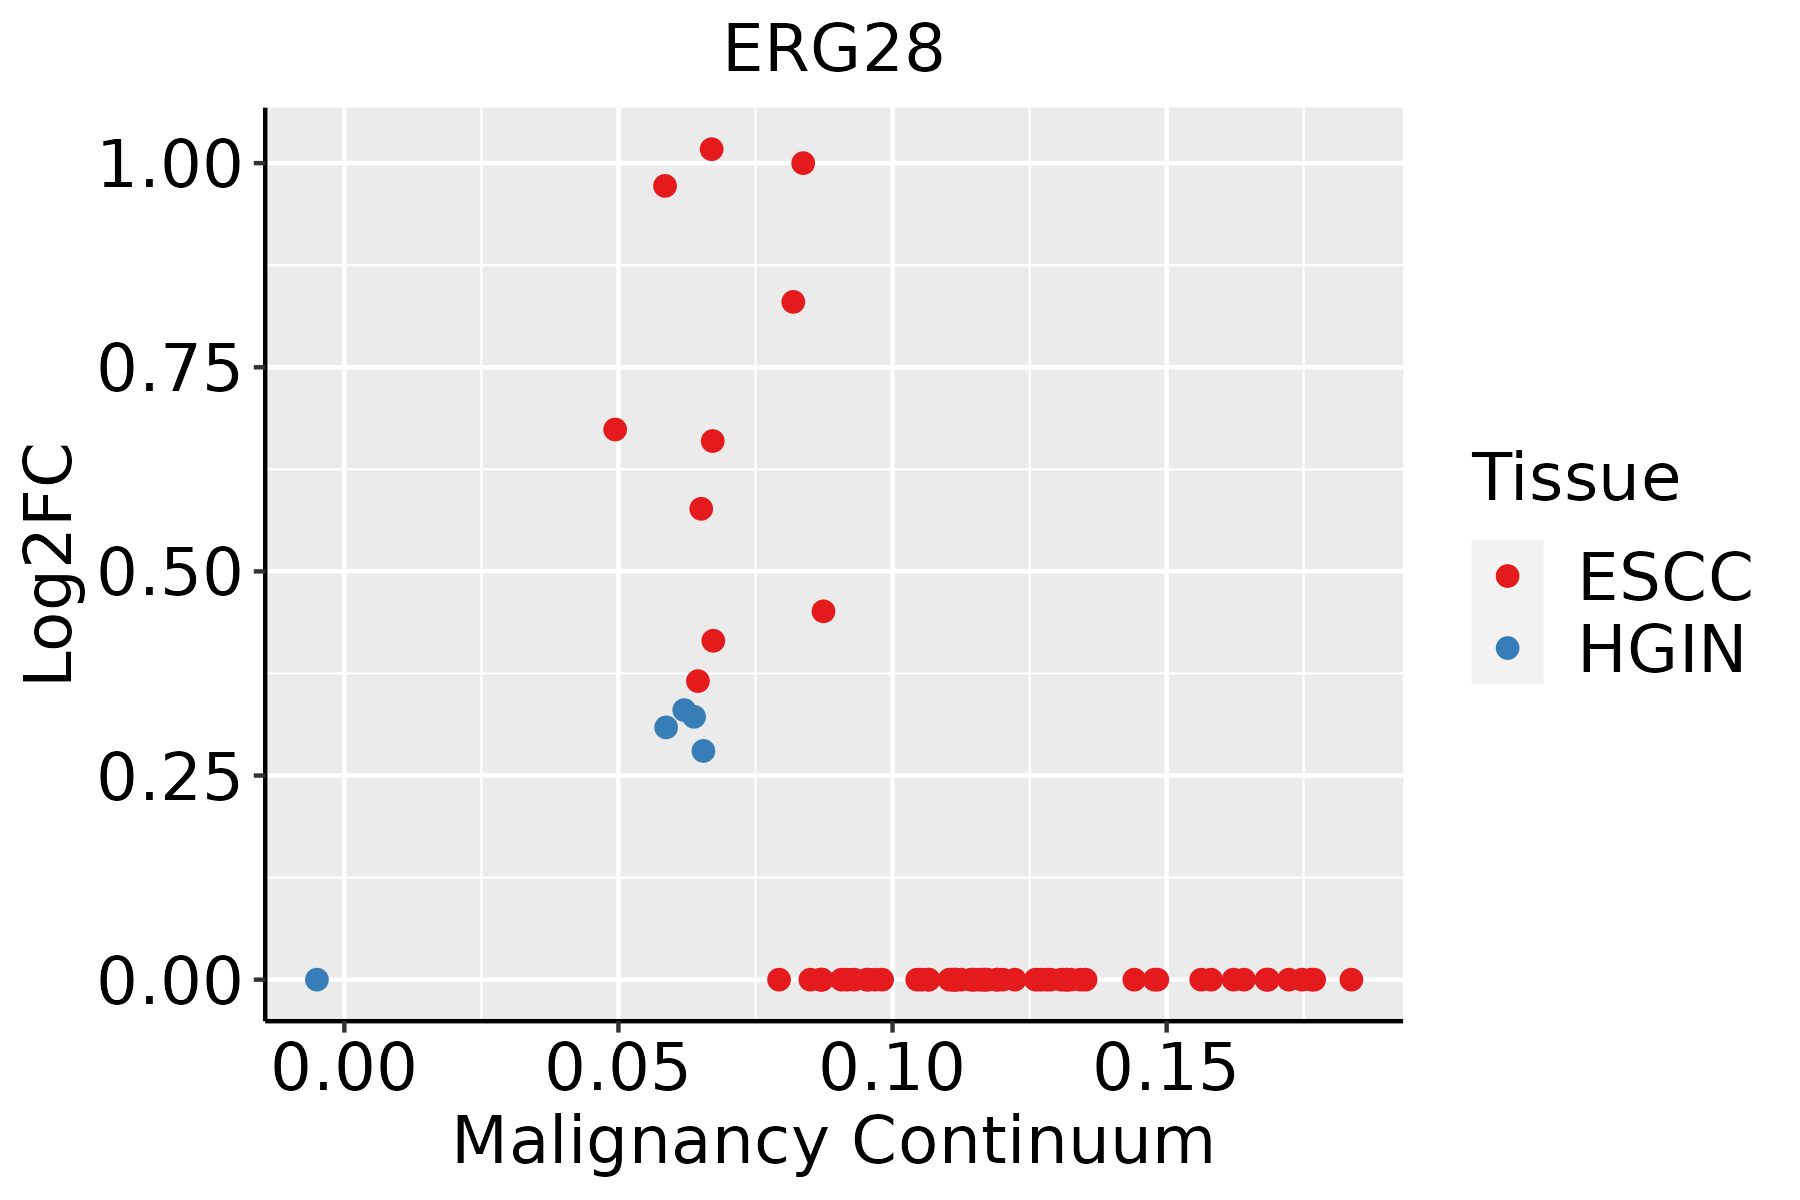 | ESCC: Esophageal squamous cell carcinoma |
| HGIN: High-grade intraepithelial neoplasias | ||
| LGIN: Low-grade intraepithelial neoplasias | ||
| Liver | 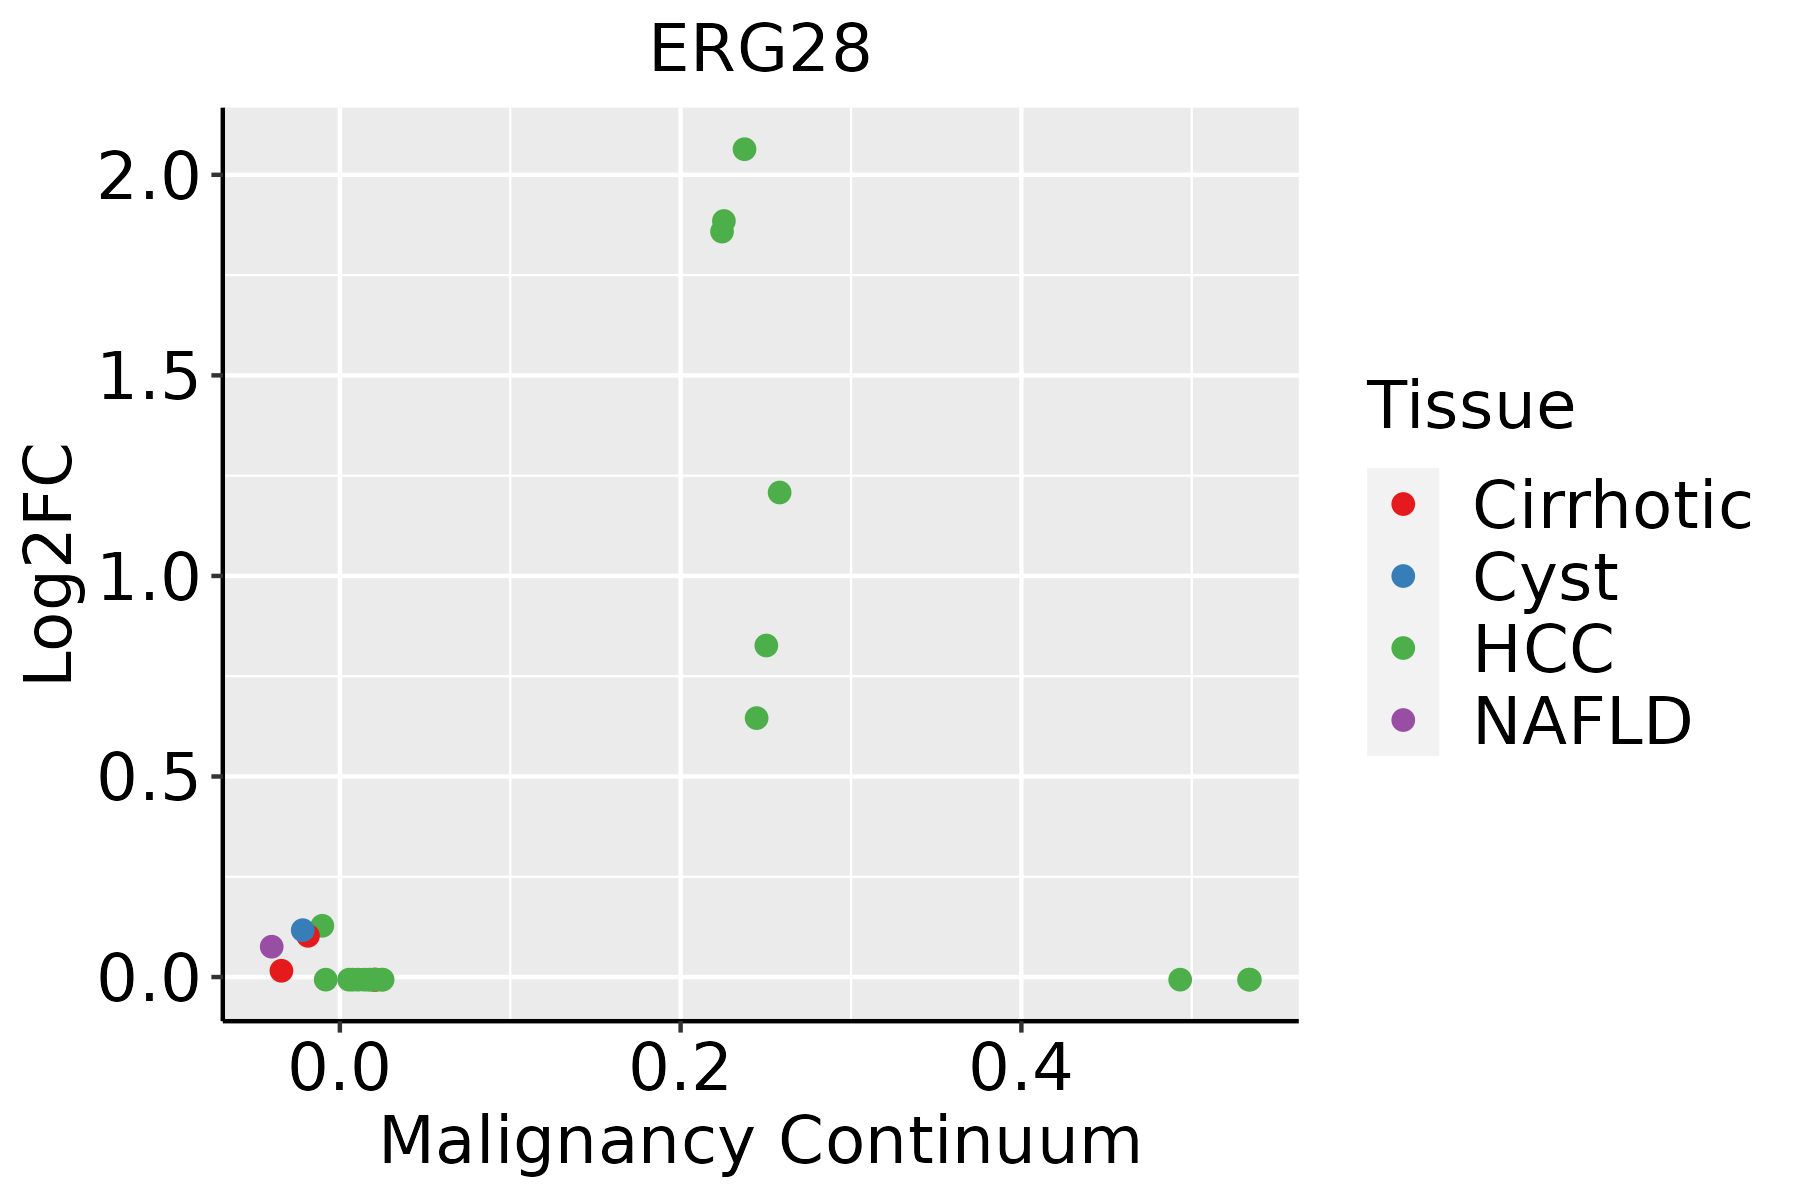 | HCC: Hepatocellular carcinoma |
| NAFLD: Non-alcoholic fatty liver disease | ||
| Thyroid |  | ATC: Anaplastic thyroid cancer |
| HT: Hashimoto's thyroiditis | ||
| PTC: Papillary thyroid cancer |
| ∗log2FC in expression of this searched gene in stem-like cells from each diseased tissue sample relative to stem-like cells in normal samples in each tissue plotted against the malignancy continuum. Samples are colored based on if they are from different disease stage. |
Top |
Malignant transformation related pathway analysis |
| Find out the enriched GO biological processes and KEGG pathways involved in transition from healthy to precancer to cancer |
| Tissue | Disease Stage | Enriched GO biological Processes |
| Stomach | WIM |  |
| Stomach | SIM |  |
| Liver | NAFLD |  |
| Liver | Cirrhotic |  |
| Liver | HCC |  |
| ∗Top 15 enriched GO BP terms are showed in the bar plot of each disease state in each tissue. Each row represents a significant GO biological process which is colored according to the -log10(p.adjust). |
| Page: 1 2 3 4 5 6 7 8 9 |
| GO ID | Tissue | Disease Stage | Description | Gene Ratio | Bg Ratio | pvalue | p.adjust | Count |
| GO:0008202 | Colorectum | AD | steroid metabolic process | 85/3918 | 319/18723 | 8.07e-03 | 4.75e-02 | 85 |
| GO:00161263 | Esophagus | ESCC | sterol biosynthetic process | 46/8552 | 64/18723 | 1.91e-05 | 1.67e-04 | 46 |
| GO:00066946 | Esophagus | ESCC | steroid biosynthetic process | 98/8552 | 173/18723 | 2.34e-03 | 1.03e-02 | 98 |
| GO:00161254 | Esophagus | ESCC | sterol metabolic process | 86/8552 | 152/18723 | 4.37e-03 | 1.73e-02 | 86 |
| GO:19016174 | Esophagus | ESCC | organic hydroxy compound biosynthetic process | 128/8552 | 237/18723 | 5.86e-03 | 2.16e-02 | 128 |
| GO:00082022 | Liver | HCC | steroid metabolic process | 188/7958 | 319/18723 | 1.96e-09 | 5.63e-08 | 188 |
| GO:00161252 | Liver | HCC | sterol metabolic process | 101/7958 | 152/18723 | 1.99e-09 | 5.63e-08 | 101 |
| GO:00161261 | Liver | HCC | sterol biosynthetic process | 47/7958 | 64/18723 | 5.00e-07 | 8.11e-06 | 47 |
| GO:00066942 | Liver | HCC | steroid biosynthetic process | 104/7958 | 173/18723 | 2.13e-06 | 2.91e-05 | 104 |
| GO:19016172 | Liver | HCC | organic hydroxy compound biosynthetic process | 129/7958 | 237/18723 | 1.32e-04 | 1.08e-03 | 129 |
| Page: 1 |
| Pathway ID | Tissue | Disease Stage | Description | Gene Ratio | Bg Ratio | pvalue | p.adjust | qvalue | Count |
| Page: 1 |
Top |
Cell-cell communication analysis |
| Identification of potential cell-cell interactions between two cell types and their ligand-receptor pairs for different disease states |
| Ligand | Receptor | LRpair | Pathway | Tissue | Disease Stage |
| Page: 1 |
Top |
Single-cell gene regulatory network inference analysis |
| Find out the significant the regulons (TFs) and the target genes of each regulon across cell types for different disease states |
| TF | Cell Type | Tissue | Disease Stage | Target Gene | RSS | Regulon Activity |
| ∗The dot plots of a searched regulon are shown for all cell subpopulations in each disease state of each tissue based on the regulon specific score inferred using pySCENIC and by calculating the average expression. |
| Page: 1 |
Top |
Somatic mutation of malignant transformation related genes |
| Annotation of somatic variants for genes involved in malignant transformation |
| Hugo Symbol | Variant Class | Variant Classification | dbSNP RS | HGVSc | HGVSp | HGVSp Short | SWISSPROT | BIOTYPE | SIFT | PolyPhen | Tumor Sample Barcode | Tissue | Histology | Sex | Age | Stage | Therapy Types | Drugs | Outcome |
| Page: 1 |
Top |
Related drugs of malignant transformation related genes |
| Identification of chemicals and drugs interact with genes involved in malignant transfromation |
| (DGIdb 4.0) |
| Entrez ID | Symbol | Category | Interaction Types | Drug Claim Name | Drug Name | PMIDs |
| Page: 1 |

Copyright 2023-Present -The University of Texas Health Science Center at Houston |