
|
|||||
|
 | |
| |
| |
| |
| |
| |
|
Gene: CSF1 |
Gene summary for CSF1 |
| Gene information | Species | Human | Gene symbol | CSF1 | Gene ID | 1435 |
| Gene name | colony stimulating factor 1 | |
| Gene Alias | CSF-1 | |
| Cytomap | 1p13.3 | |
| Gene Type | protein-coding | GO ID | GO:0000003 | UniProtAcc | A0A024R0A1 |
Top |
Malignant transformation analysis |
| Identification of the aberrant gene expression in precancerous and cancerous lesions by comparing the gene expression of stem-like cells in diseased tissues with normal stem cells |
| Entrez ID | Symbol | Replicates | Species | Organ | Tissue | Adj P-value | Log2FC | Malignancy |
| 1435 | CSF1 | HCC1_Meng | Human | Liver | HCC | 2.83e-26 | 3.77e-02 | 0.0246 |
| 1435 | CSF1 | cirrhotic3 | Human | Liver | Cirrhotic | 3.77e-03 | 9.17e-02 | 0.0215 |
| 1435 | CSF1 | HCC2 | Human | Liver | HCC | 6.95e-08 | 1.98e+00 | 0.5341 |
| 1435 | CSF1 | Pt13.b | Human | Liver | HCC | 1.66e-04 | 1.07e-01 | 0.0251 |
| 1435 | CSF1 | Pt14.b | Human | Liver | HCC | 3.60e-02 | 1.78e-01 | 0.018 |
| 1435 | CSF1 | S014 | Human | Liver | HCC | 2.11e-22 | 7.88e-01 | 0.2254 |
| 1435 | CSF1 | S015 | Human | Liver | HCC | 2.09e-16 | 5.96e-01 | 0.2375 |
| 1435 | CSF1 | S016 | Human | Liver | HCC | 7.80e-17 | 6.54e-01 | 0.2243 |
| 1435 | CSF1 | S027 | Human | Liver | HCC | 1.15e-18 | 1.24e+00 | 0.2446 |
| 1435 | CSF1 | S028 | Human | Liver | HCC | 9.25e-38 | 1.45e+00 | 0.2503 |
| 1435 | CSF1 | S029 | Human | Liver | HCC | 8.02e-34 | 1.22e+00 | 0.2581 |
| 1435 | CSF1 | ATC09 | Human | Thyroid | ATC | 1.38e-05 | 2.17e-01 | 0.2871 |
| 1435 | CSF1 | ATC12 | Human | Thyroid | ATC | 2.24e-12 | 3.70e-01 | 0.34 |
| 1435 | CSF1 | ATC1 | Human | Thyroid | ATC | 1.68e-06 | 2.56e-01 | 0.2878 |
| 1435 | CSF1 | ATC2 | Human | Thyroid | ATC | 3.49e-10 | 1.36e+00 | 0.34 |
| 1435 | CSF1 | ATC3 | Human | Thyroid | ATC | 1.58e-04 | 2.43e-01 | 0.338 |
| 1435 | CSF1 | ATC4 | Human | Thyroid | ATC | 3.58e-18 | 4.60e-01 | 0.34 |
| Page: 1 |
| Tissue | Expression Dynamics | Abbreviation |
| Liver | 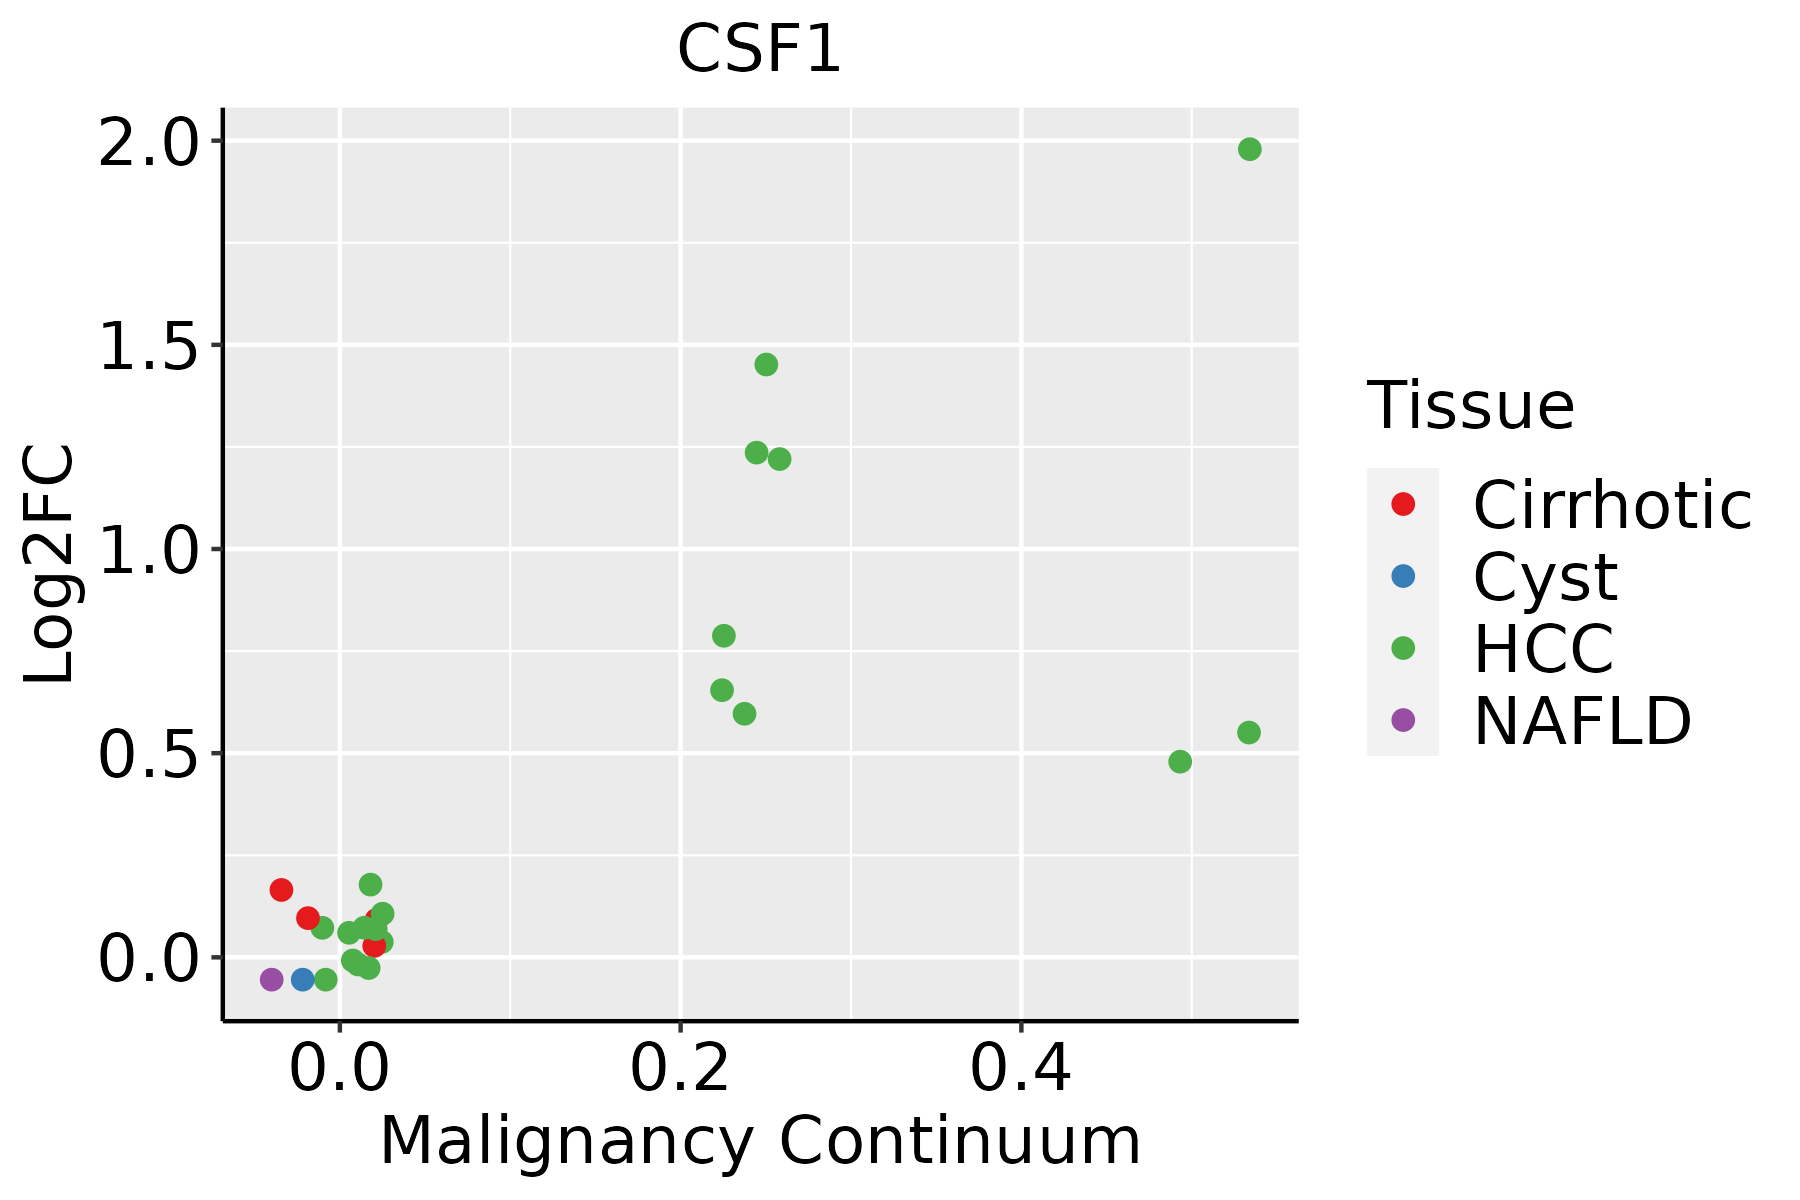 | HCC: Hepatocellular carcinoma |
| NAFLD: Non-alcoholic fatty liver disease | ||
| Thyroid | 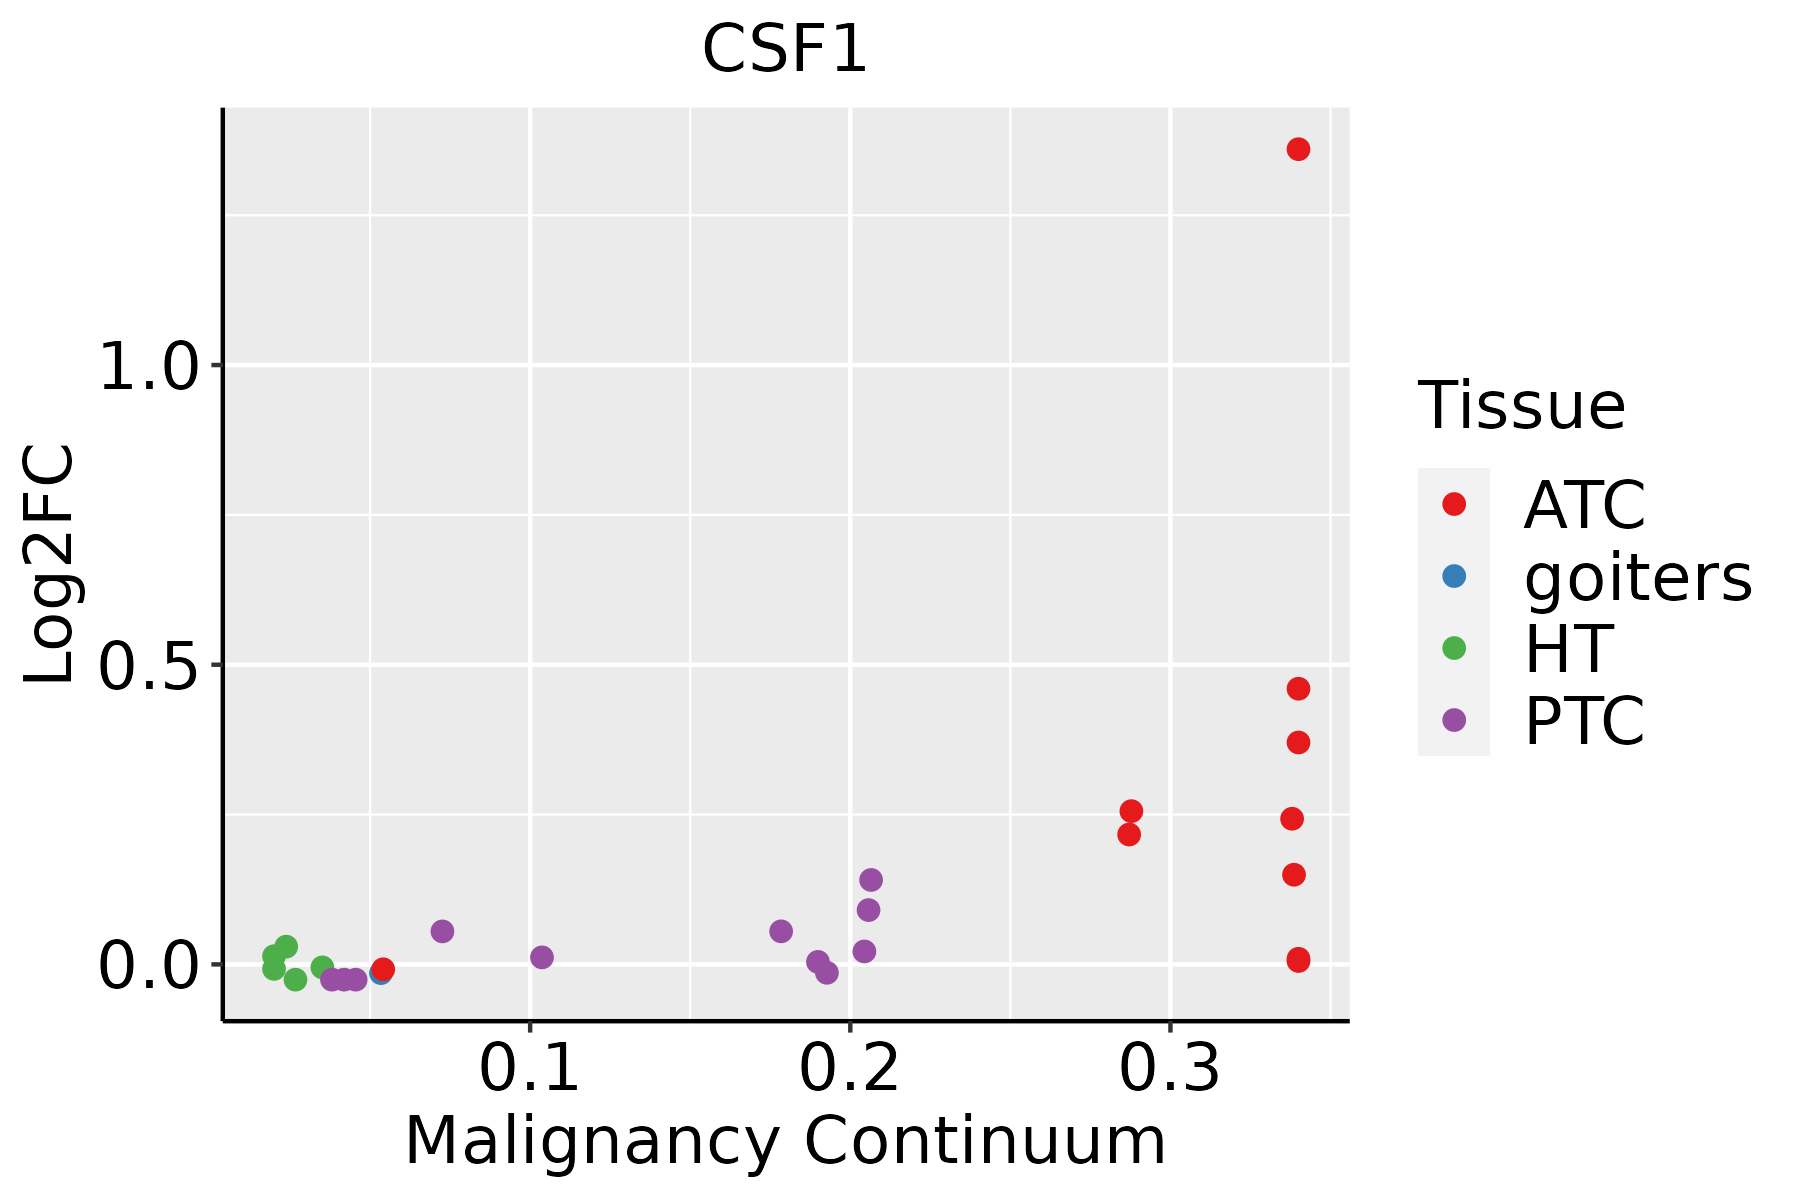 | ATC: Anaplastic thyroid cancer |
| HT: Hashimoto's thyroiditis | ||
| PTC: Papillary thyroid cancer |
| ∗log2FC in expression of this searched gene in stem-like cells from each diseased tissue sample relative to stem-like cells in normal samples in each tissue plotted against the malignancy continuum. Samples are colored based on if they are from different disease stage. |
Top |
Malignant transformation related pathway analysis |
| Find out the enriched GO biological processes and KEGG pathways involved in transition from healthy to precancer to cancer |
| Tissue | Disease Stage | Enriched GO biological Processes |
| Stomach | WIM |  |
| Stomach | SIM |  |
| Liver | NAFLD |  |
| Liver | Cirrhotic |  |
| Liver | HCC |  |
| ∗Top 15 enriched GO BP terms are showed in the bar plot of each disease state in each tissue. Each row represents a significant GO biological process which is colored according to the -log10(p.adjust). |
| Page: 1 2 3 4 5 6 7 8 9 |
| GO ID | Tissue | Disease Stage | Description | Gene Ratio | Bg Ratio | pvalue | p.adjust | Count |
| GO:0032970 | Colorectum | AD | regulation of actin filament-based process | 142/3918 | 397/18723 | 4.05e-12 | 5.90e-10 | 142 |
| GO:0048732 | Colorectum | AD | gland development | 149/3918 | 436/18723 | 6.07e-11 | 6.33e-09 | 149 |
| GO:0032956 | Colorectum | AD | regulation of actin cytoskeleton organization | 127/3918 | 358/18723 | 1.03e-10 | 1.04e-08 | 127 |
| GO:0045216 | Colorectum | AD | cell-cell junction organization | 80/3918 | 200/18723 | 5.57e-10 | 4.58e-08 | 80 |
| GO:0022604 | Colorectum | AD | regulation of cell morphogenesis | 109/3918 | 309/18723 | 3.08e-09 | 2.07e-07 | 109 |
| GO:0030099 | Colorectum | AD | myeloid cell differentiation | 119/3918 | 381/18723 | 1.24e-06 | 4.01e-05 | 119 |
| GO:0030879 | Colorectum | AD | mammary gland development | 53/3918 | 137/18723 | 1.46e-06 | 4.58e-05 | 53 |
| GO:0008360 | Colorectum | AD | regulation of cell shape | 56/3918 | 154/18723 | 7.01e-06 | 1.73e-04 | 56 |
| GO:0046777 | Colorectum | AD | protein autophosphorylation | 74/3918 | 227/18723 | 2.48e-05 | 4.76e-04 | 74 |
| GO:0031532 | Colorectum | AD | actin cytoskeleton reorganization | 41/3918 | 107/18723 | 2.81e-05 | 5.28e-04 | 41 |
| GO:0061180 | Colorectum | AD | mammary gland epithelium development | 28/3918 | 67/18723 | 8.74e-05 | 1.35e-03 | 28 |
| GO:0060249 | Colorectum | AD | anatomical structure homeostasis | 94/3918 | 314/18723 | 9.37e-05 | 1.42e-03 | 94 |
| GO:0043954 | Colorectum | AD | cellular component maintenance | 26/3918 | 61/18723 | 1.04e-04 | 1.56e-03 | 26 |
| GO:0033674 | Colorectum | AD | positive regulation of kinase activity | 131/3918 | 467/18723 | 1.28e-04 | 1.85e-03 | 131 |
| GO:0022612 | Colorectum | AD | gland morphogenesis | 42/3918 | 118/18723 | 1.62e-04 | 2.23e-03 | 42 |
| GO:0001894 | Colorectum | AD | tissue homeostasis | 81/3918 | 268/18723 | 1.96e-04 | 2.62e-03 | 81 |
| GO:0030224 | Colorectum | AD | monocyte differentiation | 17/3918 | 36/18723 | 3.79e-04 | 4.36e-03 | 17 |
| GO:0060562 | Colorectum | AD | epithelial tube morphogenesis | 93/3918 | 325/18723 | 5.65e-04 | 6.00e-03 | 93 |
| GO:0045860 | Colorectum | AD | positive regulation of protein kinase activity | 107/3918 | 386/18723 | 8.01e-04 | 7.92e-03 | 107 |
| GO:0060443 | Colorectum | AD | mammary gland morphogenesis | 18/3918 | 43/18723 | 1.51e-03 | 1.27e-02 | 18 |
| Page: 1 2 3 4 5 6 7 8 9 10 11 |
| Pathway ID | Tissue | Disease Stage | Description | Gene Ratio | Bg Ratio | pvalue | p.adjust | qvalue | Count |
| hsa0502214 | Liver | Cirrhotic | Pathways of neurodegeneration - multiple diseases | 217/2530 | 476/8465 | 7.30e-14 | 2.03e-12 | 1.25e-12 | 217 |
| hsa0501014 | Liver | Cirrhotic | Alzheimer disease | 180/2530 | 384/8465 | 5.52e-13 | 1.36e-11 | 8.36e-12 | 180 |
| hsa0532310 | Liver | Cirrhotic | Rheumatoid arthritis | 38/2530 | 93/8465 | 1.52e-02 | 4.57e-02 | 2.82e-02 | 38 |
| hsa0502215 | Liver | Cirrhotic | Pathways of neurodegeneration - multiple diseases | 217/2530 | 476/8465 | 7.30e-14 | 2.03e-12 | 1.25e-12 | 217 |
| hsa0501015 | Liver | Cirrhotic | Alzheimer disease | 180/2530 | 384/8465 | 5.52e-13 | 1.36e-11 | 8.36e-12 | 180 |
| hsa0532311 | Liver | Cirrhotic | Rheumatoid arthritis | 38/2530 | 93/8465 | 1.52e-02 | 4.57e-02 | 2.82e-02 | 38 |
| hsa0501022 | Liver | HCC | Alzheimer disease | 254/4020 | 384/8465 | 3.75e-14 | 8.97e-13 | 4.99e-13 | 254 |
| hsa0502222 | Liver | HCC | Pathways of neurodegeneration - multiple diseases | 298/4020 | 476/8465 | 6.59e-12 | 1.30e-10 | 7.22e-11 | 298 |
| hsa046684 | Liver | HCC | TNF signaling pathway | 73/4020 | 114/8465 | 2.53e-04 | 1.19e-03 | 6.63e-04 | 73 |
| hsa0501032 | Liver | HCC | Alzheimer disease | 254/4020 | 384/8465 | 3.75e-14 | 8.97e-13 | 4.99e-13 | 254 |
| hsa0502232 | Liver | HCC | Pathways of neurodegeneration - multiple diseases | 298/4020 | 476/8465 | 6.59e-12 | 1.30e-10 | 7.22e-11 | 298 |
| hsa0466811 | Liver | HCC | TNF signaling pathway | 73/4020 | 114/8465 | 2.53e-04 | 1.19e-03 | 6.63e-04 | 73 |
| Page: 1 |
Top |
Cell-cell communication analysis |
| Identification of potential cell-cell interactions between two cell types and their ligand-receptor pairs for different disease states |
| Ligand | Receptor | LRpair | Pathway | Tissue | Disease Stage |
| CSF1 | CSF1R | CSF1_CSF1R | CSF | Breast | DCIS |
| CSF1 | CSF1R | CSF1_CSF1R | CSF | Cervix | ADJ |
| IL34 | CSF1R | IL34_CSF1R | CSF | Cervix | CC |
| CSF1 | CSF1R | CSF1_CSF1R | CSF | Cervix | CC |
| CSF1 | CSF1R | CSF1_CSF1R | CSF | Cervix | Precancer |
| IL34 | CSF1R | IL34_CSF1R | CSF | CRC | AD |
| CSF1 | CSF1R | CSF1_CSF1R | CSF | CRC | AD |
| CSF1 | CSF1R | CSF1_CSF1R | CSF | CRC | ADJ |
| CSF1 | CSF1R | CSF1_CSF1R | CSF | CRC | MSI-H |
| CSF1 | CSF1R | CSF1_CSF1R | CSF | CRC | SER |
| CSF1 | CSF1R | CSF1_CSF1R | CSF | Endometrium | ADJ |
| CSF1 | CSF1R | CSF1_CSF1R | CSF | Endometrium | AEH |
| CSF1 | CSF1R | CSF1_CSF1R | CSF | Endometrium | EEC |
| CSF1 | CSF1R | CSF1_CSF1R | CSF | Endometrium | Healthy |
| CSF1 | CSF1R | CSF1_CSF1R | CSF | HNSCC | ADJ |
| IL34 | CSF1R | IL34_CSF1R | CSF | HNSCC | Healthy |
| IL34 | CSF1R | IL34_CSF1R | CSF | HNSCC | OSCC |
| CSF1 | CSF1R | CSF1_CSF1R | CSF | HNSCC | OSCC |
| IL34 | CSF1R | IL34_CSF1R | CSF | HNSCC | Precancer |
| CSF1 | CSF1R | CSF1_CSF1R | CSF | HNSCC | Precancer |
| Page: 1 2 |
Top |
Single-cell gene regulatory network inference analysis |
| Find out the significant the regulons (TFs) and the target genes of each regulon across cell types for different disease states |
| TF | Cell Type | Tissue | Disease Stage | Target Gene | RSS | Regulon Activity |
| ∗The dot plots of a searched regulon are shown for all cell subpopulations in each disease state of each tissue based on the regulon specific score inferred using pySCENIC and by calculating the average expression. |
| Page: 1 |
Top |
Somatic mutation of malignant transformation related genes |
| Annotation of somatic variants for genes involved in malignant transformation |
| Hugo Symbol | Variant Class | Variant Classification | dbSNP RS | HGVSc | HGVSp | HGVSp Short | SWISSPROT | BIOTYPE | SIFT | PolyPhen | Tumor Sample Barcode | Tissue | Histology | Sex | Age | Stage | Therapy Types | Drugs | Outcome |
| CSF1 | SNV | Missense_Mutation | c.830C>T | p.Ser277Leu | p.S277L | P09603 | protein_coding | tolerated(0.09) | benign(0.103) | TCGA-A2-A0CX-01 | Breast | breast invasive carcinoma | Female | <65 | I/II | Chemotherapy | adriamycin | SD | |
| CSF1 | SNV | Missense_Mutation | c.211N>C | p.Asp71His | p.D71H | P09603 | protein_coding | deleterious(0) | probably_damaging(0.99) | TCGA-AO-A128-01 | Breast | breast invasive carcinoma | Female | <65 | I/II | Chemotherapy | doxorubicin | SD | |
| CSF1 | SNV | Missense_Mutation | rs774056094 | c.841N>T | p.Arg281Cys | p.R281C | P09603 | protein_coding | tolerated(0.17) | possibly_damaging(0.663) | TCGA-BH-A0B6-01 | Breast | breast invasive carcinoma | Female | <65 | I/II | Unknown | Unknown | SD |
| CSF1 | SNV | Missense_Mutation | c.1259N>G | p.Ser420Cys | p.S420C | P09603 | protein_coding | deleterious(0.03) | possibly_damaging(0.87) | TCGA-C8-A26V-01 | Breast | breast invasive carcinoma | Female | <65 | III/IV | Hormone Therapy | tamoxiphen | CR | |
| CSF1 | SNV | Missense_Mutation | c.763A>T | p.Arg255Trp | p.R255W | P09603 | protein_coding | deleterious(0) | probably_damaging(0.995) | TCGA-E2-A14T-01 | Breast | breast invasive carcinoma | Female | <65 | I/II | Chemotherapy | doxorubicin | SD | |
| CSF1 | insertion | Frame_Shift_Ins | novel | c.1187_1188insC | p.Glu399GlyfsTer64 | p.E399Gfs*64 | P09603 | protein_coding | TCGA-AN-A0AK-01 | Breast | breast invasive carcinoma | Female | >=65 | I/II | Unknown | Unknown | SD | ||
| CSF1 | SNV | Missense_Mutation | c.205T>C | p.Phe69Leu | p.F69L | P09603 | protein_coding | deleterious(0) | probably_damaging(0.992) | TCGA-A6-5665-01 | Colorectum | colon adenocarcinoma | Female | >=65 | I/II | Unknown | Unknown | PD | |
| CSF1 | SNV | Missense_Mutation | c.947N>A | p.Pro316His | p.P316H | P09603 | protein_coding | deleterious(0.01) | probably_damaging(0.946) | TCGA-AA-A01Z-01 | Colorectum | colon adenocarcinoma | Male | >=65 | I/II | Unknown | Unknown | PD | |
| CSF1 | SNV | Missense_Mutation | rs771447390 | c.322G>A | p.Ala108Thr | p.A108T | P09603 | protein_coding | tolerated(0.23) | benign(0.433) | TCGA-G4-6304-01 | Colorectum | colon adenocarcinoma | Female | >=65 | I/II | Chemotherapy | fluorouracil | PD |
| CSF1 | SNV | Missense_Mutation | rs765157738 | c.1225N>T | p.Arg409Cys | p.R409C | P09603 | protein_coding | tolerated(0.17) | possibly_damaging(0.761) | TCGA-QG-A5Z2-01 | Colorectum | colon adenocarcinoma | Male | <65 | I/II | Unknown | Unknown | SD |
| Page: 1 2 3 4 5 |
Top |
Related drugs of malignant transformation related genes |
| Identification of chemicals and drugs interact with genes involved in malignant transfromation |
| (DGIdb 4.0) |
| Entrez ID | Symbol | Category | Interaction Types | Drug Claim Name | Drug Name | PMIDs |
| 1435 | CSF1 | GROWTH FACTOR, CLINICALLY ACTIONABLE, DRUGGABLE GENOME | Emactuzumab | EMACTUZUMAB | ||
| 1435 | CSF1 | GROWTH FACTOR, CLINICALLY ACTIONABLE, DRUGGABLE GENOME | RG7155 | |||
| 1435 | CSF1 | GROWTH FACTOR, CLINICALLY ACTIONABLE, DRUGGABLE GENOME | PLX73086 | |||
| 1435 | CSF1 | GROWTH FACTOR, CLINICALLY ACTIONABLE, DRUGGABLE GENOME | ACTINOMYCIN D | 3265472,9419789 | ||
| 1435 | CSF1 | GROWTH FACTOR, CLINICALLY ACTIONABLE, DRUGGABLE GENOME | ANTISERUM | 1717026,2546636,8647916,3497819,8889847,3908292,8591991 | ||
| 1435 | CSF1 | GROWTH FACTOR, CLINICALLY ACTIONABLE, DRUGGABLE GENOME | PEXIDARTINIB | PEXIDARTINIB | 26222558 |
| Page: 1 |

Copyright 2023-Present -The University of Texas Health Science Center at Houston |