
|
|||||
|
 | |
| |
| |
| |
| |
| |
|
Gene: AZIN1-AS1 |
Gene summary for AZIN1-AS1 |
| Gene information | Species | Human | Gene symbol | AZIN1-AS1 | Gene ID | 100506753 |
| Gene name | macrophage interferon regulatory lncRNA | |
| Gene Alias | AZIN1-AS1 | |
| Cytomap | 8q22.3 | |
| Gene Type | ncRNA | GO ID | NA | UniProtAcc | NA |
Top |
Malignant transformation analysis |
| Identification of the aberrant gene expression in precancerous and cancerous lesions by comparing the gene expression of stem-like cells in diseased tissues with normal stem cells |
| Entrez ID | Symbol | Replicates | Species | Organ | Tissue | Adj P-value | Log2FC | Malignancy |
| 100506753 | AZIN1-AS1 | LZE2T | Human | Esophagus | ESCC | 4.63e-03 | 4.54e-01 | 0.082 |
| 100506753 | AZIN1-AS1 | LZE24T | Human | Esophagus | ESCC | 6.20e-04 | 1.73e-01 | 0.0596 |
| 100506753 | AZIN1-AS1 | P1T-E | Human | Esophagus | ESCC | 6.53e-06 | 2.47e-01 | 0.0875 |
| 100506753 | AZIN1-AS1 | P2T-E | Human | Esophagus | ESCC | 9.20e-06 | 1.55e-01 | 0.1177 |
| 100506753 | AZIN1-AS1 | P4T-E | Human | Esophagus | ESCC | 1.40e-07 | 1.45e-01 | 0.1323 |
| 100506753 | AZIN1-AS1 | P5T-E | Human | Esophagus | ESCC | 2.06e-08 | 1.69e-01 | 0.1327 |
| 100506753 | AZIN1-AS1 | P9T-E | Human | Esophagus | ESCC | 6.26e-07 | 1.10e-01 | 0.1131 |
| 100506753 | AZIN1-AS1 | P10T-E | Human | Esophagus | ESCC | 3.75e-03 | 9.08e-02 | 0.116 |
| 100506753 | AZIN1-AS1 | P11T-E | Human | Esophagus | ESCC | 1.74e-02 | 1.50e-01 | 0.1426 |
| 100506753 | AZIN1-AS1 | P12T-E | Human | Esophagus | ESCC | 9.56e-08 | 1.48e-01 | 0.1122 |
| 100506753 | AZIN1-AS1 | P16T-E | Human | Esophagus | ESCC | 2.39e-24 | 3.90e-01 | 0.1153 |
| 100506753 | AZIN1-AS1 | P17T-E | Human | Esophagus | ESCC | 1.95e-02 | 1.29e-01 | 0.1278 |
| 100506753 | AZIN1-AS1 | P20T-E | Human | Esophagus | ESCC | 4.25e-04 | 7.64e-02 | 0.1124 |
| 100506753 | AZIN1-AS1 | P21T-E | Human | Esophagus | ESCC | 4.30e-10 | 1.76e-01 | 0.1617 |
| 100506753 | AZIN1-AS1 | P22T-E | Human | Esophagus | ESCC | 6.56e-15 | 2.87e-01 | 0.1236 |
| 100506753 | AZIN1-AS1 | P23T-E | Human | Esophagus | ESCC | 2.03e-09 | 2.65e-01 | 0.108 |
| 100506753 | AZIN1-AS1 | P26T-E | Human | Esophagus | ESCC | 7.98e-13 | 2.23e-01 | 0.1276 |
| 100506753 | AZIN1-AS1 | P27T-E | Human | Esophagus | ESCC | 4.31e-06 | 1.75e-01 | 0.1055 |
| 100506753 | AZIN1-AS1 | P28T-E | Human | Esophagus | ESCC | 4.31e-06 | 1.28e-01 | 0.1149 |
| 100506753 | AZIN1-AS1 | P30T-E | Human | Esophagus | ESCC | 3.22e-07 | 2.43e-01 | 0.137 |
| Page: 1 2 3 |
| Tissue | Expression Dynamics | Abbreviation |
| Esophagus | 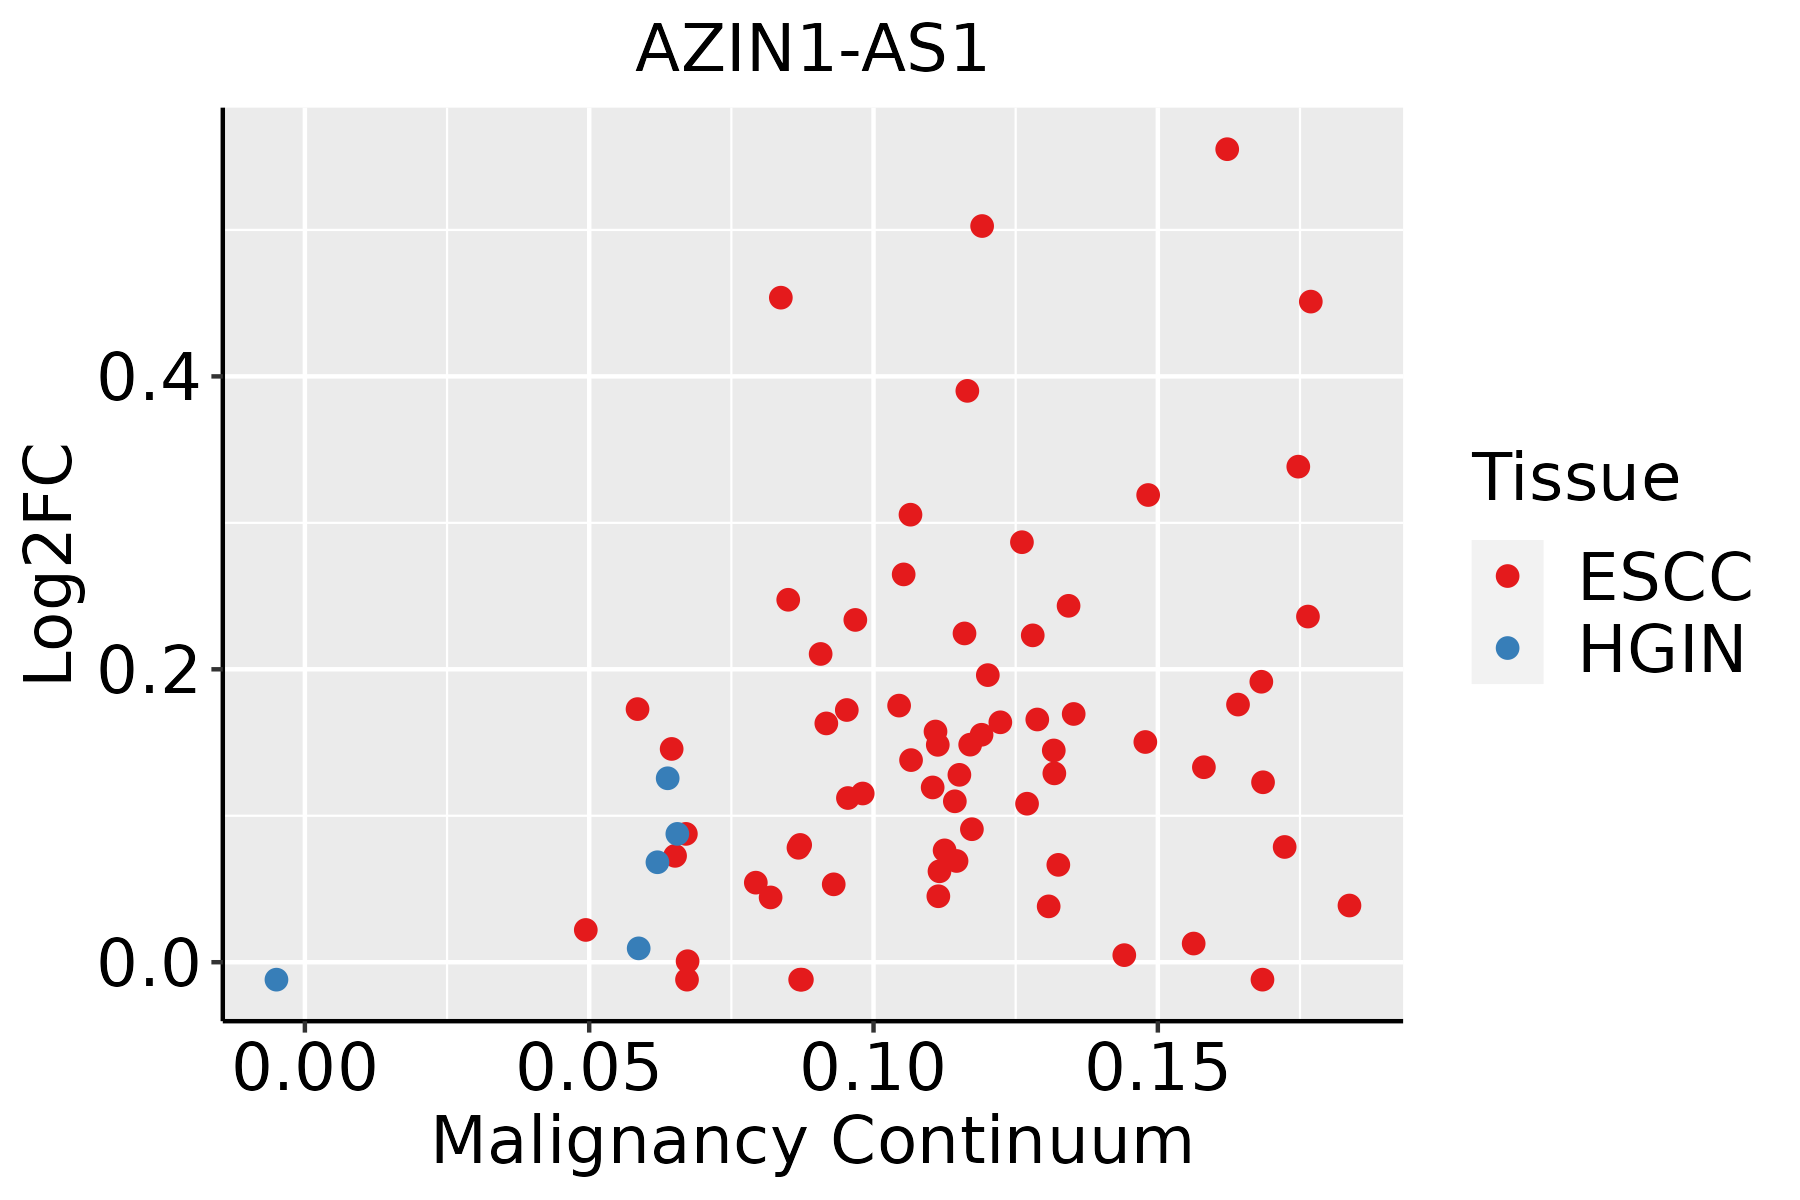 | ESCC: Esophageal squamous cell carcinoma |
| HGIN: High-grade intraepithelial neoplasias | ||
| LGIN: Low-grade intraepithelial neoplasias | ||
| Liver | 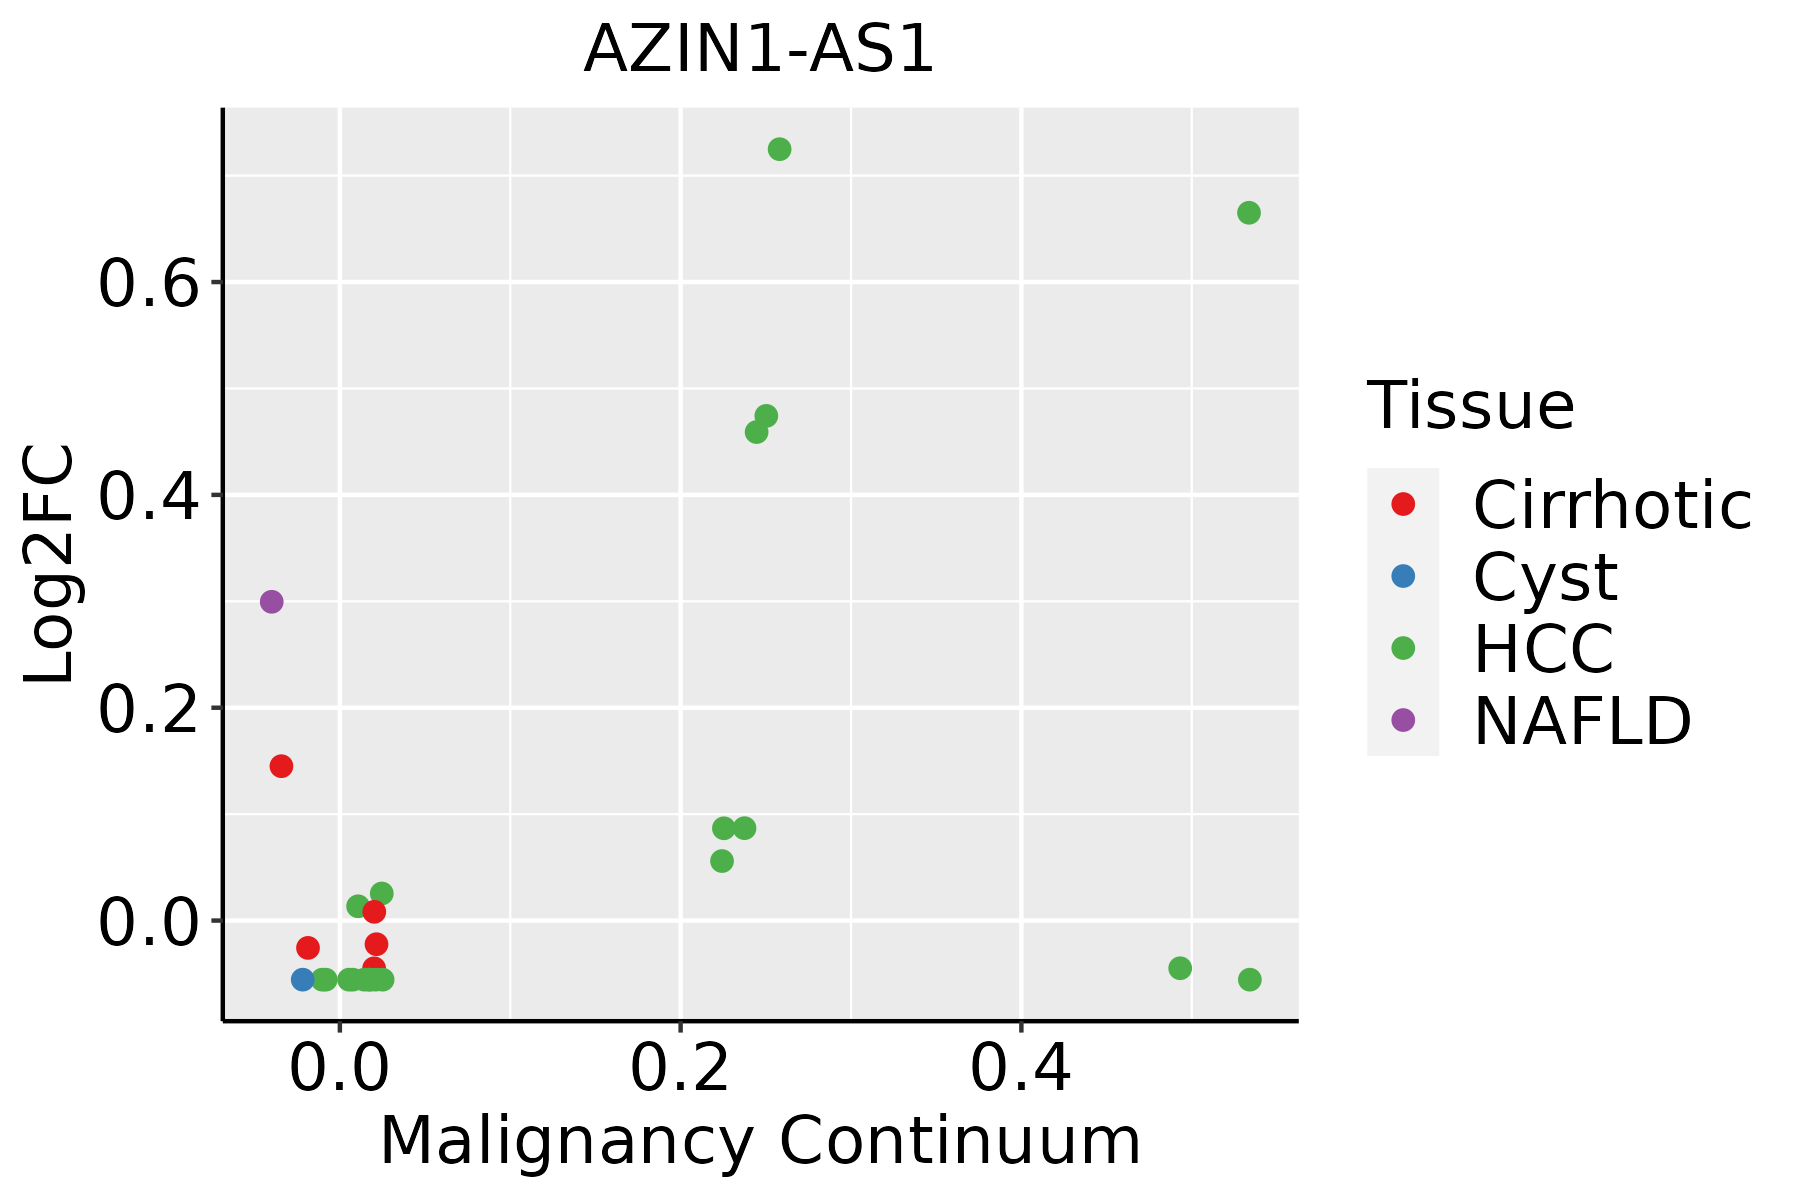 | HCC: Hepatocellular carcinoma |
| NAFLD: Non-alcoholic fatty liver disease | ||
| Lung | 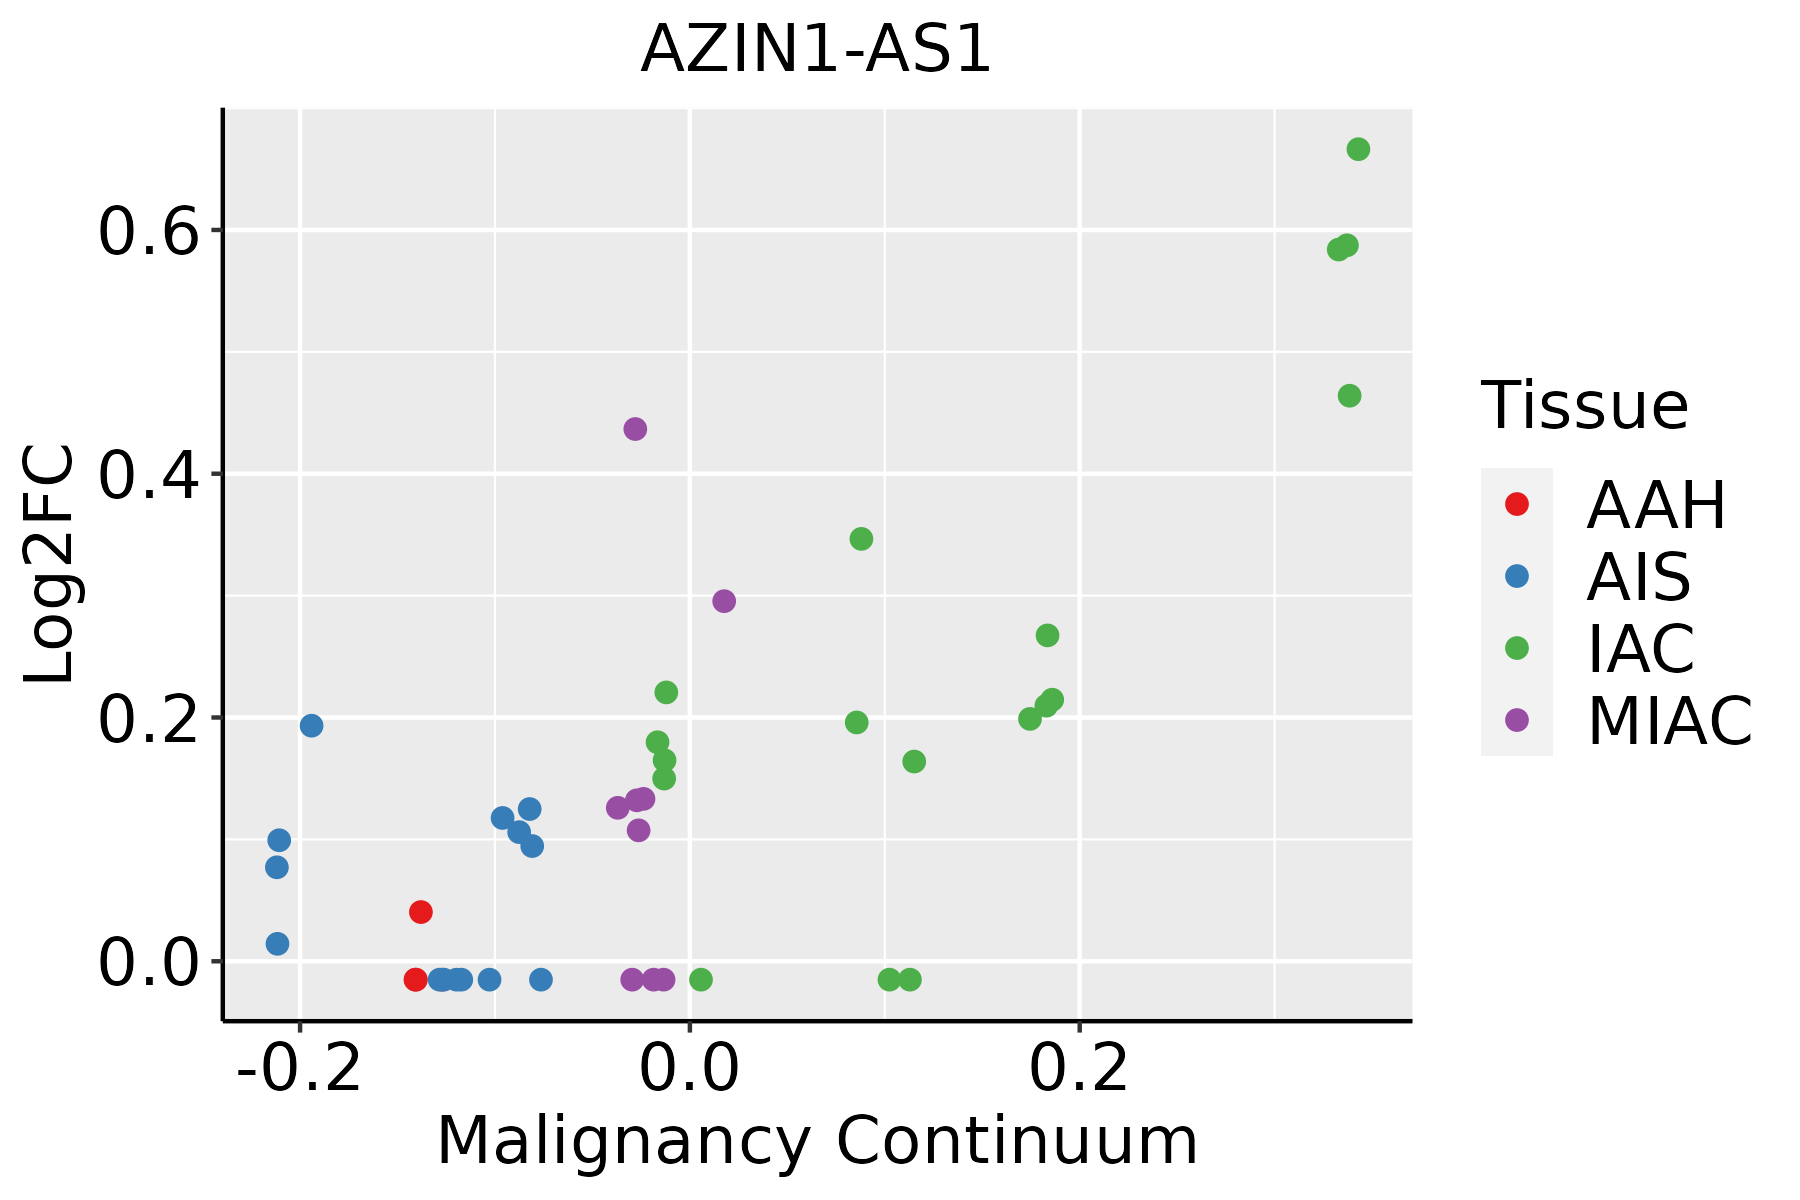 | AAH: Atypical adenomatous hyperplasia |
| AIS: Adenocarcinoma in situ | ||
| IAC: Invasive lung adenocarcinoma | ||
| MIA: Minimally invasive adenocarcinoma |
| ∗log2FC in expression of this searched gene in stem-like cells from each diseased tissue sample relative to stem-like cells in normal samples in each tissue plotted against the malignancy continuum. Samples are colored based on if they are from different disease stage. |
Top |
Malignant transformation related pathway analysis |
| Find out the enriched GO biological processes and KEGG pathways involved in transition from healthy to precancer to cancer |
| Tissue | Disease Stage | Enriched GO biological Processes |
| Stomach | WIM |  |
| Stomach | SIM |  |
| Liver | NAFLD |  |
| Liver | Cirrhotic |  |
| Liver | HCC |  |
| ∗Top 15 enriched GO BP terms are showed in the bar plot of each disease state in each tissue. Each row represents a significant GO biological process which is colored according to the -log10(p.adjust). |
| Page: 1 2 3 4 5 6 7 8 9 |
| GO ID | Tissue | Disease Stage | Description | Gene Ratio | Bg Ratio | pvalue | p.adjust | Count |
| Page: 1 |
| Pathway ID | Tissue | Disease Stage | Description | Gene Ratio | Bg Ratio | pvalue | p.adjust | qvalue | Count |
| Page: 1 |
Top |
Cell-cell communication analysis |
| Identification of potential cell-cell interactions between two cell types and their ligand-receptor pairs for different disease states |
| Ligand | Receptor | LRpair | Pathway | Tissue | Disease Stage |
| Page: 1 |
Top |
Single-cell gene regulatory network inference analysis |
| Find out the significant the regulons (TFs) and the target genes of each regulon across cell types for different disease states |
| TF | Cell Type | Tissue | Disease Stage | Target Gene | RSS | Regulon Activity |
| ∗The dot plots of a searched regulon are shown for all cell subpopulations in each disease state of each tissue based on the regulon specific score inferred using pySCENIC and by calculating the average expression. |
| Page: 1 |
Top |
Somatic mutation of malignant transformation related genes |
| Annotation of somatic variants for genes involved in malignant transformation |
| Hugo Symbol | Variant Class | Variant Classification | dbSNP RS | HGVSc | HGVSp | HGVSp Short | SWISSPROT | BIOTYPE | SIFT | PolyPhen | Tumor Sample Barcode | Tissue | Histology | Sex | Age | Stage | Therapy Types | Drugs | Outcome |
| Page: 1 |
Top |
Related drugs of malignant transformation related genes |
| Identification of chemicals and drugs interact with genes involved in malignant transfromation |
| (DGIdb 4.0) |
| Entrez ID | Symbol | Category | Interaction Types | Drug Claim Name | Drug Name | PMIDs |
| Page: 1 |

Copyright 2023-Present -The University of Texas Health Science Center at Houston |