
|
|||||
|
 | |
| |
| |
| |
| |
| |
|
Gene: ATP6V0E1 |
Gene summary for ATP6V0E1 |
| Gene information | Species | Human | Gene symbol | ATP6V0E1 | Gene ID | 8992 |
| Gene name | ATPase H+ transporting V0 subunit e1 | |
| Gene Alias | ATP6H | |
| Cytomap | 5q35.1 | |
| Gene Type | protein-coding | GO ID | GO:0006810 | UniProtAcc | O15342 |
Top |
Malignant transformation analysis |
| Identification of the aberrant gene expression in precancerous and cancerous lesions by comparing the gene expression of stem-like cells in diseased tissues with normal stem cells |
| Entrez ID | Symbol | Replicates | Species | Organ | Tissue | Adj P-value | Log2FC | Malignancy |
| 8992 | ATP6V0E1 | GSM4909286 | Human | Breast | IDC | 2.01e-36 | -6.07e-01 | 0.1081 |
| 8992 | ATP6V0E1 | GSM4909288 | Human | Breast | IDC | 2.69e-03 | -4.73e-01 | 0.0988 |
| 8992 | ATP6V0E1 | GSM4909294 | Human | Breast | IDC | 5.19e-06 | -2.81e-01 | 0.2022 |
| 8992 | ATP6V0E1 | GSM4909296 | Human | Breast | IDC | 4.37e-14 | -1.85e-01 | 0.1524 |
| 8992 | ATP6V0E1 | GSM4909297 | Human | Breast | IDC | 1.65e-23 | -3.65e-01 | 0.1517 |
| 8992 | ATP6V0E1 | GSM4909298 | Human | Breast | IDC | 5.09e-03 | 1.57e-01 | 0.1551 |
| 8992 | ATP6V0E1 | GSM4909301 | Human | Breast | IDC | 8.85e-03 | -2.50e-01 | 0.1577 |
| 8992 | ATP6V0E1 | GSM4909302 | Human | Breast | IDC | 1.06e-03 | 1.83e-01 | 0.1545 |
| 8992 | ATP6V0E1 | GSM4909308 | Human | Breast | IDC | 3.12e-09 | 3.26e-01 | 0.158 |
| 8992 | ATP6V0E1 | GSM4909309 | Human | Breast | IDC | 4.66e-04 | 1.36e-01 | 0.0483 |
| 8992 | ATP6V0E1 | GSM4909311 | Human | Breast | IDC | 6.18e-52 | -4.53e-01 | 0.1534 |
| 8992 | ATP6V0E1 | GSM4909312 | Human | Breast | IDC | 1.04e-14 | -2.75e-01 | 0.1552 |
| 8992 | ATP6V0E1 | GSM4909319 | Human | Breast | IDC | 2.48e-67 | -5.03e-01 | 0.1563 |
| 8992 | ATP6V0E1 | GSM4909320 | Human | Breast | IDC | 2.64e-06 | -3.53e-01 | 0.1575 |
| 8992 | ATP6V0E1 | GSM4909321 | Human | Breast | IDC | 1.18e-17 | -3.80e-02 | 0.1559 |
| 8992 | ATP6V0E1 | brca1 | Human | Breast | Precancer | 6.52e-30 | 5.60e-01 | -0.0338 |
| 8992 | ATP6V0E1 | brca2 | Human | Breast | Precancer | 1.75e-17 | 4.54e-01 | -0.024 |
| 8992 | ATP6V0E1 | brca3 | Human | Breast | Precancer | 1.77e-18 | 4.32e-01 | -0.0263 |
| 8992 | ATP6V0E1 | brca10 | Human | Breast | Precancer | 1.22e-09 | 3.43e-01 | -0.0029 |
| 8992 | ATP6V0E1 | M2 | Human | Breast | IDC | 3.17e-03 | -3.69e-01 | 0.21 |
| Page: 1 2 3 4 5 6 7 8 9 10 11 12 13 |
| Tissue | Expression Dynamics | Abbreviation |
| Breast |  | IDC: Invasive ductal carcinoma |
| DCIS: Ductal carcinoma in situ | ||
| Precancer(BRCA1-mut): Precancerous lesion from BRCA1 mutation carriers | ||
| Cervix | 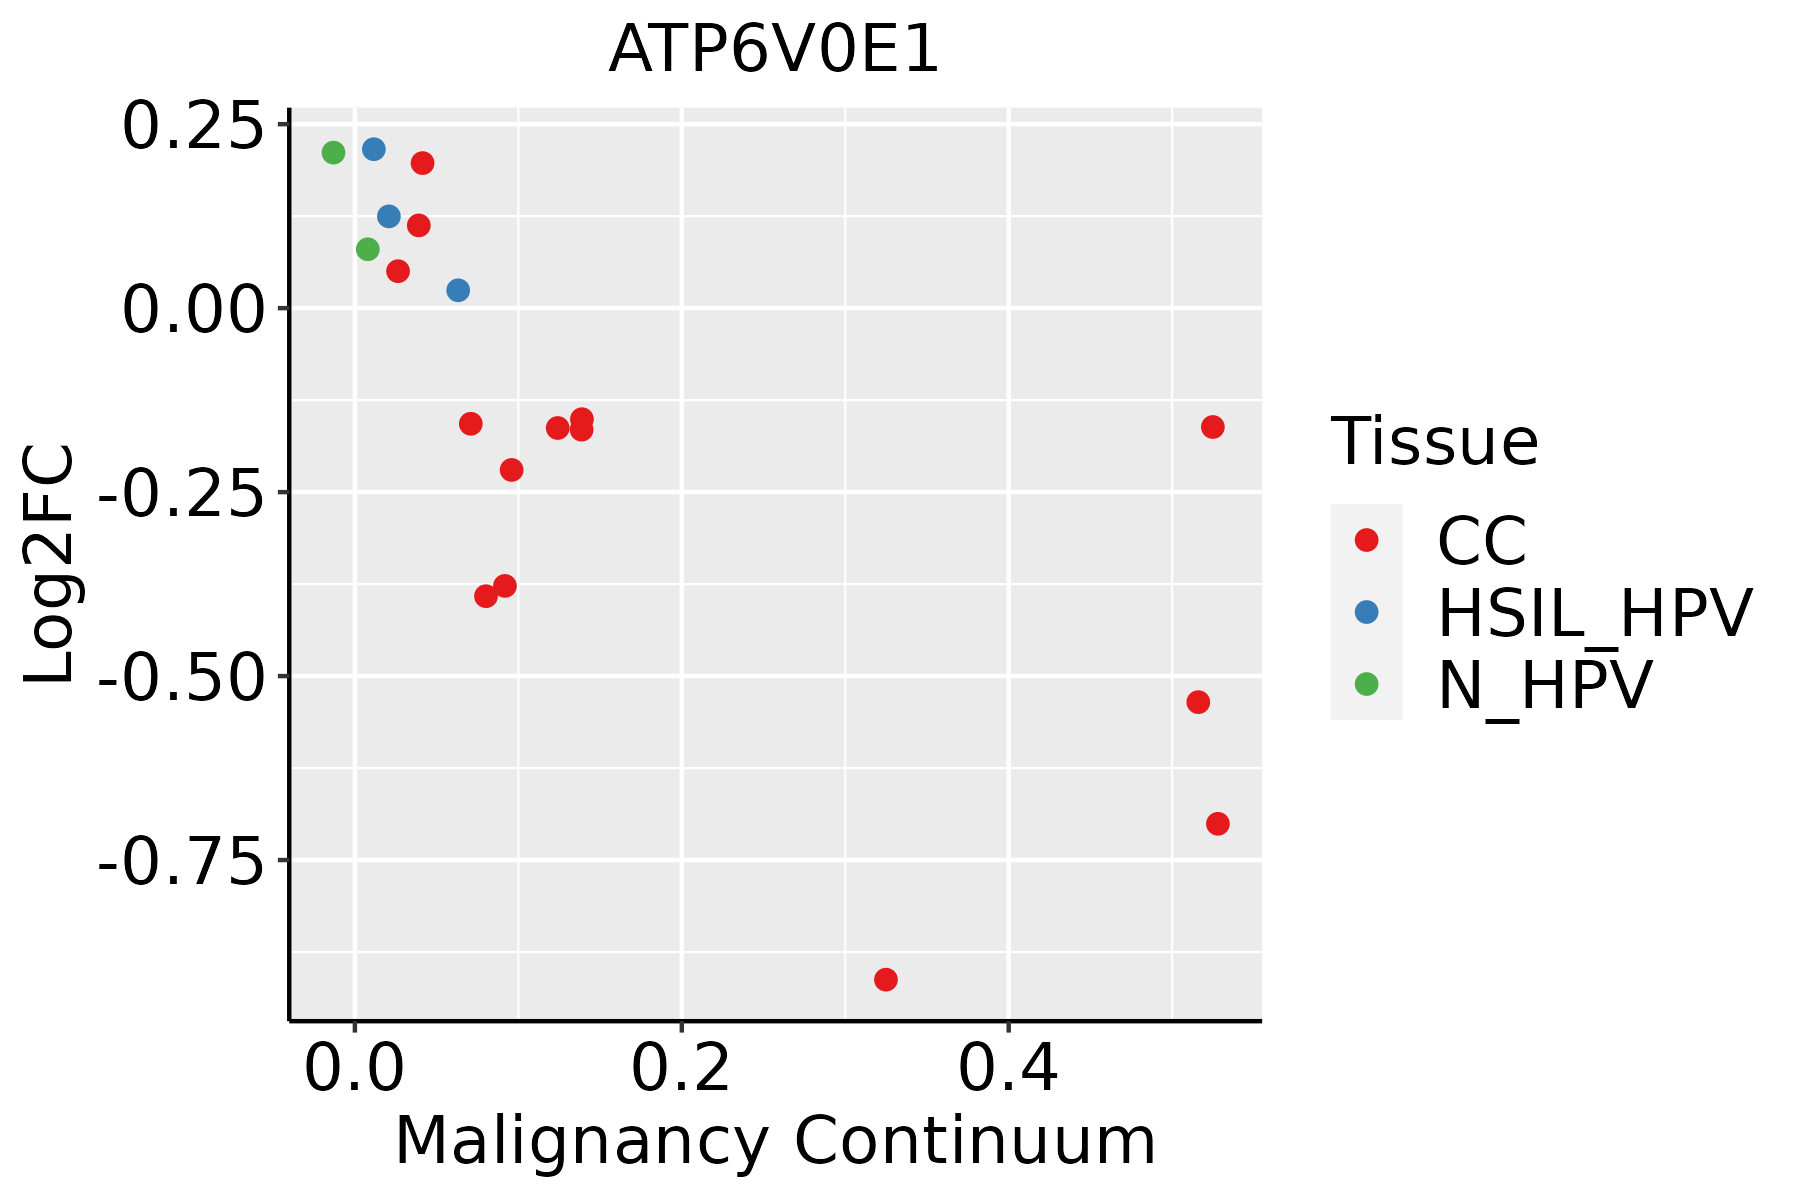 | CC: Cervix cancer |
| HSIL_HPV: HPV-infected high-grade squamous intraepithelial lesions | ||
| N_HPV: HPV-infected normal cervix | ||
| Colorectum (GSE201348) |  | FAP: Familial adenomatous polyposis |
| CRC: Colorectal cancer | ||
| Colorectum (HTA11) |  | AD: Adenomas |
| SER: Sessile serrated lesions | ||
| MSI-H: Microsatellite-high colorectal cancer | ||
| MSS: Microsatellite stable colorectal cancer | ||
| Endometrium |  | AEH: Atypical endometrial hyperplasia |
| EEC: Endometrioid Cancer | ||
| Esophagus |  | ESCC: Esophageal squamous cell carcinoma |
| HGIN: High-grade intraepithelial neoplasias | ||
| LGIN: Low-grade intraepithelial neoplasias | ||
| Liver | 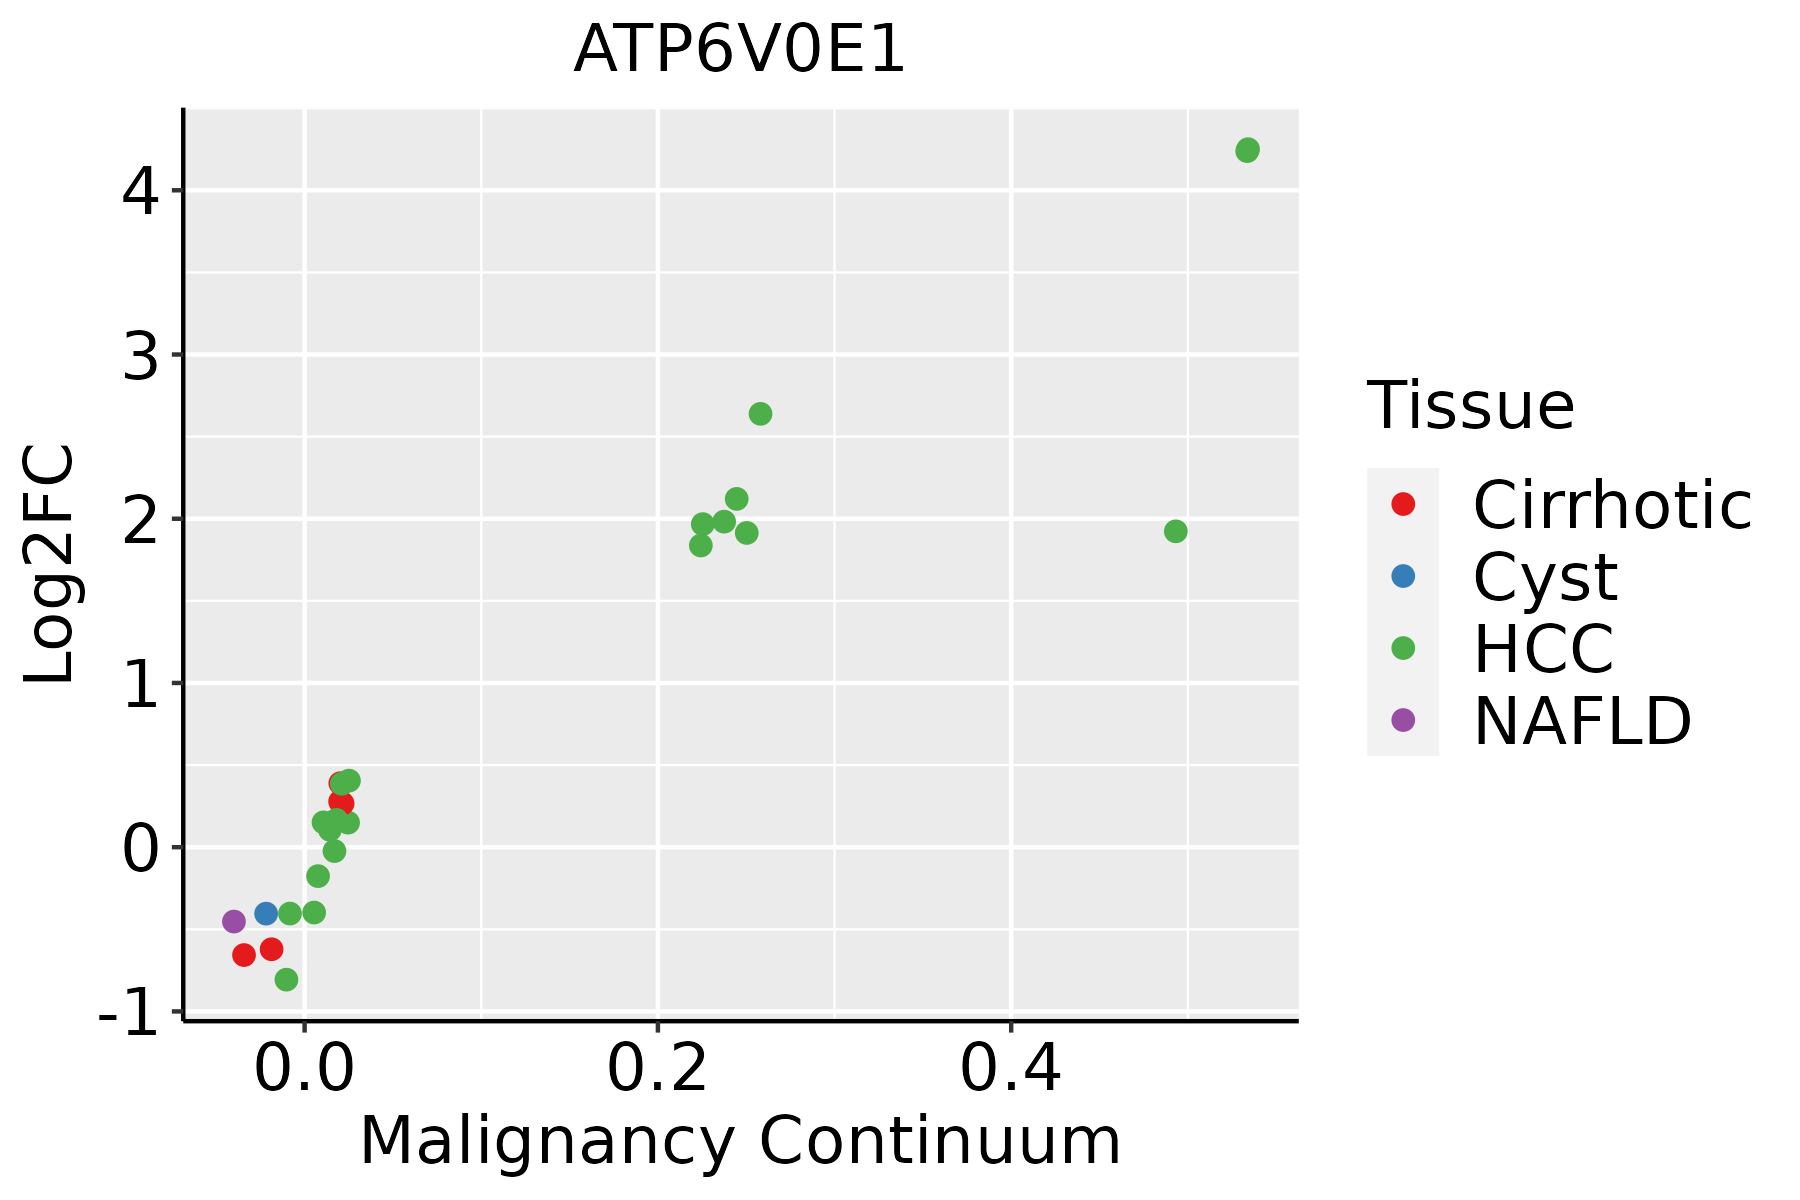 | HCC: Hepatocellular carcinoma |
| NAFLD: Non-alcoholic fatty liver disease | ||
| Oral Cavity |  | EOLP: Erosive Oral lichen planus |
| LP: leukoplakia | ||
| NEOLP: Non-erosive oral lichen planus | ||
| OSCC: Oral squamous cell carcinoma | ||
| Prostate | 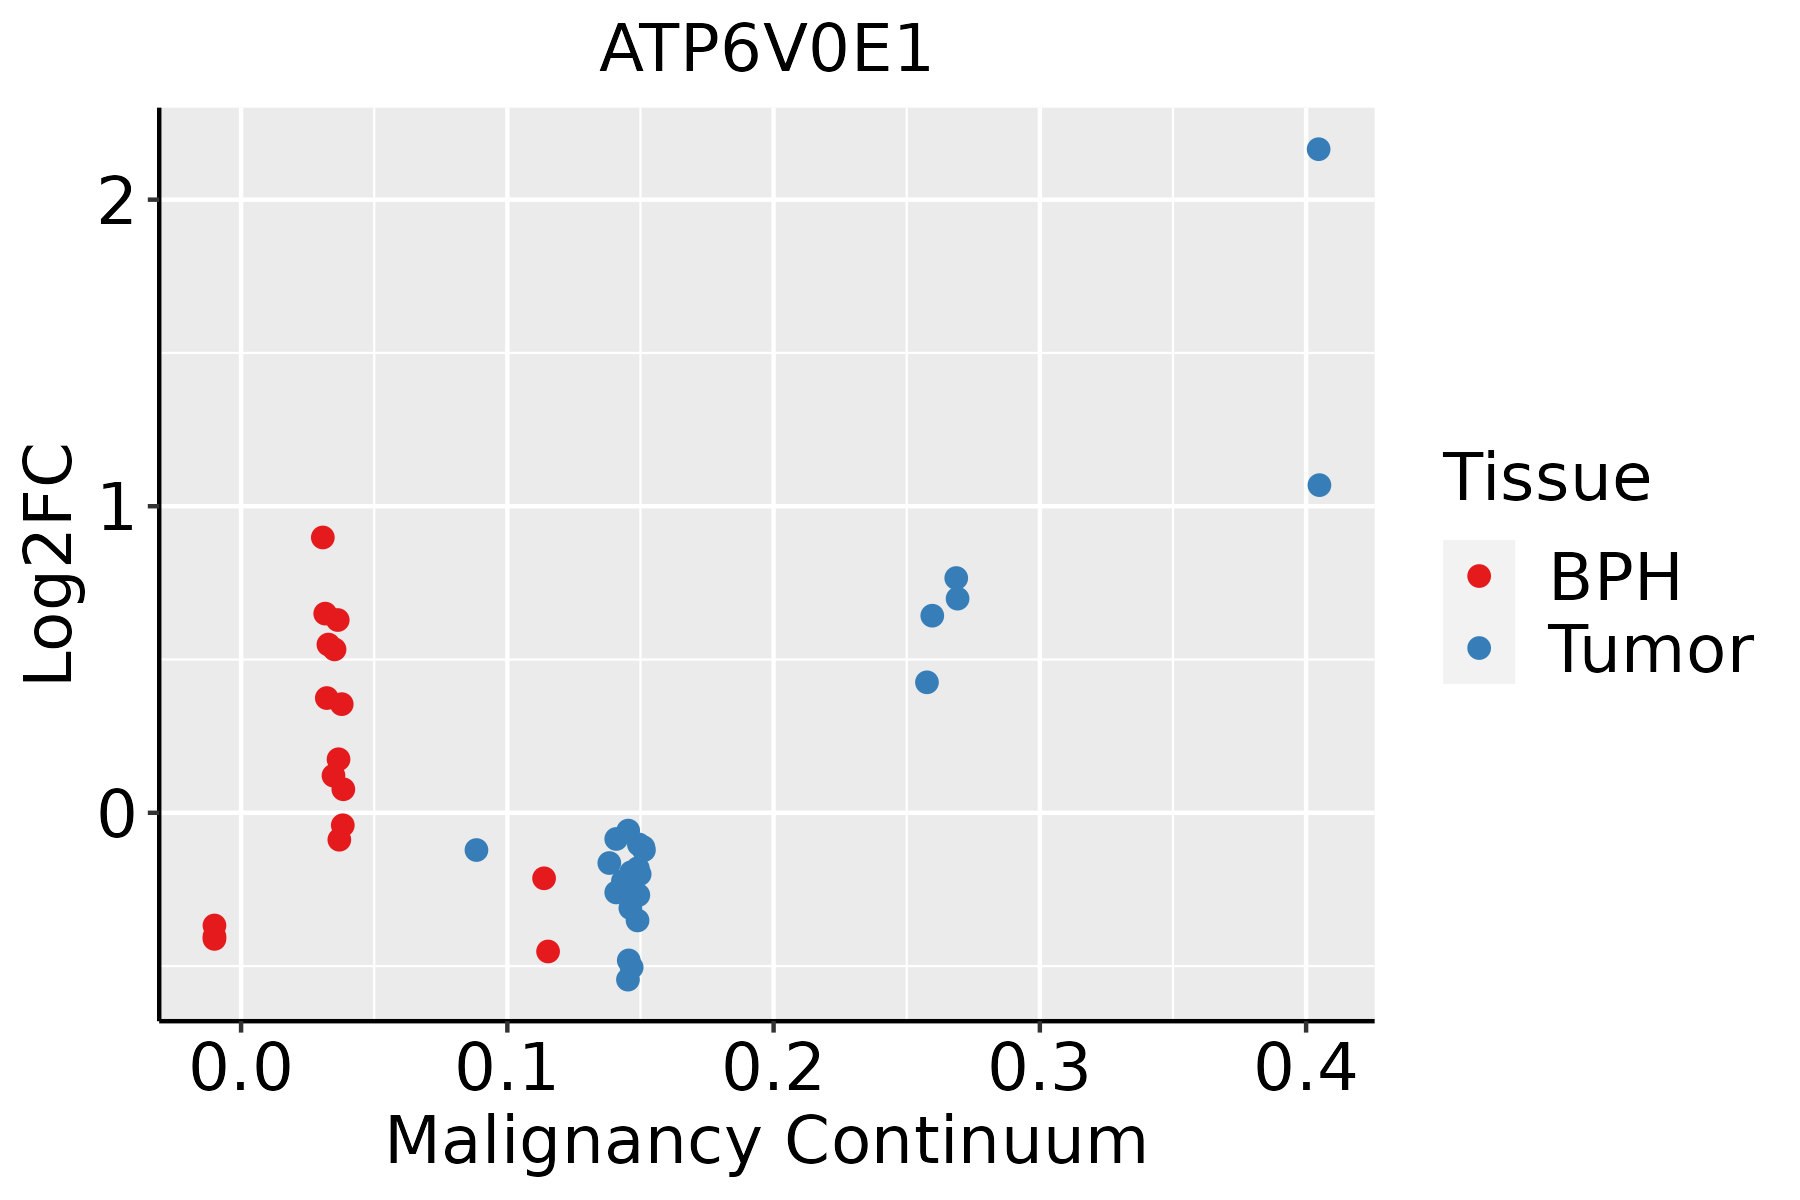 | BPH: Benign Prostatic Hyperplasia |
| Skin | 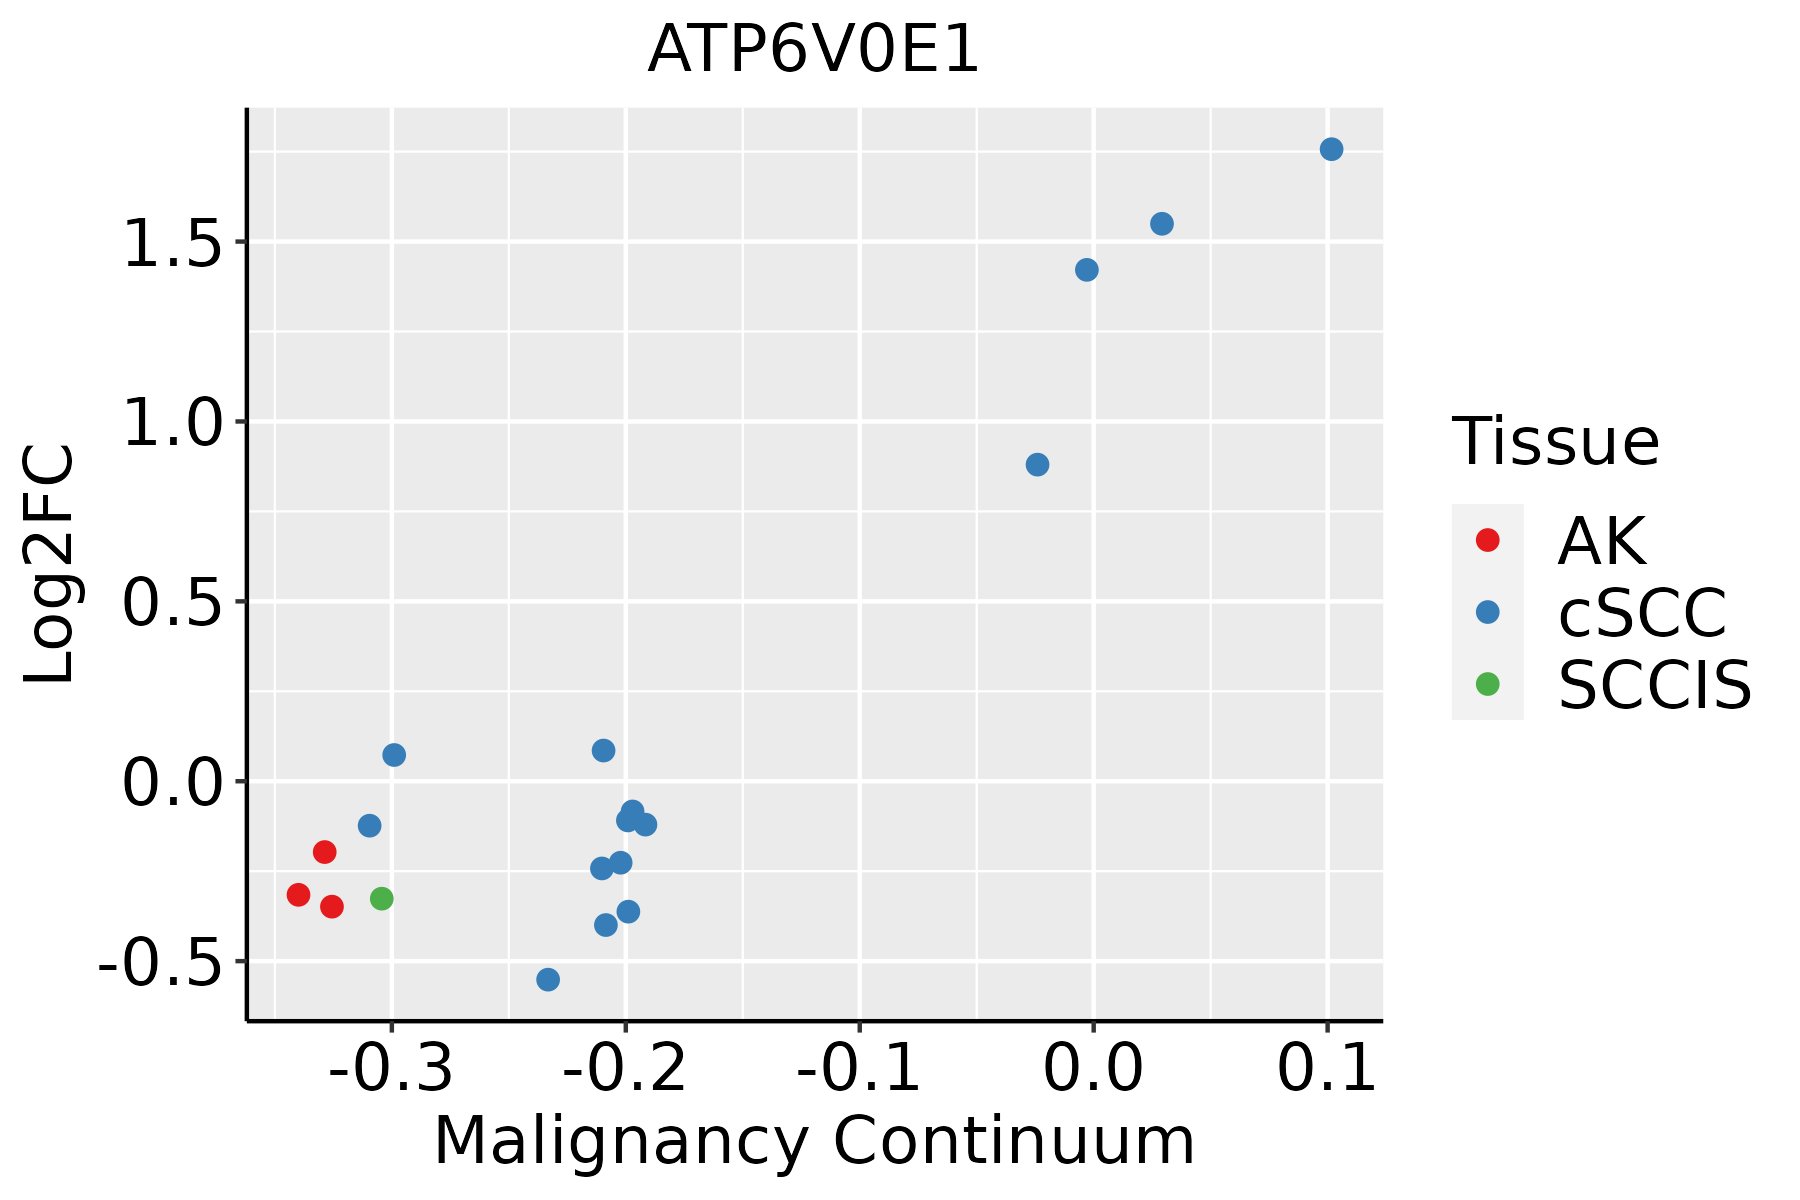 | AK: Actinic keratosis |
| cSCC: Cutaneous squamous cell carcinoma | ||
| SCCIS:squamous cell carcinoma in situ | ||
| Thyroid | 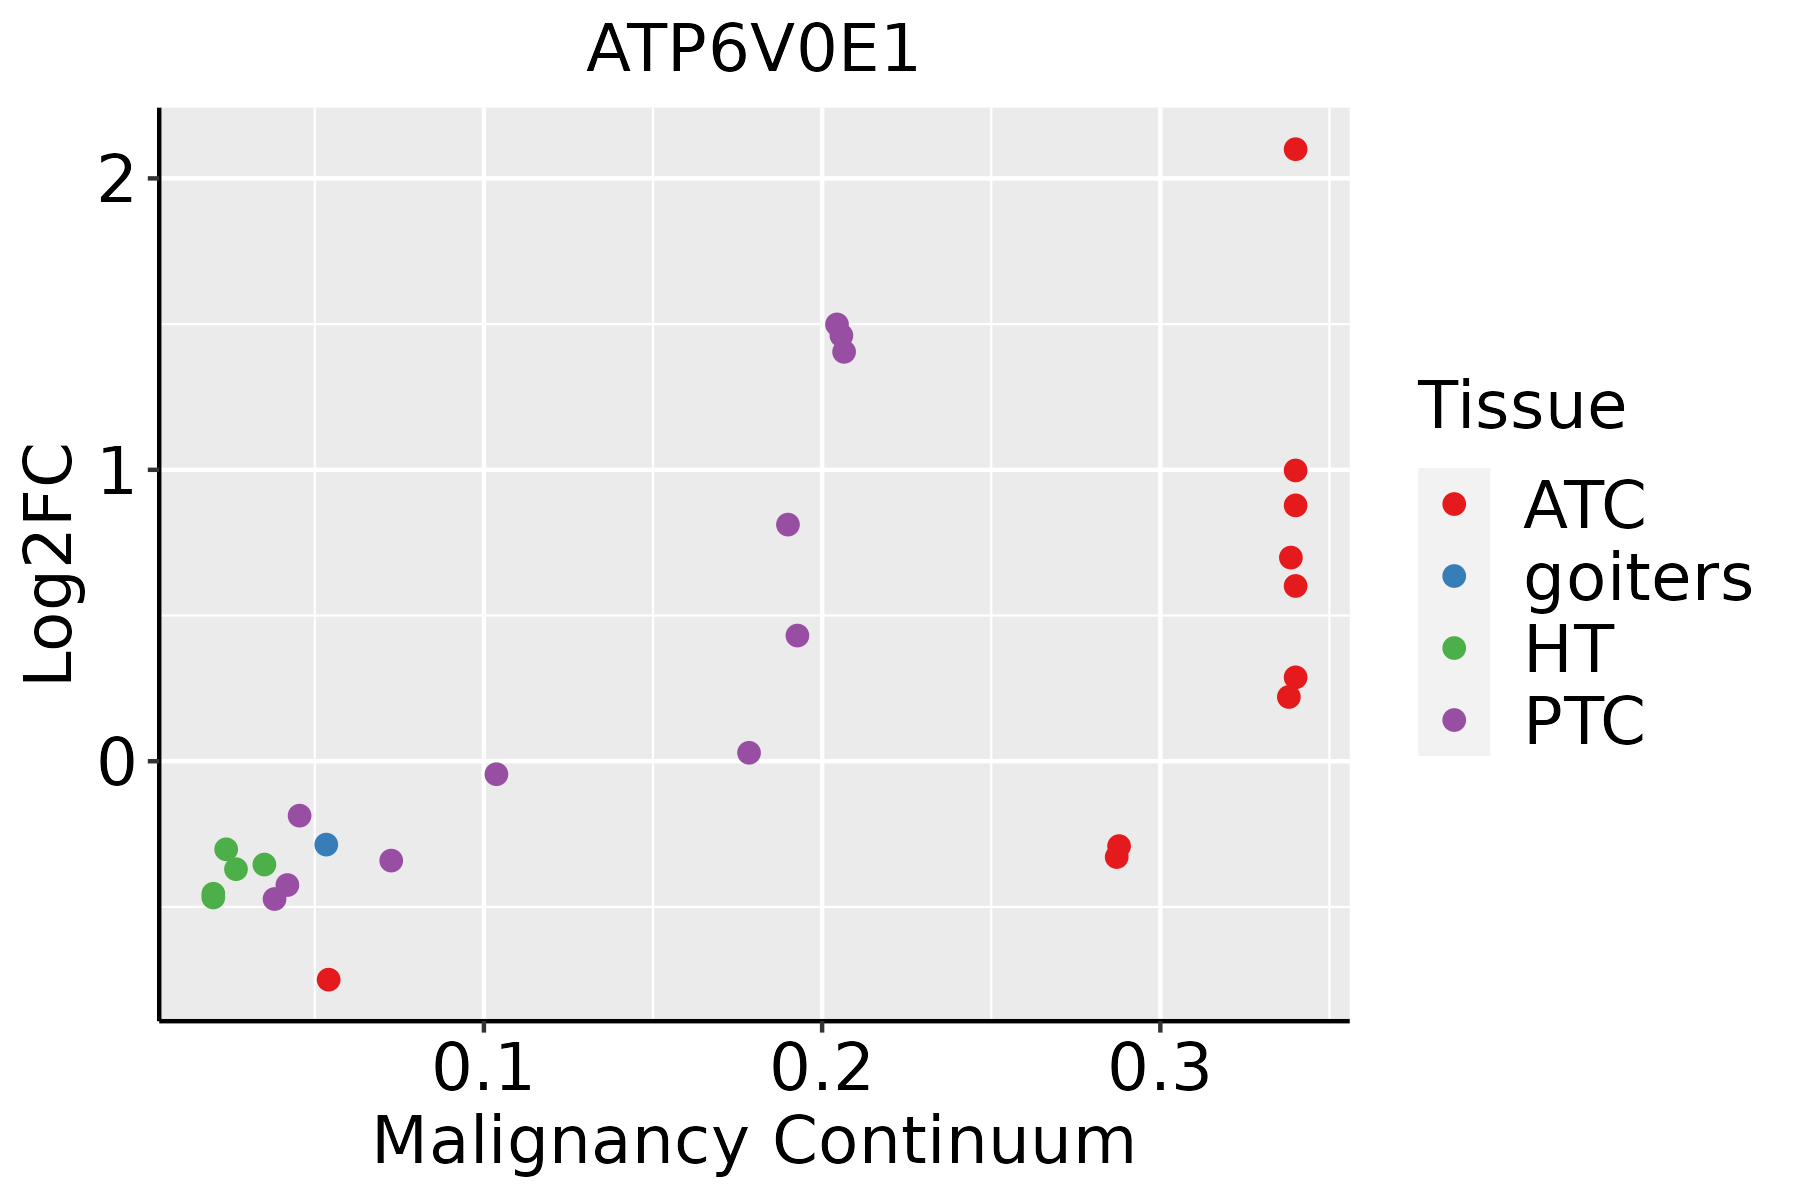 | ATC: Anaplastic thyroid cancer |
| HT: Hashimoto's thyroiditis | ||
| PTC: Papillary thyroid cancer |
| ∗log2FC in expression of this searched gene in stem-like cells from each diseased tissue sample relative to stem-like cells in normal samples in each tissue plotted against the malignancy continuum. Samples are colored based on if they are from different disease stage. |
Top |
Malignant transformation related pathway analysis |
| Find out the enriched GO biological processes and KEGG pathways involved in transition from healthy to precancer to cancer |
| Tissue | Disease Stage | Enriched GO biological Processes |
| Stomach | WIM |  |
| Stomach | SIM |  |
| Liver | NAFLD |  |
| Liver | Cirrhotic |  |
| Liver | HCC |  |
| ∗Top 15 enriched GO BP terms are showed in the bar plot of each disease state in each tissue. Each row represents a significant GO biological process which is colored according to the -log10(p.adjust). |
| Page: 1 2 3 4 5 6 7 8 9 |
| GO ID | Tissue | Disease Stage | Description | Gene Ratio | Bg Ratio | pvalue | p.adjust | Count |
| GO:19026008 | Breast | Precancer | proton transmembrane transport | 39/1080 | 157/18723 | 4.18e-15 | 1.18e-12 | 39 |
| GO:00300046 | Breast | Precancer | cellular monovalent inorganic cation homeostasis | 13/1080 | 103/18723 | 6.26e-03 | 4.40e-02 | 13 |
| GO:190260012 | Breast | IDC | proton transmembrane transport | 40/1434 | 157/18723 | 7.34e-12 | 1.34e-09 | 40 |
| GO:190260022 | Breast | DCIS | proton transmembrane transport | 40/1390 | 157/18723 | 2.77e-12 | 5.80e-10 | 40 |
| GO:19026009 | Cervix | CC | proton transmembrane transport | 39/2311 | 157/18723 | 1.23e-05 | 2.57e-04 | 39 |
| GO:00162367 | Cervix | CC | macroautophagy | 58/2311 | 291/18723 | 1.40e-04 | 1.70e-03 | 58 |
| GO:00105067 | Cervix | CC | regulation of autophagy | 61/2311 | 317/18723 | 2.61e-04 | 2.87e-03 | 61 |
| GO:190260023 | Cervix | N_HPV | proton transmembrane transport | 16/534 | 157/18723 | 1.11e-05 | 3.76e-04 | 16 |
| GO:1902600 | Colorectum | AD | proton transmembrane transport | 66/3918 | 157/18723 | 1.59e-09 | 1.17e-07 | 66 |
| GO:0010506 | Colorectum | AD | regulation of autophagy | 111/3918 | 317/18723 | 3.57e-09 | 2.35e-07 | 111 |
| GO:0016236 | Colorectum | AD | macroautophagy | 103/3918 | 291/18723 | 6.76e-09 | 4.15e-07 | 103 |
| GO:0016241 | Colorectum | AD | regulation of macroautophagy | 50/3918 | 141/18723 | 4.55e-05 | 7.92e-04 | 50 |
| GO:0030004 | Colorectum | AD | cellular monovalent inorganic cation homeostasis | 36/3918 | 103/18723 | 6.80e-04 | 6.95e-03 | 36 |
| GO:0030641 | Colorectum | AD | regulation of cellular pH | 29/3918 | 81/18723 | 1.42e-03 | 1.22e-02 | 29 |
| GO:0051453 | Colorectum | AD | regulation of intracellular pH | 26/3918 | 75/18723 | 4.04e-03 | 2.82e-02 | 26 |
| GO:0006885 | Colorectum | AD | regulation of pH | 30/3918 | 91/18723 | 4.95e-03 | 3.32e-02 | 30 |
| GO:0055067 | Colorectum | AD | monovalent inorganic cation homeostasis | 45/3918 | 151/18723 | 6.19e-03 | 3.88e-02 | 45 |
| GO:19026001 | Colorectum | SER | proton transmembrane transport | 60/2897 | 157/18723 | 3.12e-12 | 7.08e-10 | 60 |
| GO:00162361 | Colorectum | SER | macroautophagy | 79/2897 | 291/18723 | 1.97e-07 | 1.10e-05 | 79 |
| GO:00300041 | Colorectum | SER | cellular monovalent inorganic cation homeostasis | 31/2897 | 103/18723 | 1.31e-04 | 2.66e-03 | 31 |
| Page: 1 2 3 4 5 6 |
| Pathway ID | Tissue | Disease Stage | Description | Gene Ratio | Bg Ratio | pvalue | p.adjust | qvalue | Count |
| hsa0019016 | Breast | Precancer | Oxidative phosphorylation | 59/684 | 134/8465 | 6.15e-30 | 3.24e-28 | 2.48e-28 | 59 |
| hsa0511014 | Breast | Precancer | Vibrio cholerae infection | 14/684 | 50/8465 | 2.67e-05 | 2.64e-04 | 2.02e-04 | 14 |
| hsa0414518 | Breast | Precancer | Phagosome | 27/684 | 152/8465 | 7.37e-05 | 6.85e-04 | 5.25e-04 | 27 |
| hsa0532312 | Breast | Precancer | Rheumatoid arthritis | 19/684 | 93/8465 | 1.30e-04 | 1.14e-03 | 8.73e-04 | 19 |
| hsa051206 | Breast | Precancer | Epithelial cell signaling in Helicobacter pylori infection | 14/684 | 70/8465 | 1.21e-03 | 7.99e-03 | 6.12e-03 | 14 |
| hsa0019017 | Breast | Precancer | Oxidative phosphorylation | 59/684 | 134/8465 | 6.15e-30 | 3.24e-28 | 2.48e-28 | 59 |
| hsa0511015 | Breast | Precancer | Vibrio cholerae infection | 14/684 | 50/8465 | 2.67e-05 | 2.64e-04 | 2.02e-04 | 14 |
| hsa0414519 | Breast | Precancer | Phagosome | 27/684 | 152/8465 | 7.37e-05 | 6.85e-04 | 5.25e-04 | 27 |
| hsa0532313 | Breast | Precancer | Rheumatoid arthritis | 19/684 | 93/8465 | 1.30e-04 | 1.14e-03 | 8.73e-04 | 19 |
| hsa0512013 | Breast | Precancer | Epithelial cell signaling in Helicobacter pylori infection | 14/684 | 70/8465 | 1.21e-03 | 7.99e-03 | 6.12e-03 | 14 |
| hsa0019023 | Breast | IDC | Oxidative phosphorylation | 62/867 | 134/8465 | 4.78e-27 | 2.59e-25 | 1.94e-25 | 62 |
| hsa0511022 | Breast | IDC | Vibrio cholerae infection | 17/867 | 50/8465 | 4.82e-06 | 6.82e-05 | 5.10e-05 | 17 |
| hsa0414522 | Breast | IDC | Phagosome | 34/867 | 152/8465 | 8.00e-06 | 9.99e-05 | 7.48e-05 | 34 |
| hsa0532321 | Breast | IDC | Rheumatoid arthritis | 21/867 | 93/8465 | 3.69e-04 | 3.15e-03 | 2.36e-03 | 21 |
| hsa0512022 | Breast | IDC | Epithelial cell signaling in Helicobacter pylori infection | 16/867 | 70/8465 | 1.56e-03 | 1.13e-02 | 8.42e-03 | 16 |
| hsa0019033 | Breast | IDC | Oxidative phosphorylation | 62/867 | 134/8465 | 4.78e-27 | 2.59e-25 | 1.94e-25 | 62 |
| hsa0511032 | Breast | IDC | Vibrio cholerae infection | 17/867 | 50/8465 | 4.82e-06 | 6.82e-05 | 5.10e-05 | 17 |
| hsa0414532 | Breast | IDC | Phagosome | 34/867 | 152/8465 | 8.00e-06 | 9.99e-05 | 7.48e-05 | 34 |
| hsa0532331 | Breast | IDC | Rheumatoid arthritis | 21/867 | 93/8465 | 3.69e-04 | 3.15e-03 | 2.36e-03 | 21 |
| hsa0512032 | Breast | IDC | Epithelial cell signaling in Helicobacter pylori infection | 16/867 | 70/8465 | 1.56e-03 | 1.13e-02 | 8.42e-03 | 16 |
| Page: 1 2 3 4 5 6 7 8 |
Top |
Cell-cell communication analysis |
| Identification of potential cell-cell interactions between two cell types and their ligand-receptor pairs for different disease states |
| Ligand | Receptor | LRpair | Pathway | Tissue | Disease Stage |
| Page: 1 |
Top |
Single-cell gene regulatory network inference analysis |
| Find out the significant the regulons (TFs) and the target genes of each regulon across cell types for different disease states |
| TF | Cell Type | Tissue | Disease Stage | Target Gene | RSS | Regulon Activity |
| ∗The dot plots of a searched regulon are shown for all cell subpopulations in each disease state of each tissue based on the regulon specific score inferred using pySCENIC and by calculating the average expression. |
| Page: 1 |
Top |
Somatic mutation of malignant transformation related genes |
| Annotation of somatic variants for genes involved in malignant transformation |
| Hugo Symbol | Variant Class | Variant Classification | dbSNP RS | HGVSc | HGVSp | HGVSp Short | SWISSPROT | BIOTYPE | SIFT | PolyPhen | Tumor Sample Barcode | Tissue | Histology | Sex | Age | Stage | Therapy Types | Drugs | Outcome |
| ATP6V0E1 | SNV | Missense_Mutation | novel | c.148N>T | p.Leu50Phe | p.L50F | O15342 | protein_coding | deleterious(0) | probably_damaging(0.954) | TCGA-AN-A046-01 | Breast | breast invasive carcinoma | Female | >=65 | I/II | Unknown | Unknown | SD |
| ATP6V0E1 | SNV | Missense_Mutation | c.10C>G | p.His4Asp | p.H4D | O15342 | protein_coding | tolerated(0.49) | benign(0.013) | TCGA-AO-A0JE-01 | Breast | breast invasive carcinoma | Female | <65 | III/IV | Chemotherapy | doxorubicin | SD | |
| ATP6V0E1 | SNV | Missense_Mutation | novel | c.143N>A | p.Cys48Tyr | p.C48Y | O15342 | protein_coding | deleterious(0) | probably_damaging(0.997) | TCGA-VQ-A8P2-01 | Stomach | stomach adenocarcinoma | Male | >=65 | III/IV | Unspecific | Complete Response | |
| ATP6V0E1 | SNV | Missense_Mutation | c.16C>G | p.Leu6Val | p.L6V | O15342 | protein_coding | tolerated(0.09) | benign(0.139) | TCGA-EL-A3GS-01 | Thyroid | thyroid carcinoma | Female | <65 | I/II | Unknown | Unknown | SD |
| Page: 1 |
Top |
Related drugs of malignant transformation related genes |
| Identification of chemicals and drugs interact with genes involved in malignant transfromation |
| (DGIdb 4.0) |
| Entrez ID | Symbol | Category | Interaction Types | Drug Claim Name | Drug Name | PMIDs |
| Page: 1 |

Copyright 2023-Present -The University of Texas Health Science Center at Houston |