
|
|||||
|
 | |
| |
| |
| |
| |
| |
|
Gene: AOC1 |
Gene summary for AOC1 |
| Gene information | Species | Human | Gene symbol | AOC1 | Gene ID | 26 |
| Gene name | amine oxidase copper containing 1 | |
| Gene Alias | ABP | |
| Cytomap | 7q36.1 | |
| Gene Type | protein-coding | GO ID | GO:0006576 | UniProtAcc | P19801 |
Top |
Malignant transformation analysis |
| Identification of the aberrant gene expression in precancerous and cancerous lesions by comparing the gene expression of stem-like cells in diseased tissues with normal stem cells |
| Entrez ID | Symbol | Replicates | Species | Organ | Tissue | Adj P-value | Log2FC | Malignancy |
| 26 | AOC1 | HTA11_3410_2000001011 | Human | Colorectum | AD | 2.34e-05 | 2.48e-01 | 0.0155 |
| 26 | AOC1 | HTA11_2487_2000001011 | Human | Colorectum | SER | 3.25e-40 | 1.54e+00 | -0.1808 |
| 26 | AOC1 | HTA11_1938_2000001011 | Human | Colorectum | AD | 1.45e-22 | 1.07e+00 | -0.0811 |
| 26 | AOC1 | HTA11_78_2000001011 | Human | Colorectum | AD | 2.06e-30 | 1.11e+00 | -0.1088 |
| 26 | AOC1 | HTA11_347_2000001011 | Human | Colorectum | AD | 3.91e-54 | 1.45e+00 | -0.1954 |
| 26 | AOC1 | HTA11_411_2000001011 | Human | Colorectum | SER | 1.05e-14 | 2.03e+00 | -0.2602 |
| 26 | AOC1 | HTA11_2112_2000001011 | Human | Colorectum | SER | 2.15e-18 | 1.64e+00 | -0.2196 |
| 26 | AOC1 | HTA11_3361_2000001011 | Human | Colorectum | AD | 5.79e-24 | 1.26e+00 | -0.1207 |
| 26 | AOC1 | HTA11_83_2000001011 | Human | Colorectum | SER | 1.52e-20 | 1.21e+00 | -0.1526 |
| 26 | AOC1 | HTA11_696_2000001011 | Human | Colorectum | AD | 2.00e-65 | 1.65e+00 | -0.1464 |
| 26 | AOC1 | HTA11_866_2000001011 | Human | Colorectum | AD | 5.03e-24 | 8.09e-01 | -0.1001 |
| 26 | AOC1 | HTA11_1391_2000001011 | Human | Colorectum | AD | 2.90e-22 | 1.00e+00 | -0.059 |
| 26 | AOC1 | HTA11_2992_2000001011 | Human | Colorectum | SER | 2.20e-12 | 1.36e+00 | -0.1706 |
| 26 | AOC1 | HTA11_5212_2000001011 | Human | Colorectum | AD | 3.59e-27 | 2.09e+00 | -0.2061 |
| 26 | AOC1 | HTA11_5216_2000001011 | Human | Colorectum | SER | 1.48e-09 | 1.41e+00 | -0.1462 |
| 26 | AOC1 | HTA11_546_2000001011 | Human | Colorectum | AD | 1.34e-06 | 7.39e-01 | -0.0842 |
| 26 | AOC1 | HTA11_866_3004761011 | Human | Colorectum | AD | 4.97e-05 | 3.69e-01 | 0.096 |
| 26 | AOC1 | HTA11_10623_2000001011 | Human | Colorectum | AD | 1.13e-05 | 6.83e-01 | -0.0177 |
| 26 | AOC1 | HTA11_6818_2000001011 | Human | Colorectum | AD | 5.20e-03 | 4.77e-01 | 0.0112 |
| 26 | AOC1 | HTA11_7469_2000001011 | Human | Colorectum | AD | 6.13e-04 | 8.27e-01 | -0.0124 |
| Page: 1 2 3 |
| Tissue | Expression Dynamics | Abbreviation |
| Colorectum (GSE201348) |  | FAP: Familial adenomatous polyposis |
| CRC: Colorectal cancer | ||
| Colorectum (HTA11) |  | AD: Adenomas |
| SER: Sessile serrated lesions | ||
| MSI-H: Microsatellite-high colorectal cancer | ||
| MSS: Microsatellite stable colorectal cancer | ||
| Endometrium | 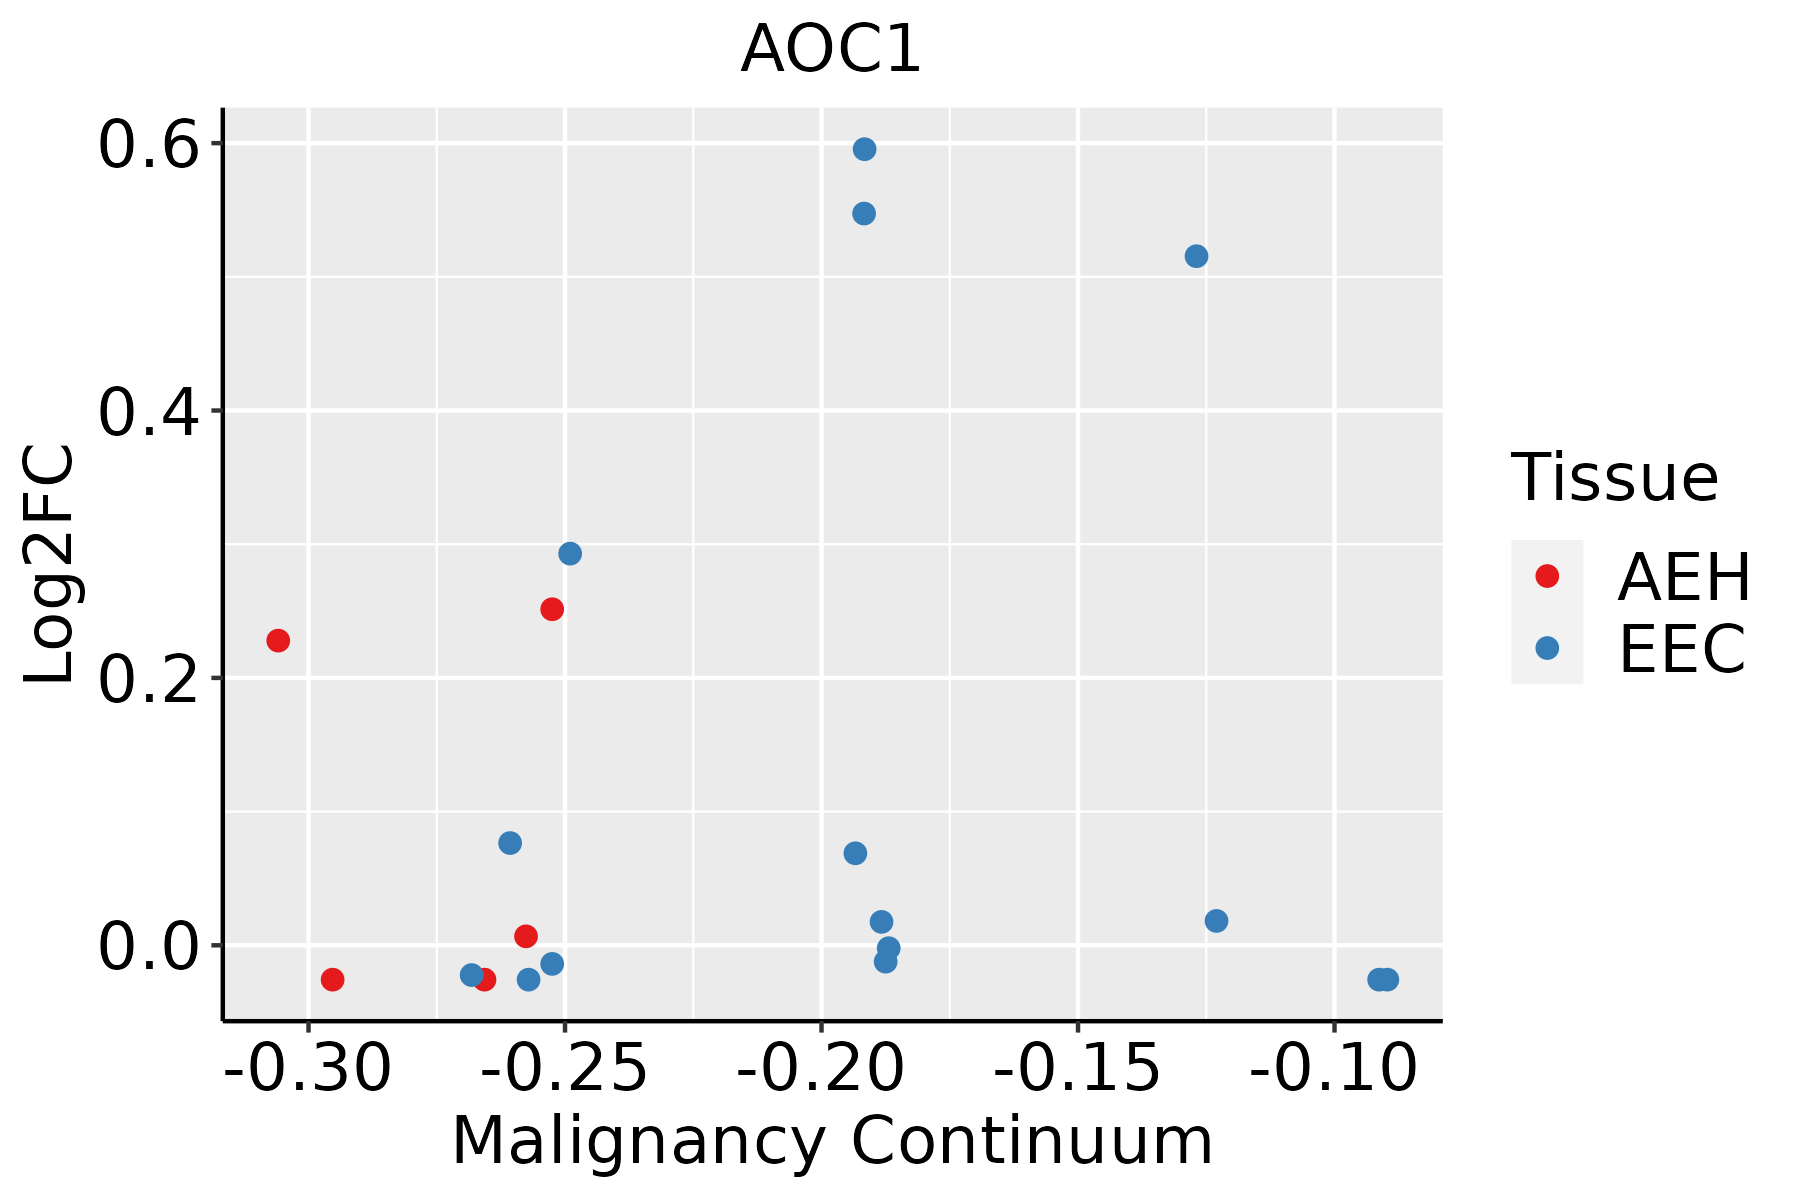 | AEH: Atypical endometrial hyperplasia |
| EEC: Endometrioid Cancer | ||
| GC |  | CAG: Chronic atrophic gastritis |
| CAG with IM: Chronic atrophic gastritis with intestinal metaplasia | ||
| CSG: Chronic superficial gastritis | ||
| GC: Gastric cancer | ||
| SIM: Severe intestinal metaplasia | ||
| WIM: Wild intestinal metaplasia |
| ∗log2FC in expression of this searched gene in stem-like cells from each diseased tissue sample relative to stem-like cells in normal samples in each tissue plotted against the malignancy continuum. Samples are colored based on if they are from different disease stage. |
Top |
Malignant transformation related pathway analysis |
| Find out the enriched GO biological processes and KEGG pathways involved in transition from healthy to precancer to cancer |
| Tissue | Disease Stage | Enriched GO biological Processes |
| Stomach | WIM |  |
| Stomach | SIM |  |
| Liver | NAFLD |  |
| Liver | Cirrhotic |  |
| Liver | HCC |  |
| ∗Top 15 enriched GO BP terms are showed in the bar plot of each disease state in each tissue. Each row represents a significant GO biological process which is colored according to the -log10(p.adjust). |
| Page: 1 2 3 4 5 6 7 8 9 |
| GO ID | Tissue | Disease Stage | Description | Gene Ratio | Bg Ratio | pvalue | p.adjust | Count |
| GO:0031667 | Colorectum | AD | response to nutrient levels | 138/3918 | 474/18723 | 1.22e-05 | 2.68e-04 | 138 |
| GO:0042594 | Colorectum | AD | response to starvation | 63/3918 | 197/18723 | 1.77e-04 | 2.38e-03 | 63 |
| GO:0071496 | Colorectum | AD | cellular response to external stimulus | 94/3918 | 320/18723 | 1.98e-04 | 2.64e-03 | 94 |
| GO:0010038 | Colorectum | AD | response to metal ion | 106/3918 | 373/18723 | 3.22e-04 | 3.83e-03 | 106 |
| GO:0009267 | Colorectum | AD | cellular response to starvation | 51/3918 | 156/18723 | 3.90e-04 | 4.44e-03 | 51 |
| GO:0071248 | Colorectum | AD | cellular response to metal ion | 61/3918 | 197/18723 | 5.74e-04 | 6.09e-03 | 61 |
| GO:0071241 | Colorectum | AD | cellular response to inorganic substance | 68/3918 | 226/18723 | 6.98e-04 | 7.10e-03 | 68 |
| GO:0031668 | Colorectum | AD | cellular response to extracellular stimulus | 71/3918 | 246/18723 | 1.86e-03 | 1.52e-02 | 71 |
| GO:0031669 | Colorectum | AD | cellular response to nutrient levels | 63/3918 | 215/18723 | 2.19e-03 | 1.73e-02 | 63 |
| GO:0071280 | Colorectum | AD | cellular response to copper ion | 12/3918 | 28/18723 | 7.21e-03 | 4.39e-02 | 12 |
| GO:0046688 | Colorectum | AD | response to copper ion | 16/3918 | 42/18723 | 8.10e-03 | 4.76e-02 | 16 |
| GO:00316671 | Colorectum | SER | response to nutrient levels | 106/2897 | 474/18723 | 3.94e-05 | 1.00e-03 | 106 |
| GO:00100381 | Colorectum | SER | response to metal ion | 84/2897 | 373/18723 | 1.87e-04 | 3.44e-03 | 84 |
| GO:00466881 | Colorectum | SER | response to copper ion | 15/2897 | 42/18723 | 1.03e-03 | 1.22e-02 | 15 |
| GO:00425941 | Colorectum | SER | response to starvation | 47/2897 | 197/18723 | 1.31e-03 | 1.45e-02 | 47 |
| GO:00714961 | Colorectum | SER | cellular response to external stimulus | 70/2897 | 320/18723 | 1.40e-03 | 1.53e-02 | 70 |
| GO:00712411 | Colorectum | SER | cellular response to inorganic substance | 52/2897 | 226/18723 | 1.77e-03 | 1.82e-02 | 52 |
| GO:00712801 | Colorectum | SER | cellular response to copper ion | 11/2897 | 28/18723 | 1.98e-03 | 1.98e-02 | 11 |
| GO:00712481 | Colorectum | SER | cellular response to metal ion | 46/2897 | 197/18723 | 2.31e-03 | 2.21e-02 | 46 |
| GO:00092671 | Colorectum | SER | cellular response to starvation | 38/2897 | 156/18723 | 2.45e-03 | 2.32e-02 | 38 |
| Page: 1 2 3 4 5 |
| Pathway ID | Tissue | Disease Stage | Description | Gene Ratio | Bg Ratio | pvalue | p.adjust | qvalue | Count |
| hsa00330 | Colorectum | AD | Arginine and proline metabolism | 23/2092 | 50/8465 | 8.27e-04 | 5.90e-03 | 3.76e-03 | 23 |
| hsa003301 | Colorectum | AD | Arginine and proline metabolism | 23/2092 | 50/8465 | 8.27e-04 | 5.90e-03 | 3.76e-03 | 23 |
| hsa003302 | Colorectum | SER | Arginine and proline metabolism | 17/1580 | 50/8465 | 7.12e-03 | 3.77e-02 | 2.74e-02 | 17 |
| hsa003303 | Colorectum | SER | Arginine and proline metabolism | 17/1580 | 50/8465 | 7.12e-03 | 3.77e-02 | 2.74e-02 | 17 |
| hsa003304 | Colorectum | MSS | Arginine and proline metabolism | 23/1875 | 50/8465 | 1.52e-04 | 1.24e-03 | 7.61e-04 | 23 |
| hsa003305 | Colorectum | MSS | Arginine and proline metabolism | 23/1875 | 50/8465 | 1.52e-04 | 1.24e-03 | 7.61e-04 | 23 |
| hsa003306 | Colorectum | FAP | Arginine and proline metabolism | 16/1404 | 50/8465 | 5.33e-03 | 2.10e-02 | 1.27e-02 | 16 |
| hsa003307 | Colorectum | FAP | Arginine and proline metabolism | 16/1404 | 50/8465 | 5.33e-03 | 2.10e-02 | 1.27e-02 | 16 |
| Page: 1 |
Top |
Cell-cell communication analysis |
| Identification of potential cell-cell interactions between two cell types and their ligand-receptor pairs for different disease states |
| Ligand | Receptor | LRpair | Pathway | Tissue | Disease Stage |
| Page: 1 |
Top |
Single-cell gene regulatory network inference analysis |
| Find out the significant the regulons (TFs) and the target genes of each regulon across cell types for different disease states |
| TF | Cell Type | Tissue | Disease Stage | Target Gene | RSS | Regulon Activity |
| ∗The dot plots of a searched regulon are shown for all cell subpopulations in each disease state of each tissue based on the regulon specific score inferred using pySCENIC and by calculating the average expression. |
| Page: 1 |
Top |
Somatic mutation of malignant transformation related genes |
| Annotation of somatic variants for genes involved in malignant transformation |
| Hugo Symbol | Variant Class | Variant Classification | dbSNP RS | HGVSc | HGVSp | HGVSp Short | SWISSPROT | BIOTYPE | SIFT | PolyPhen | Tumor Sample Barcode | Tissue | Histology | Sex | Age | Stage | Therapy Types | Drugs | Outcome |
| AOC1 | SNV | Missense_Mutation | novel | c.107T>C | p.Leu36Pro | p.L36P | P19801 | protein_coding | deleterious(0) | probably_damaging(1) | TCGA-A8-A09Z-01 | Breast | breast invasive carcinoma | Female | >=65 | I/II | Unknown | Unknown | SD |
| AOC1 | SNV | Missense_Mutation | novel | c.1036A>T | p.Ile346Phe | p.I346F | P19801 | protein_coding | deleterious(0.02) | probably_damaging(0.958) | TCGA-AO-A0J9-01 | Breast | breast invasive carcinoma | Female | <65 | III/IV | Chemotherapy | cyclophosphamide | PD |
| AOC1 | SNV | Missense_Mutation | novel | c.95T>G | p.Val32Gly | p.V32G | P19801 | protein_coding | deleterious(0) | possibly_damaging(0.878) | TCGA-D8-A1Y3-01 | Breast | breast invasive carcinoma | Female | <65 | III/IV | Chemotherapy | doxorubicine+cyclophosphamide | SD |
| AOC1 | SNV | Missense_Mutation | rs777262841 | c.1487G>A | p.Arg496His | p.R496H | P19801 | protein_coding | tolerated(0.35) | benign(0.007) | TCGA-E9-A247-01 | Breast | breast invasive carcinoma | Female | <65 | I/II | Hormone Therapy | tamoxiphen | SD |
| AOC1 | SNV | Missense_Mutation | rs766973083 | c.532N>T | p.His178Tyr | p.H178Y | P19801 | protein_coding | tolerated(0.09) | benign(0.187) | TCGA-PL-A8LZ-01 | Breast | breast invasive carcinoma | Female | <65 | III/IV | Chemotherapy | paclitaxel | SD |
| AOC1 | SNV | Missense_Mutation | novel | c.1697C>T | p.Ala566Val | p.A566V | P19801 | protein_coding | deleterious(0.02) | possibly_damaging(0.677) | TCGA-EA-A3HS-01 | Cervix | cervical & endocervical cancer | Female | <65 | I/II | Unknown | Unknown | SD |
| AOC1 | SNV | Missense_Mutation | novel | c.2251N>C | p.Glu751Gln | p.E751Q | P19801 | protein_coding | tolerated(0.21) | benign(0.277) | TCGA-EA-A3HU-01 | Cervix | cervical & endocervical cancer | Female | <65 | I/II | Unknown | Unknown | SD |
| AOC1 | SNV | Missense_Mutation | c.2008N>C | p.Glu670Gln | p.E670Q | P19801 | protein_coding | tolerated(0.14) | benign(0.04) | TCGA-EK-A2PM-01 | Cervix | cervical & endocervical cancer | Female | >=65 | I/II | Unknown | Unknown | SD | |
| AOC1 | SNV | Missense_Mutation | c.1222G>A | p.Asp408Asn | p.D408N | P19801 | protein_coding | tolerated(0.32) | benign(0.109) | TCGA-EK-A2RN-01 | Cervix | cervical & endocervical cancer | Female | <65 | I/II | Unknown | Unknown | SD | |
| AOC1 | SNV | Missense_Mutation | rs752373263 | c.1141N>A | p.Val381Ile | p.V381I | P19801 | protein_coding | tolerated(0.11) | benign(0.031) | TCGA-5M-AAT6-01 | Colorectum | colon adenocarcinoma | Female | <65 | III/IV | Unknown | Unknown | PD |
| Page: 1 2 3 4 5 6 7 8 9 10 11 12 13 |
Top |
Related drugs of malignant transformation related genes |
| Identification of chemicals and drugs interact with genes involved in malignant transfromation |
| (DGIdb 4.0) |
| Entrez ID | Symbol | Category | Interaction Types | Drug Claim Name | Drug Name | PMIDs |
| Page: 1 |

Copyright 2023-Present -The University of Texas Health Science Center at Houston |