
|
|||||
|
 | |
| |
| |
| |
| |
| |
|
Gene: ALG3 |
Gene summary for ALG3 |
| Gene information | Species | Human | Gene symbol | ALG3 | Gene ID | 10195 |
| Gene name | ALG3 alpha-1,3- mannosyltransferase | |
| Gene Alias | CDG1D | |
| Cytomap | 3q27.1 | |
| Gene Type | protein-coding | GO ID | GO:0006464 | UniProtAcc | Q92685 |
Top |
Malignant transformation analysis |
| Identification of the aberrant gene expression in precancerous and cancerous lesions by comparing the gene expression of stem-like cells in diseased tissues with normal stem cells |
| Entrez ID | Symbol | Replicates | Species | Organ | Tissue | Adj P-value | Log2FC | Malignancy |
| 10195 | ALG3 | HTA11_2487_2000001011 | Human | Colorectum | SER | 6.52e-07 | 3.41e-01 | -0.1808 |
| 10195 | ALG3 | HTA11_1938_2000001011 | Human | Colorectum | AD | 4.15e-09 | 3.61e-01 | -0.0811 |
| 10195 | ALG3 | HTA11_78_2000001011 | Human | Colorectum | AD | 4.17e-03 | 2.37e-01 | -0.1088 |
| 10195 | ALG3 | HTA11_347_2000001011 | Human | Colorectum | AD | 8.91e-12 | 3.66e-01 | -0.1954 |
| 10195 | ALG3 | HTA11_3361_2000001011 | Human | Colorectum | AD | 1.29e-04 | 2.99e-01 | -0.1207 |
| 10195 | ALG3 | HTA11_696_2000001011 | Human | Colorectum | AD | 2.49e-06 | 2.83e-01 | -0.1464 |
| 10195 | ALG3 | HTA11_866_2000001011 | Human | Colorectum | AD | 7.20e-04 | 2.25e-01 | -0.1001 |
| 10195 | ALG3 | HTA11_1391_2000001011 | Human | Colorectum | AD | 1.27e-13 | 4.68e-01 | -0.059 |
| 10195 | ALG3 | HTA11_546_2000001011 | Human | Colorectum | AD | 4.46e-03 | 3.27e-01 | -0.0842 |
| 10195 | ALG3 | HTA11_866_3004761011 | Human | Colorectum | AD | 4.15e-04 | 2.27e-01 | 0.096 |
| 10195 | ALG3 | HTA11_7696_3000711011 | Human | Colorectum | AD | 4.37e-05 | 2.11e-01 | 0.0674 |
| 10195 | ALG3 | HTA11_6818_2000001011 | Human | Colorectum | AD | 3.26e-03 | 2.82e-01 | 0.0112 |
| 10195 | ALG3 | HTA11_99999970781_79442 | Human | Colorectum | MSS | 2.22e-12 | 4.09e-01 | 0.294 |
| 10195 | ALG3 | HTA11_99999965062_69753 | Human | Colorectum | MSI-H | 3.33e-07 | 7.05e-01 | 0.3487 |
| 10195 | ALG3 | HTA11_99999965104_69814 | Human | Colorectum | MSS | 5.50e-23 | 8.40e-01 | 0.281 |
| 10195 | ALG3 | HTA11_99999971662_82457 | Human | Colorectum | MSS | 1.15e-12 | 4.73e-01 | 0.3859 |
| 10195 | ALG3 | HTA11_99999974143_84620 | Human | Colorectum | MSS | 8.69e-06 | 2.54e-01 | 0.3005 |
| 10195 | ALG3 | LZE2T | Human | Esophagus | ESCC | 1.46e-07 | 1.35e+00 | 0.082 |
| 10195 | ALG3 | LZE4T | Human | Esophagus | ESCC | 7.96e-31 | 9.60e-01 | 0.0811 |
| 10195 | ALG3 | LZE7T | Human | Esophagus | ESCC | 1.25e-13 | 8.23e-01 | 0.0667 |
| Page: 1 2 3 4 5 6 7 8 |
| Tissue | Expression Dynamics | Abbreviation |
| Colorectum (GSE201348) |  | FAP: Familial adenomatous polyposis |
| CRC: Colorectal cancer | ||
| Colorectum (HTA11) |  | AD: Adenomas |
| SER: Sessile serrated lesions | ||
| MSI-H: Microsatellite-high colorectal cancer | ||
| MSS: Microsatellite stable colorectal cancer | ||
| Esophagus |  | ESCC: Esophageal squamous cell carcinoma |
| HGIN: High-grade intraepithelial neoplasias | ||
| LGIN: Low-grade intraepithelial neoplasias | ||
| Liver | 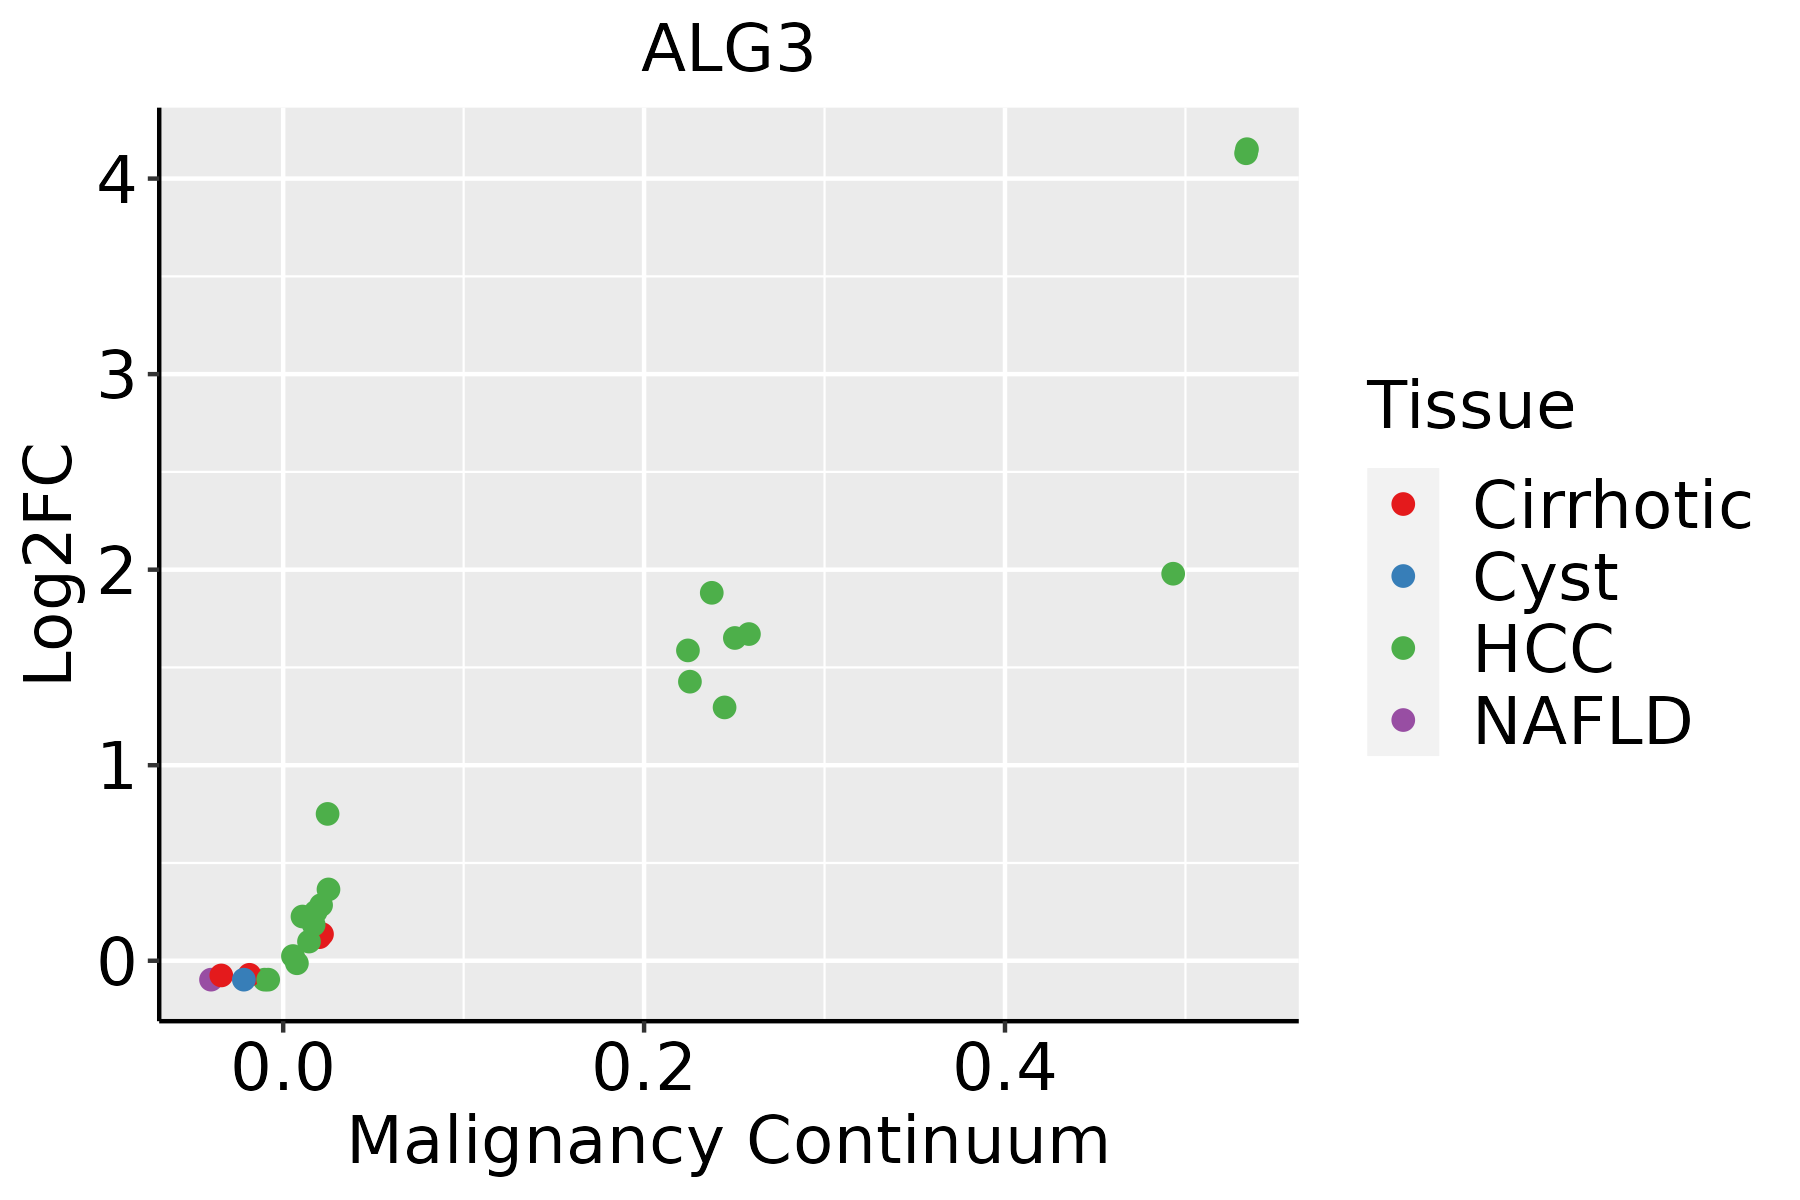 | HCC: Hepatocellular carcinoma |
| NAFLD: Non-alcoholic fatty liver disease | ||
| Oral Cavity | 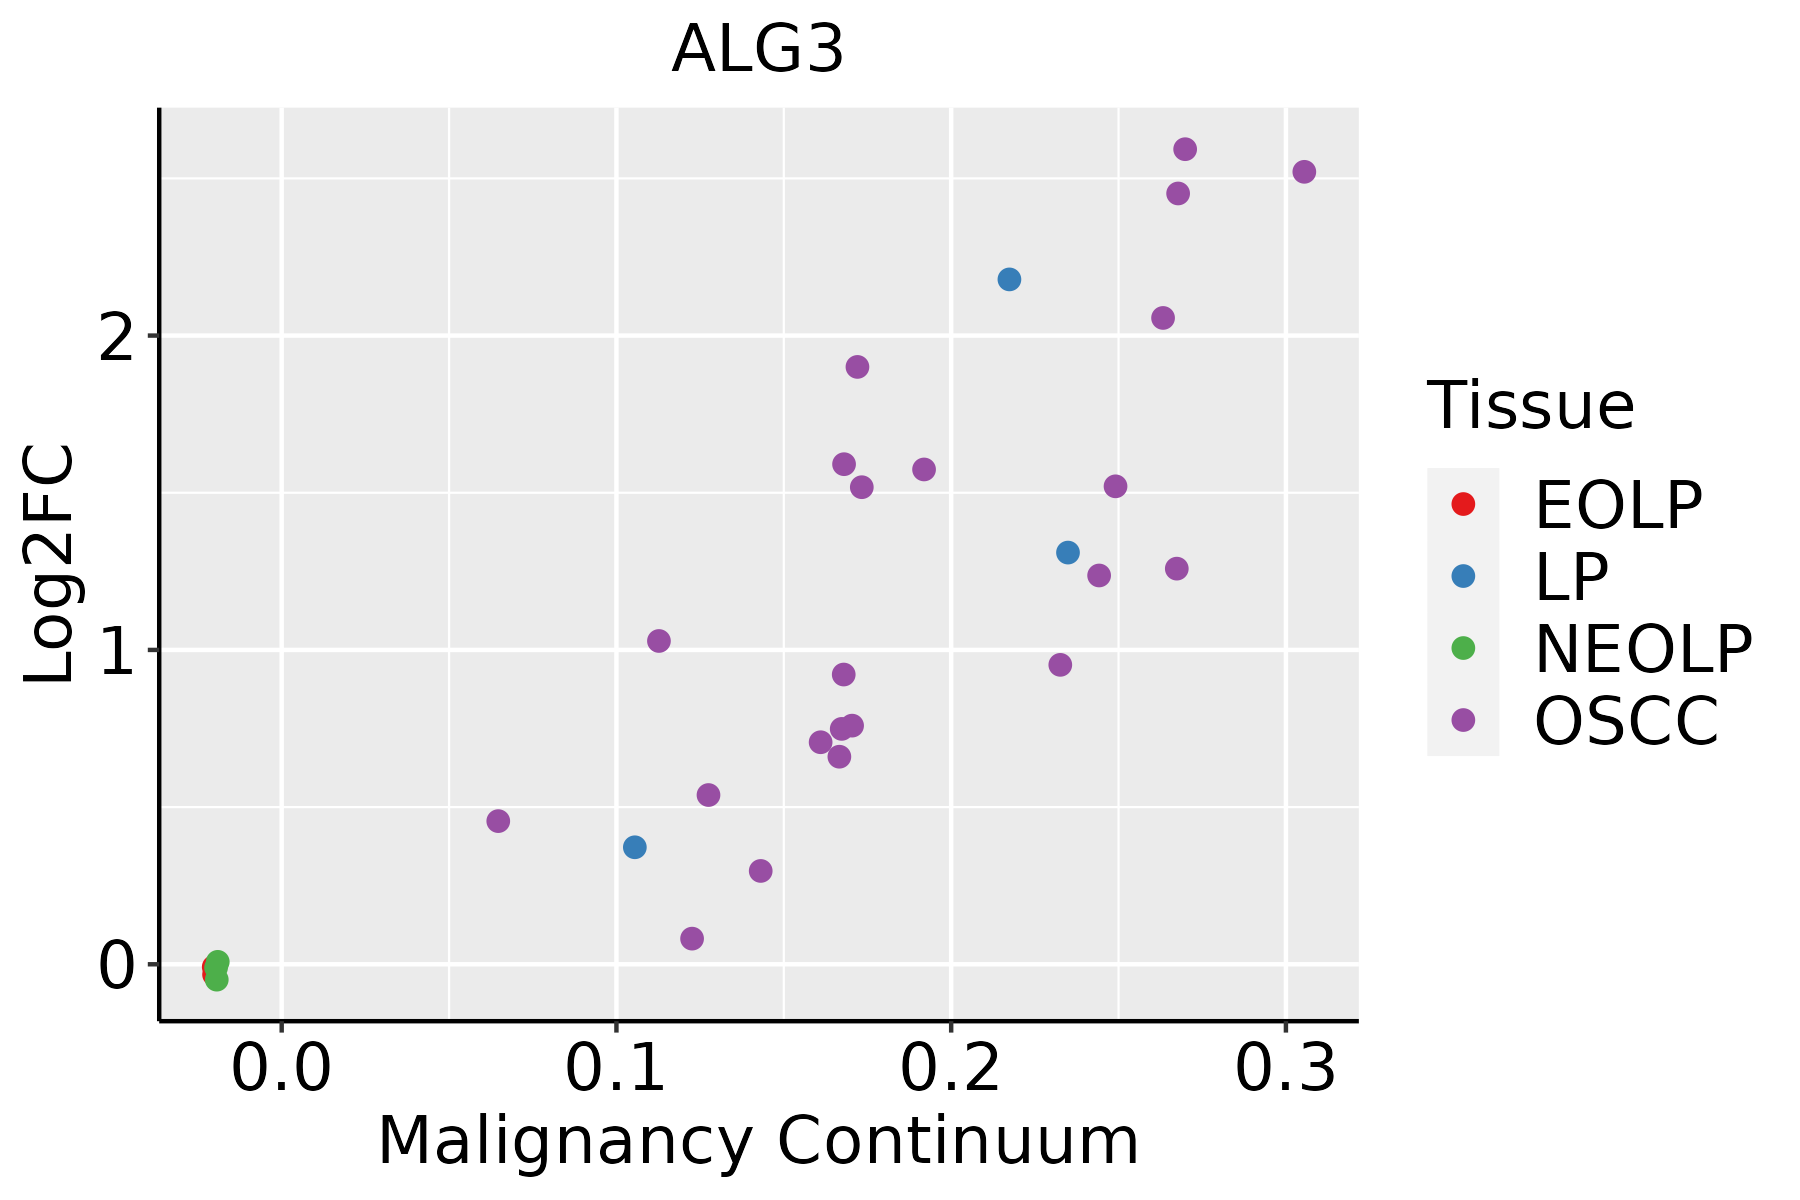 | EOLP: Erosive Oral lichen planus |
| LP: leukoplakia | ||
| NEOLP: Non-erosive oral lichen planus | ||
| OSCC: Oral squamous cell carcinoma | ||
| Skin |  | AK: Actinic keratosis |
| cSCC: Cutaneous squamous cell carcinoma | ||
| SCCIS:squamous cell carcinoma in situ | ||
| Thyroid |  | ATC: Anaplastic thyroid cancer |
| HT: Hashimoto's thyroiditis | ||
| PTC: Papillary thyroid cancer |
| ∗log2FC in expression of this searched gene in stem-like cells from each diseased tissue sample relative to stem-like cells in normal samples in each tissue plotted against the malignancy continuum. Samples are colored based on if they are from different disease stage. |
Top |
Malignant transformation related pathway analysis |
| Find out the enriched GO biological processes and KEGG pathways involved in transition from healthy to precancer to cancer |
| Tissue | Disease Stage | Enriched GO biological Processes |
| Stomach | WIM |  |
| Stomach | SIM |  |
| Liver | NAFLD |  |
| Liver | Cirrhotic |  |
| Liver | HCC |  |
| ∗Top 15 enriched GO BP terms are showed in the bar plot of each disease state in each tissue. Each row represents a significant GO biological process which is colored according to the -log10(p.adjust). |
| Page: 1 2 3 4 5 6 7 8 9 |
| GO ID | Tissue | Disease Stage | Description | Gene Ratio | Bg Ratio | pvalue | p.adjust | Count |
| GO:0006487 | Colorectum | AD | protein N-linked glycosylation | 25/3918 | 65/18723 | 9.12e-04 | 8.71e-03 | 25 |
| GO:0006486 | Colorectum | AD | protein glycosylation | 64/3918 | 226/18723 | 4.86e-03 | 3.27e-02 | 64 |
| GO:0043413 | Colorectum | AD | macromolecule glycosylation | 64/3918 | 226/18723 | 4.86e-03 | 3.27e-02 | 64 |
| GO:0070085 | Colorectum | AD | glycosylation | 67/3918 | 240/18723 | 5.78e-03 | 3.67e-02 | 67 |
| GO:00064871 | Colorectum | MSS | protein N-linked glycosylation | 23/3467 | 65/18723 | 9.47e-04 | 9.54e-03 | 23 |
| GO:00064876 | Esophagus | HGIN | protein N-linked glycosylation | 17/2587 | 65/18723 | 6.04e-03 | 4.87e-02 | 17 |
| GO:000648714 | Esophagus | ESCC | protein N-linked glycosylation | 51/8552 | 65/18723 | 6.41e-08 | 1.13e-06 | 51 |
| GO:00091002 | Esophagus | ESCC | glycoprotein metabolic process | 226/8552 | 387/18723 | 2.64e-07 | 3.94e-06 | 226 |
| GO:00700854 | Esophagus | ESCC | glycosylation | 144/8552 | 240/18723 | 5.12e-06 | 5.38e-05 | 144 |
| GO:00064865 | Esophagus | ESCC | protein glycosylation | 135/8552 | 226/18723 | 1.36e-05 | 1.24e-04 | 135 |
| GO:00434135 | Esophagus | ESCC | macromolecule glycosylation | 135/8552 | 226/18723 | 1.36e-05 | 1.24e-04 | 135 |
| GO:00091012 | Esophagus | ESCC | glycoprotein biosynthetic process | 181/8552 | 317/18723 | 2.54e-05 | 2.15e-04 | 181 |
| GO:00064882 | Esophagus | ESCC | dolichol-linked oligosaccharide biosynthetic process | 14/8552 | 18/18723 | 5.77e-03 | 2.14e-02 | 14 |
| GO:00064902 | Esophagus | ESCC | oligosaccharide-lipid intermediate biosynthetic process | 14/8552 | 19/18723 | 1.27e-02 | 4.21e-02 | 14 |
| GO:00064873 | Liver | Cirrhotic | protein N-linked glycosylation | 30/4634 | 65/18723 | 1.40e-04 | 1.36e-03 | 30 |
| GO:000648711 | Liver | HCC | protein N-linked glycosylation | 48/7958 | 65/18723 | 2.85e-07 | 5.00e-06 | 48 |
| GO:00064862 | Liver | HCC | protein glycosylation | 122/7958 | 226/18723 | 3.11e-04 | 2.21e-03 | 122 |
| GO:00434132 | Liver | HCC | macromolecule glycosylation | 122/7958 | 226/18723 | 3.11e-04 | 2.21e-03 | 122 |
| GO:00700852 | Liver | HCC | glycosylation | 128/7958 | 240/18723 | 4.35e-04 | 2.92e-03 | 128 |
| GO:0009100 | Liver | HCC | glycoprotein metabolic process | 193/7958 | 387/18723 | 1.89e-03 | 9.62e-03 | 193 |
| Page: 1 2 3 |
| Pathway ID | Tissue | Disease Stage | Description | Gene Ratio | Bg Ratio | pvalue | p.adjust | qvalue | Count |
| hsa00510 | Colorectum | AD | N-Glycan biosynthesis | 21/2092 | 53/8465 | 1.15e-02 | 4.24e-02 | 2.71e-02 | 21 |
| hsa005101 | Colorectum | AD | N-Glycan biosynthesis | 21/2092 | 53/8465 | 1.15e-02 | 4.24e-02 | 2.71e-02 | 21 |
| hsa005106 | Esophagus | HGIN | N-Glycan biosynthesis | 17/1383 | 53/8465 | 3.43e-03 | 2.54e-02 | 2.02e-02 | 17 |
| hsa0051013 | Esophagus | HGIN | N-Glycan biosynthesis | 17/1383 | 53/8465 | 3.43e-03 | 2.54e-02 | 2.02e-02 | 17 |
| hsa0051023 | Esophagus | ESCC | N-Glycan biosynthesis | 39/4205 | 53/8465 | 3.26e-04 | 1.15e-03 | 5.89e-04 | 39 |
| hsa005136 | Esophagus | ESCC | Various types of N-glycan biosynthesis | 31/4205 | 42/8465 | 1.23e-03 | 3.78e-03 | 1.93e-03 | 31 |
| hsa0051033 | Esophagus | ESCC | N-Glycan biosynthesis | 39/4205 | 53/8465 | 3.26e-04 | 1.15e-03 | 5.89e-04 | 39 |
| hsa0051313 | Esophagus | ESCC | Various types of N-glycan biosynthesis | 31/4205 | 42/8465 | 1.23e-03 | 3.78e-03 | 1.93e-03 | 31 |
| hsa005104 | Liver | Cirrhotic | N-Glycan biosynthesis | 32/2530 | 53/8465 | 3.82e-06 | 4.10e-05 | 2.53e-05 | 32 |
| hsa005134 | Liver | Cirrhotic | Various types of N-glycan biosynthesis | 26/2530 | 42/8465 | 1.65e-05 | 1.41e-04 | 8.69e-05 | 26 |
| hsa0051011 | Liver | Cirrhotic | N-Glycan biosynthesis | 32/2530 | 53/8465 | 3.82e-06 | 4.10e-05 | 2.53e-05 | 32 |
| hsa0051311 | Liver | Cirrhotic | Various types of N-glycan biosynthesis | 26/2530 | 42/8465 | 1.65e-05 | 1.41e-04 | 8.69e-05 | 26 |
| hsa0051021 | Liver | HCC | N-Glycan biosynthesis | 40/4020 | 53/8465 | 2.95e-05 | 1.87e-04 | 1.04e-04 | 40 |
| hsa005132 | Liver | HCC | Various types of N-glycan biosynthesis | 30/4020 | 42/8465 | 1.41e-03 | 5.07e-03 | 2.82e-03 | 30 |
| hsa0051031 | Liver | HCC | N-Glycan biosynthesis | 40/4020 | 53/8465 | 2.95e-05 | 1.87e-04 | 1.04e-04 | 40 |
| hsa005133 | Liver | HCC | Various types of N-glycan biosynthesis | 30/4020 | 42/8465 | 1.41e-03 | 5.07e-03 | 2.82e-03 | 30 |
| hsa005105 | Oral cavity | OSCC | N-Glycan biosynthesis | 39/3704 | 53/8465 | 9.77e-06 | 4.36e-05 | 2.22e-05 | 39 |
| hsa005135 | Oral cavity | OSCC | Various types of N-glycan biosynthesis | 29/3704 | 42/8465 | 8.03e-04 | 2.32e-03 | 1.18e-03 | 29 |
| hsa0051012 | Oral cavity | OSCC | N-Glycan biosynthesis | 39/3704 | 53/8465 | 9.77e-06 | 4.36e-05 | 2.22e-05 | 39 |
| hsa0051312 | Oral cavity | OSCC | Various types of N-glycan biosynthesis | 29/3704 | 42/8465 | 8.03e-04 | 2.32e-03 | 1.18e-03 | 29 |
| Page: 1 2 |
Top |
Cell-cell communication analysis |
| Identification of potential cell-cell interactions between two cell types and their ligand-receptor pairs for different disease states |
| Ligand | Receptor | LRpair | Pathway | Tissue | Disease Stage |
| Page: 1 |
Top |
Single-cell gene regulatory network inference analysis |
| Find out the significant the regulons (TFs) and the target genes of each regulon across cell types for different disease states |
| TF | Cell Type | Tissue | Disease Stage | Target Gene | RSS | Regulon Activity |
| ∗The dot plots of a searched regulon are shown for all cell subpopulations in each disease state of each tissue based on the regulon specific score inferred using pySCENIC and by calculating the average expression. |
| Page: 1 |
Top |
Somatic mutation of malignant transformation related genes |
| Annotation of somatic variants for genes involved in malignant transformation |
| Hugo Symbol | Variant Class | Variant Classification | dbSNP RS | HGVSc | HGVSp | HGVSp Short | SWISSPROT | BIOTYPE | SIFT | PolyPhen | Tumor Sample Barcode | Tissue | Histology | Sex | Age | Stage | Therapy Types | Drugs | Outcome |
| ALG3 | SNV | Missense_Mutation | novel | c.1307N>G | p.Lys436Arg | p.K436R | Q92685 | protein_coding | tolerated(0.12) | benign(0.021) | TCGA-A7-A56D-01 | Breast | breast invasive carcinoma | Female | >=65 | I/II | Hormone Therapy | arimidex | SD |
| ALG3 | SNV | Missense_Mutation | novel | c.131N>A | p.Leu44Gln | p.L44Q | Q92685 | protein_coding | deleterious(0.05) | benign(0.007) | TCGA-AC-A2FB-01 | Breast | breast invasive carcinoma | Female | >=65 | I/II | Chemotherapy | taxotere | CR |
| ALG3 | SNV | Missense_Mutation | rs748076351 | c.241N>A | p.Val81Ile | p.V81I | Q92685 | protein_coding | tolerated(0.13) | possibly_damaging(0.47) | TCGA-E9-A1N9-01 | Breast | breast invasive carcinoma | Female | <65 | I/II | Chemotherapy | doxorubicin | SD |
| ALG3 | insertion | Nonsense_Mutation | novel | c.1200_1201insAGTCACATTTGACTATTGAGTAC | p.Thr402HisfsTer3 | p.T402Hfs*3 | Q92685 | protein_coding | TCGA-AN-A041-01 | Breast | breast invasive carcinoma | Female | <65 | I/II | Unknown | Unknown | SD | ||
| ALG3 | SNV | Missense_Mutation | c.1198C>A | p.Pro400Thr | p.P400T | Q92685 | protein_coding | deleterious(0) | probably_damaging(1) | TCGA-A6-6781-01 | Colorectum | colon adenocarcinoma | Male | <65 | III/IV | Chemotherapy | oxaliplatin | SD | |
| ALG3 | SNV | Missense_Mutation | c.533C>T | p.Ala178Val | p.A178V | Q92685 | protein_coding | deleterious(0) | probably_damaging(1) | TCGA-AA-3672-01 | Colorectum | colon adenocarcinoma | Female | >=65 | III/IV | Unknown | Unknown | SD | |
| ALG3 | SNV | Missense_Mutation | rs867376445 | c.365N>A | p.Arg122His | p.R122H | Q92685 | protein_coding | tolerated(0.07) | probably_damaging(0.937) | TCGA-G4-6297-01 | Colorectum | colon adenocarcinoma | Female | <65 | III/IV | Chemotherapy | fluorouracil | PD |
| ALG3 | SNV | Missense_Mutation | rs756802179 | c.953N>T | p.Ser318Leu | p.S318L | Q92685 | protein_coding | tolerated(0.15) | benign(0.129) | TCGA-A5-A0G1-01 | Endometrium | uterine corpus endometrioid carcinoma | Female | >=65 | I/II | Unknown | Unknown | SD |
| ALG3 | SNV | Missense_Mutation | rs763104840 | c.364N>T | p.Arg122Cys | p.R122C | Q92685 | protein_coding | deleterious(0.01) | probably_damaging(0.937) | TCGA-A5-A1OF-01 | Endometrium | uterine corpus endometrioid carcinoma | Female | <65 | I/II | Unknown | Unknown | SD |
| ALG3 | SNV | Missense_Mutation | rs748076351 | c.241G>A | p.Val81Ile | p.V81I | Q92685 | protein_coding | tolerated(0.13) | possibly_damaging(0.47) | TCGA-A5-A2K7-01 | Endometrium | uterine corpus endometrioid carcinoma | Female | <65 | I/II | Chemotherapy | taxol | SD |
| Page: 1 2 3 4 |
Top |
Related drugs of malignant transformation related genes |
| Identification of chemicals and drugs interact with genes involved in malignant transfromation |
| (DGIdb 4.0) |
| Entrez ID | Symbol | Category | Interaction Types | Drug Claim Name | Drug Name | PMIDs |
| Page: 1 |

Copyright 2023-Present -The University of Texas Health Science Center at Houston |