
|
|||||
|
 | |
| |
| |
| |
| |
| |
|
Gene: ACAA1 |
Gene summary for ACAA1 |
| Gene information | Species | Human | Gene symbol | ACAA1 | Gene ID | 30 |
| Gene name | acetyl-CoA acyltransferase 1 | |
| Gene Alias | ACAA | |
| Cytomap | 3p22.2 | |
| Gene Type | protein-coding | GO ID | GO:0000038 | UniProtAcc | A0A140VJX0 |
Top |
Malignant transformation analysis |
| Identification of the aberrant gene expression in precancerous and cancerous lesions by comparing the gene expression of stem-like cells in diseased tissues with normal stem cells |
| Entrez ID | Symbol | Replicates | Species | Organ | Tissue | Adj P-value | Log2FC | Malignancy |
| 30 | ACAA1 | LZE2T | Human | Esophagus | ESCC | 1.75e-06 | 3.27e-01 | 0.082 |
| 30 | ACAA1 | LZE4T | Human | Esophagus | ESCC | 2.82e-10 | 2.42e-01 | 0.0811 |
| 30 | ACAA1 | LZE5T | Human | Esophagus | ESCC | 3.18e-02 | 5.39e-02 | 0.0514 |
| 30 | ACAA1 | LZE24T | Human | Esophagus | ESCC | 1.04e-18 | 4.90e-01 | 0.0596 |
| 30 | ACAA1 | LZE21T | Human | Esophagus | ESCC | 7.99e-07 | 2.48e-01 | 0.0655 |
| 30 | ACAA1 | P1T-E | Human | Esophagus | ESCC | 9.63e-15 | 4.32e-01 | 0.0875 |
| 30 | ACAA1 | P2T-E | Human | Esophagus | ESCC | 1.79e-24 | 2.19e-01 | 0.1177 |
| 30 | ACAA1 | P4T-E | Human | Esophagus | ESCC | 1.96e-19 | 6.21e-01 | 0.1323 |
| 30 | ACAA1 | P5T-E | Human | Esophagus | ESCC | 1.63e-18 | 1.84e-01 | 0.1327 |
| 30 | ACAA1 | P8T-E | Human | Esophagus | ESCC | 1.98e-32 | 3.48e-01 | 0.0889 |
| 30 | ACAA1 | P9T-E | Human | Esophagus | ESCC | 1.82e-20 | 4.29e-01 | 0.1131 |
| 30 | ACAA1 | P10T-E | Human | Esophagus | ESCC | 6.06e-29 | 4.14e-01 | 0.116 |
| 30 | ACAA1 | P11T-E | Human | Esophagus | ESCC | 6.34e-10 | 2.76e-01 | 0.1426 |
| 30 | ACAA1 | P12T-E | Human | Esophagus | ESCC | 4.36e-42 | 7.92e-01 | 0.1122 |
| 30 | ACAA1 | P15T-E | Human | Esophagus | ESCC | 4.23e-14 | 2.27e-01 | 0.1149 |
| 30 | ACAA1 | P16T-E | Human | Esophagus | ESCC | 1.57e-25 | 3.16e-01 | 0.1153 |
| 30 | ACAA1 | P17T-E | Human | Esophagus | ESCC | 2.25e-07 | 4.21e-01 | 0.1278 |
| 30 | ACAA1 | P20T-E | Human | Esophagus | ESCC | 1.24e-24 | 3.60e-01 | 0.1124 |
| 30 | ACAA1 | P21T-E | Human | Esophagus | ESCC | 2.66e-52 | 7.21e-01 | 0.1617 |
| 30 | ACAA1 | P22T-E | Human | Esophagus | ESCC | 1.19e-37 | 5.05e-01 | 0.1236 |
| Page: 1 2 3 4 5 6 7 |
| Tissue | Expression Dynamics | Abbreviation |
| Esophagus | 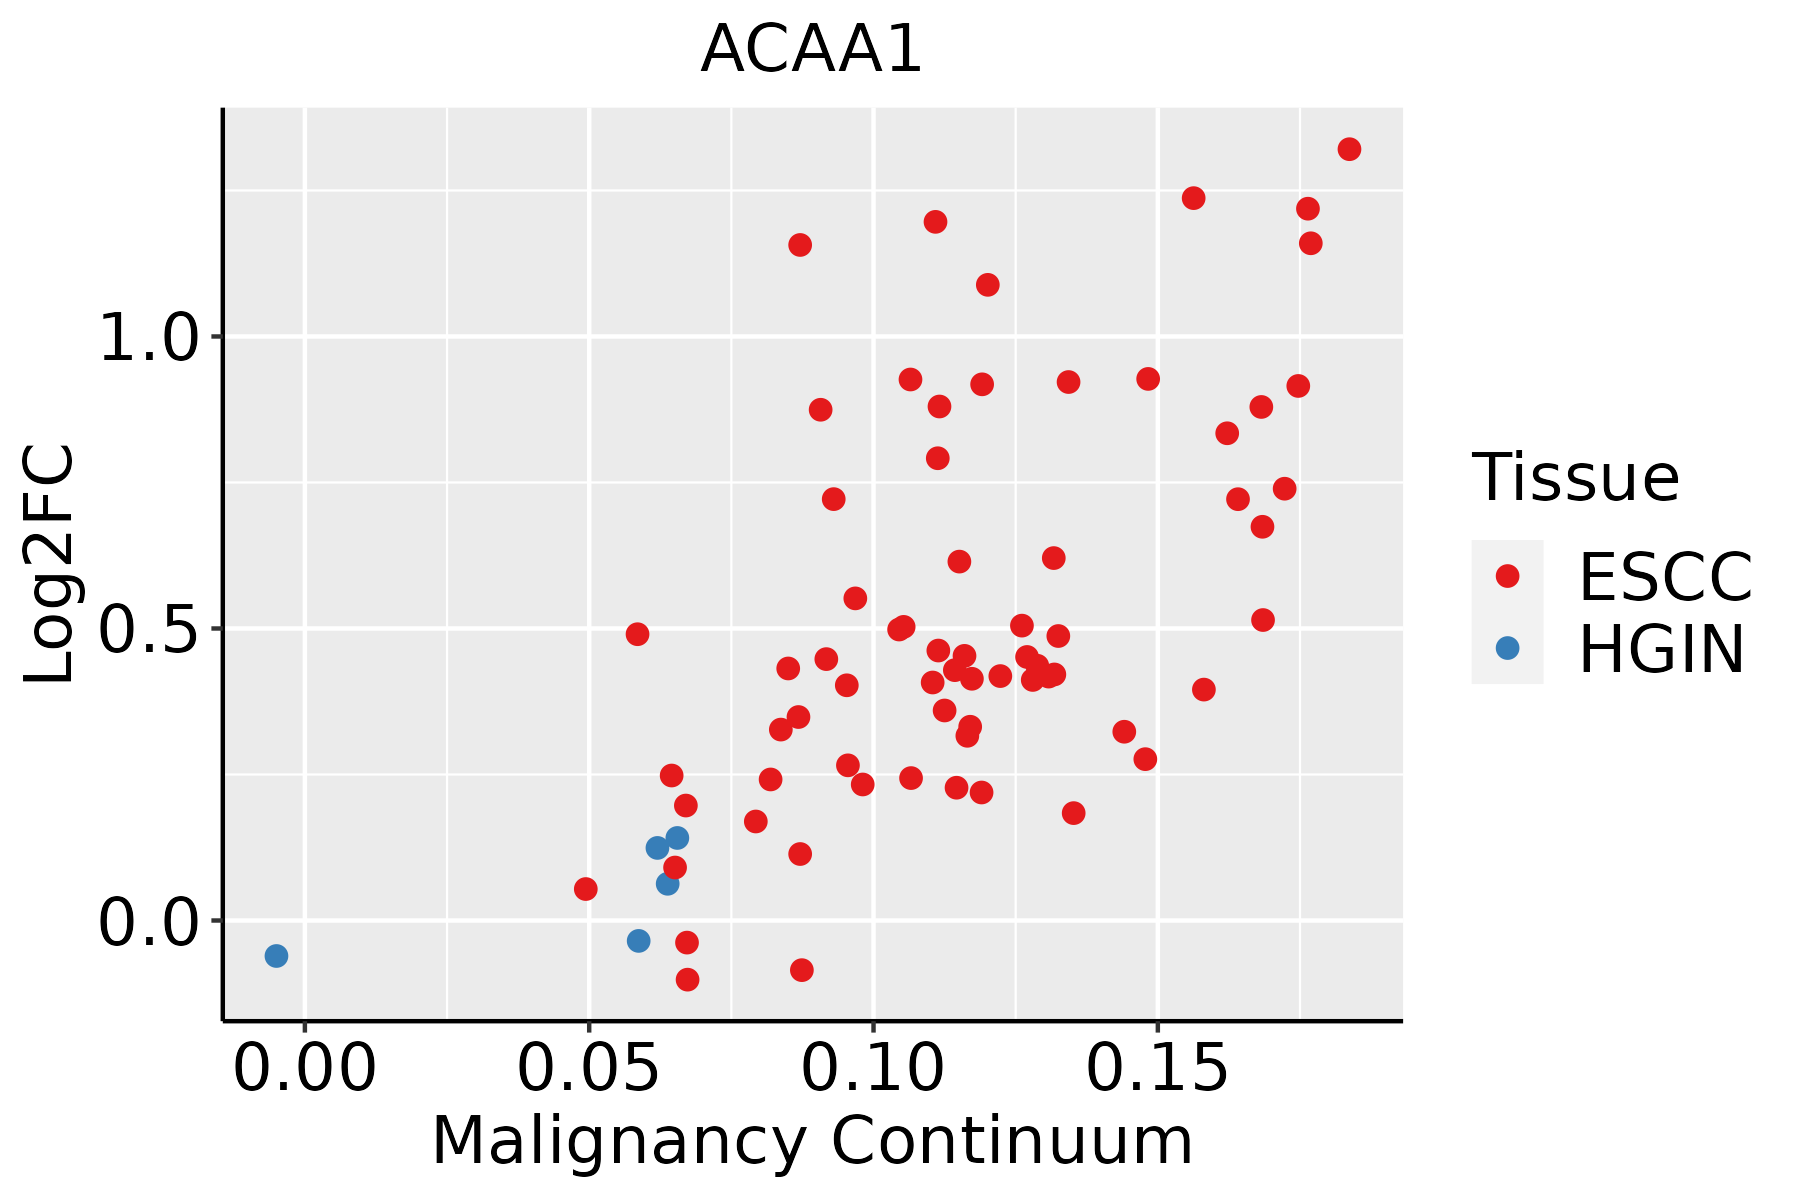 | ESCC: Esophageal squamous cell carcinoma |
| HGIN: High-grade intraepithelial neoplasias | ||
| LGIN: Low-grade intraepithelial neoplasias | ||
| GC | 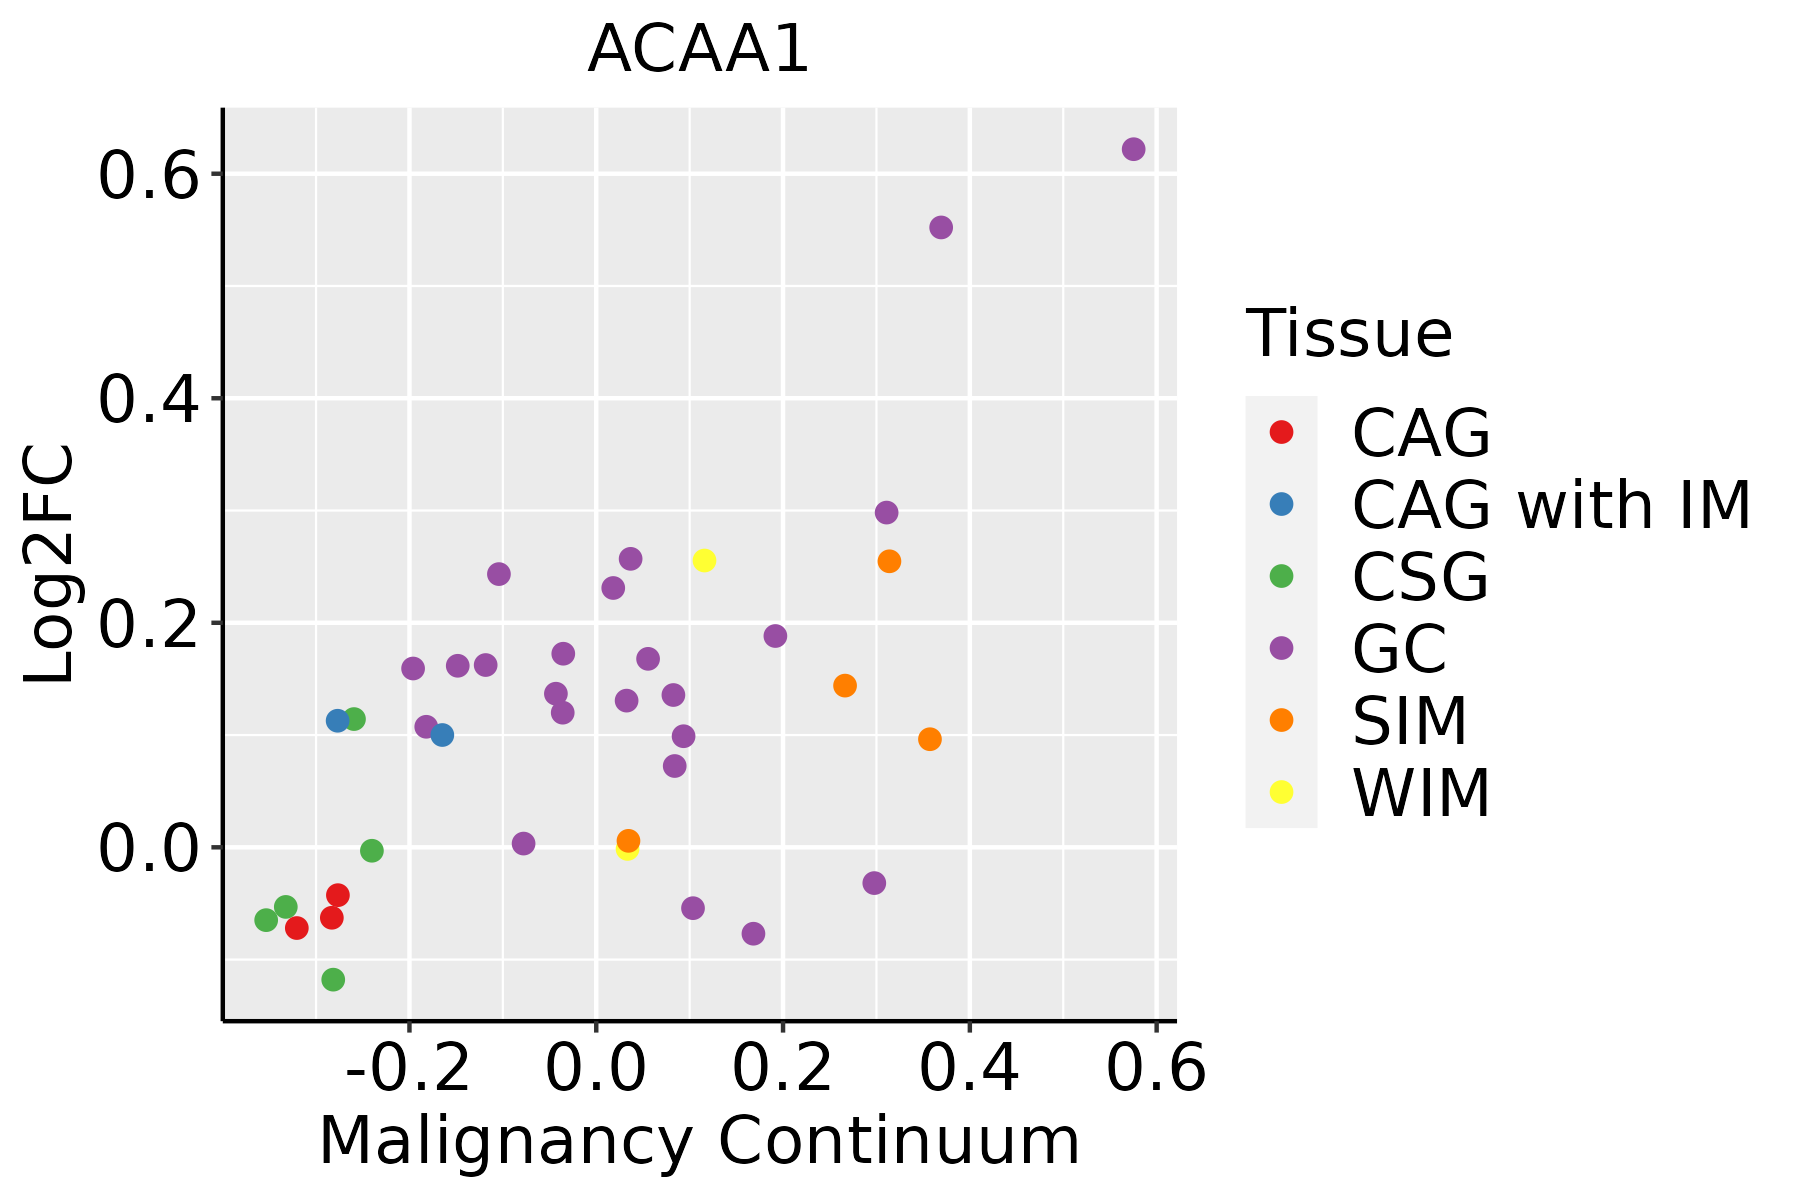 | CAG: Chronic atrophic gastritis |
| CAG with IM: Chronic atrophic gastritis with intestinal metaplasia | ||
| CSG: Chronic superficial gastritis | ||
| GC: Gastric cancer | ||
| SIM: Severe intestinal metaplasia | ||
| WIM: Wild intestinal metaplasia | ||
| Liver | 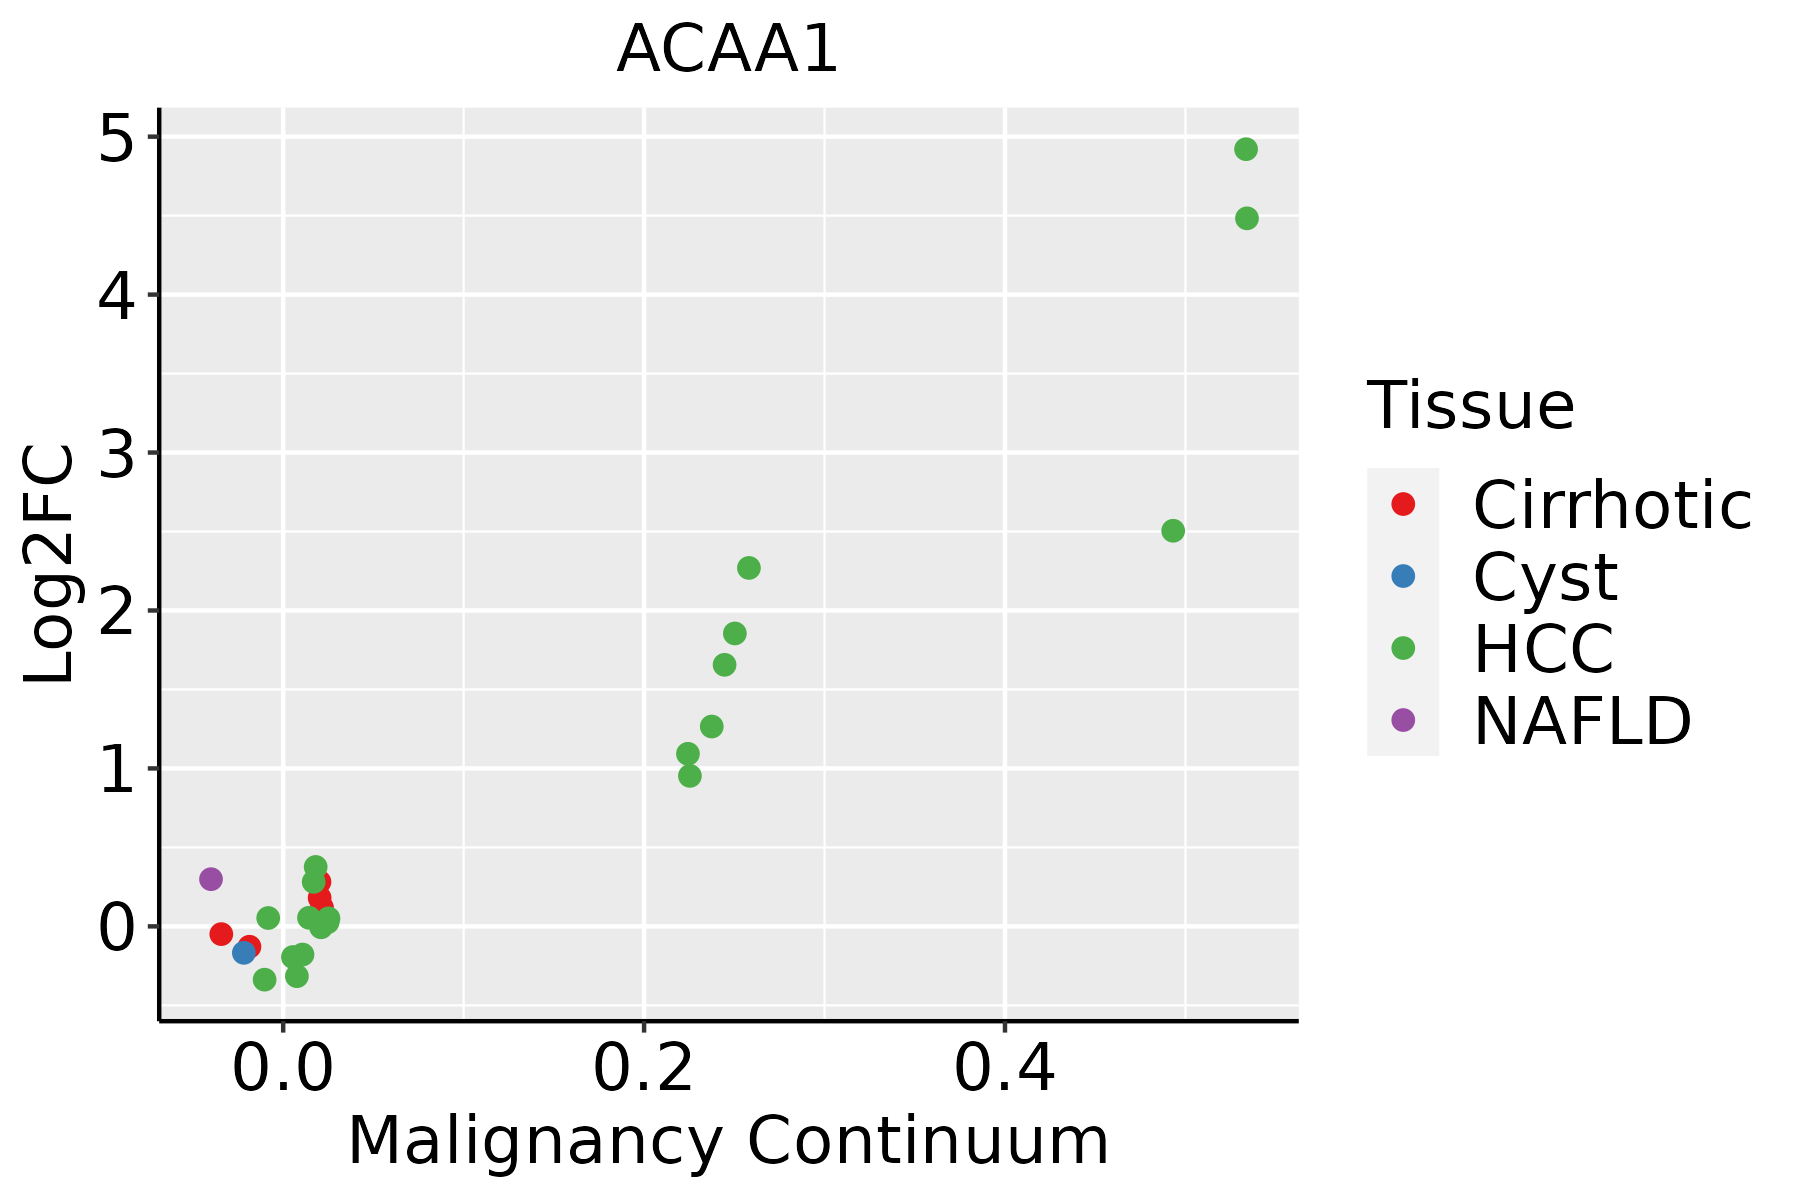 | HCC: Hepatocellular carcinoma |
| NAFLD: Non-alcoholic fatty liver disease | ||
| Oral Cavity | 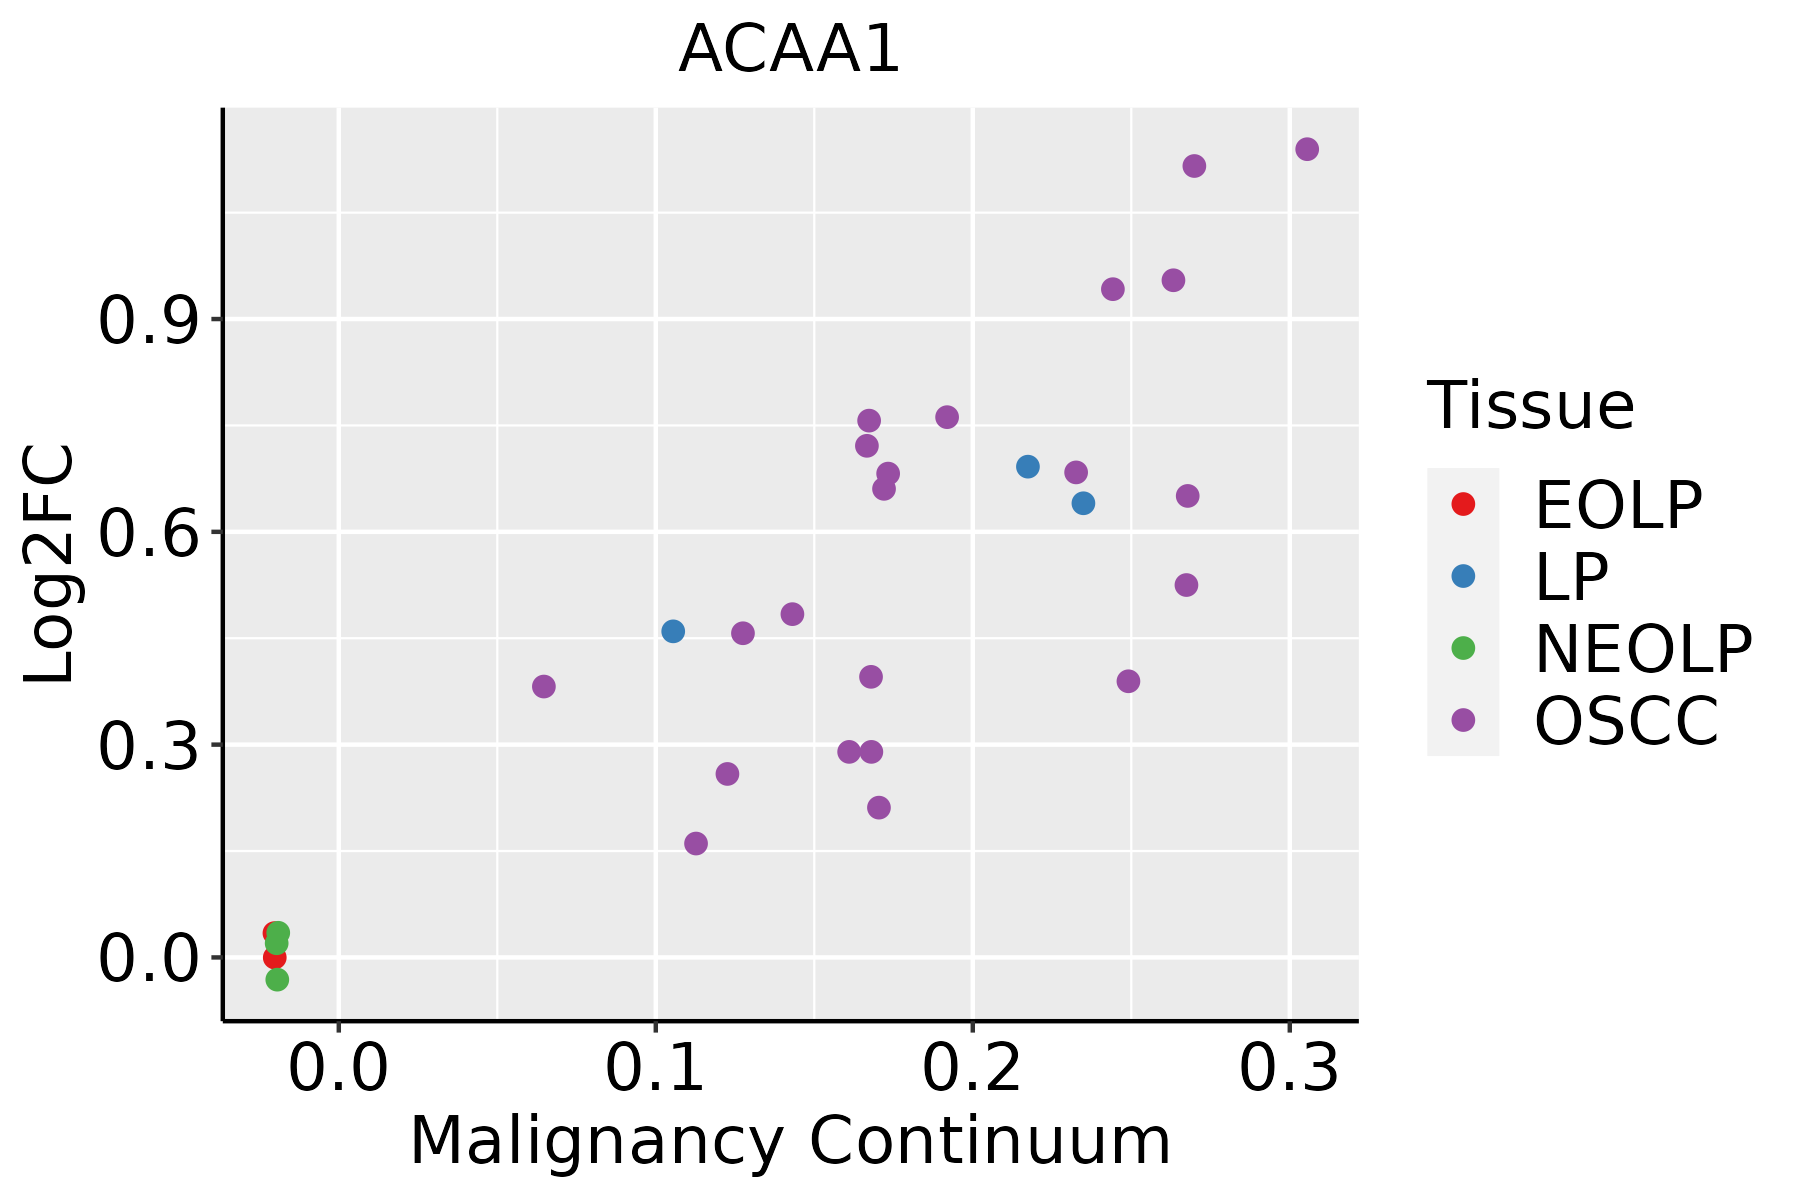 | EOLP: Erosive Oral lichen planus |
| LP: leukoplakia | ||
| NEOLP: Non-erosive oral lichen planus | ||
| OSCC: Oral squamous cell carcinoma | ||
| Prostate | 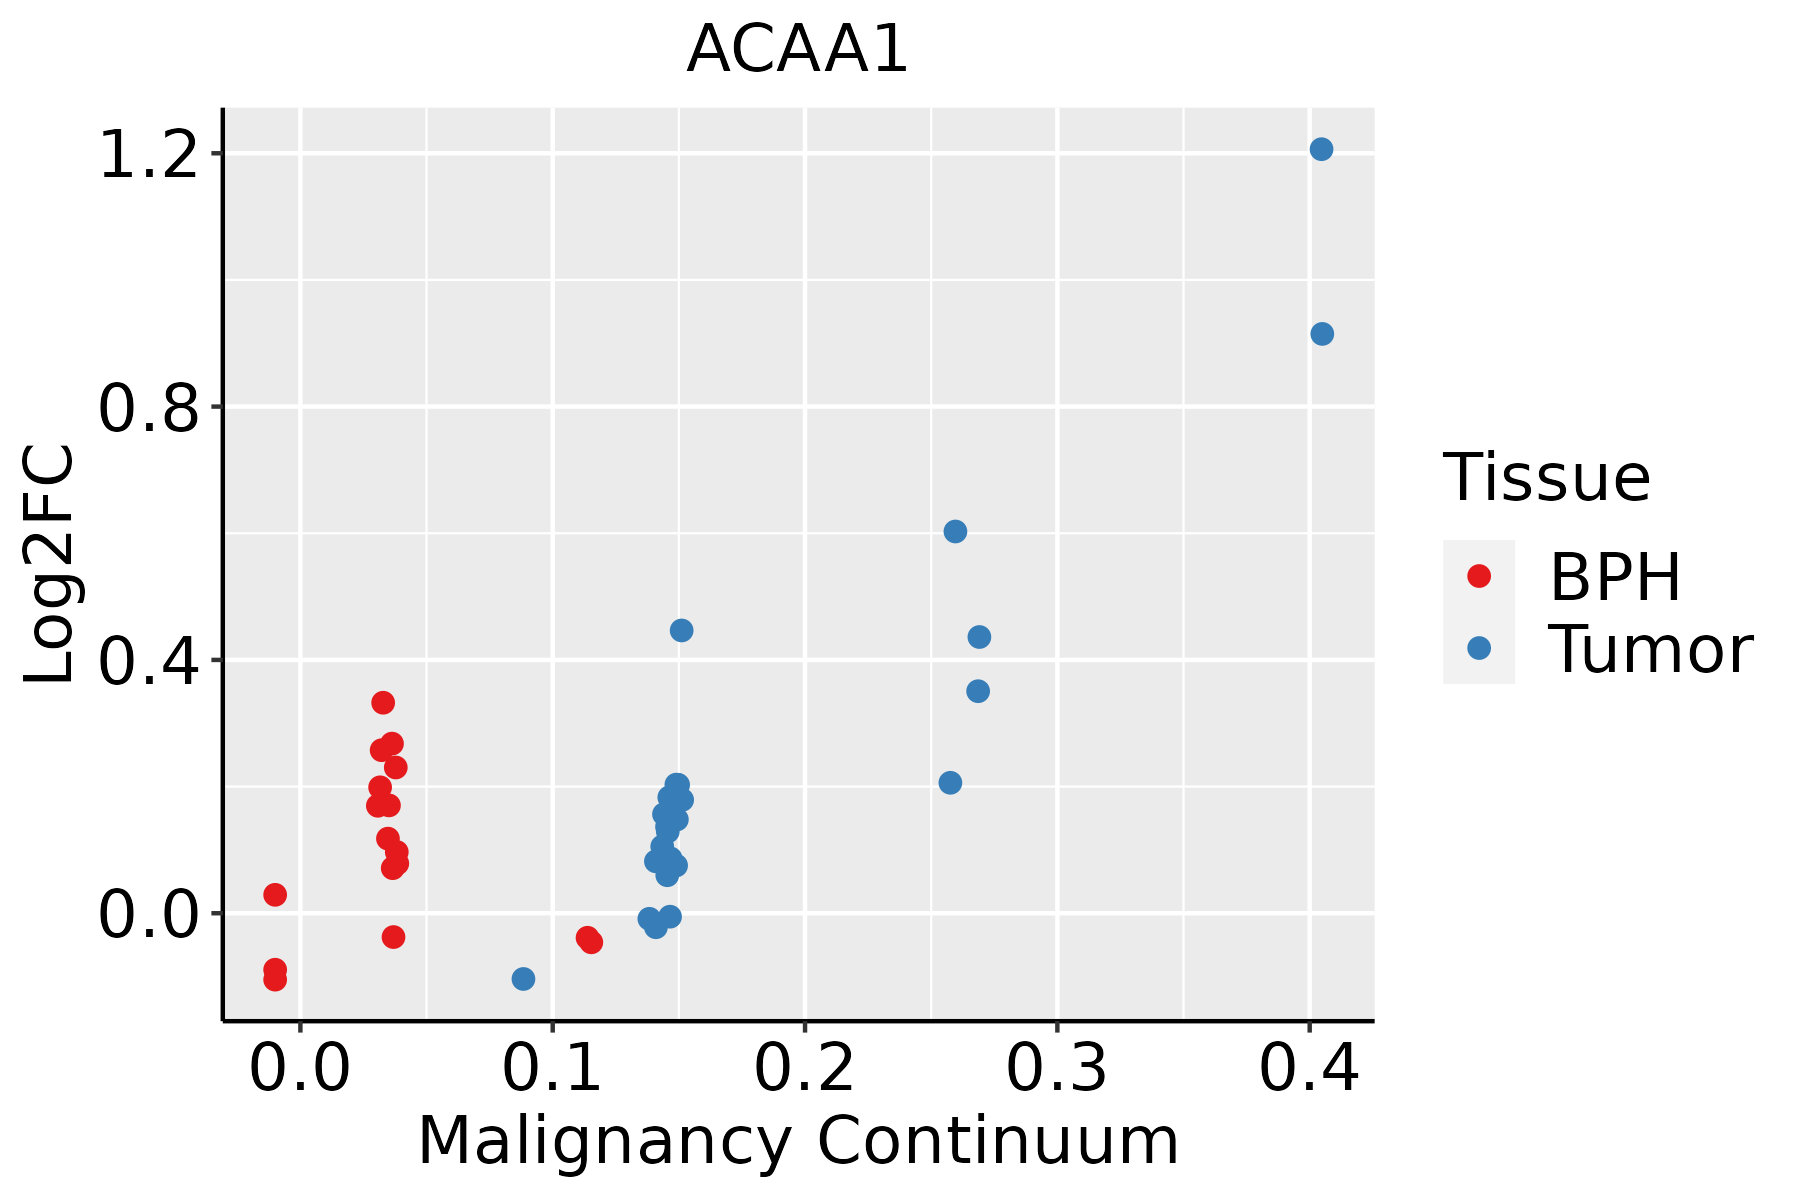 | BPH: Benign Prostatic Hyperplasia |
| Skin | 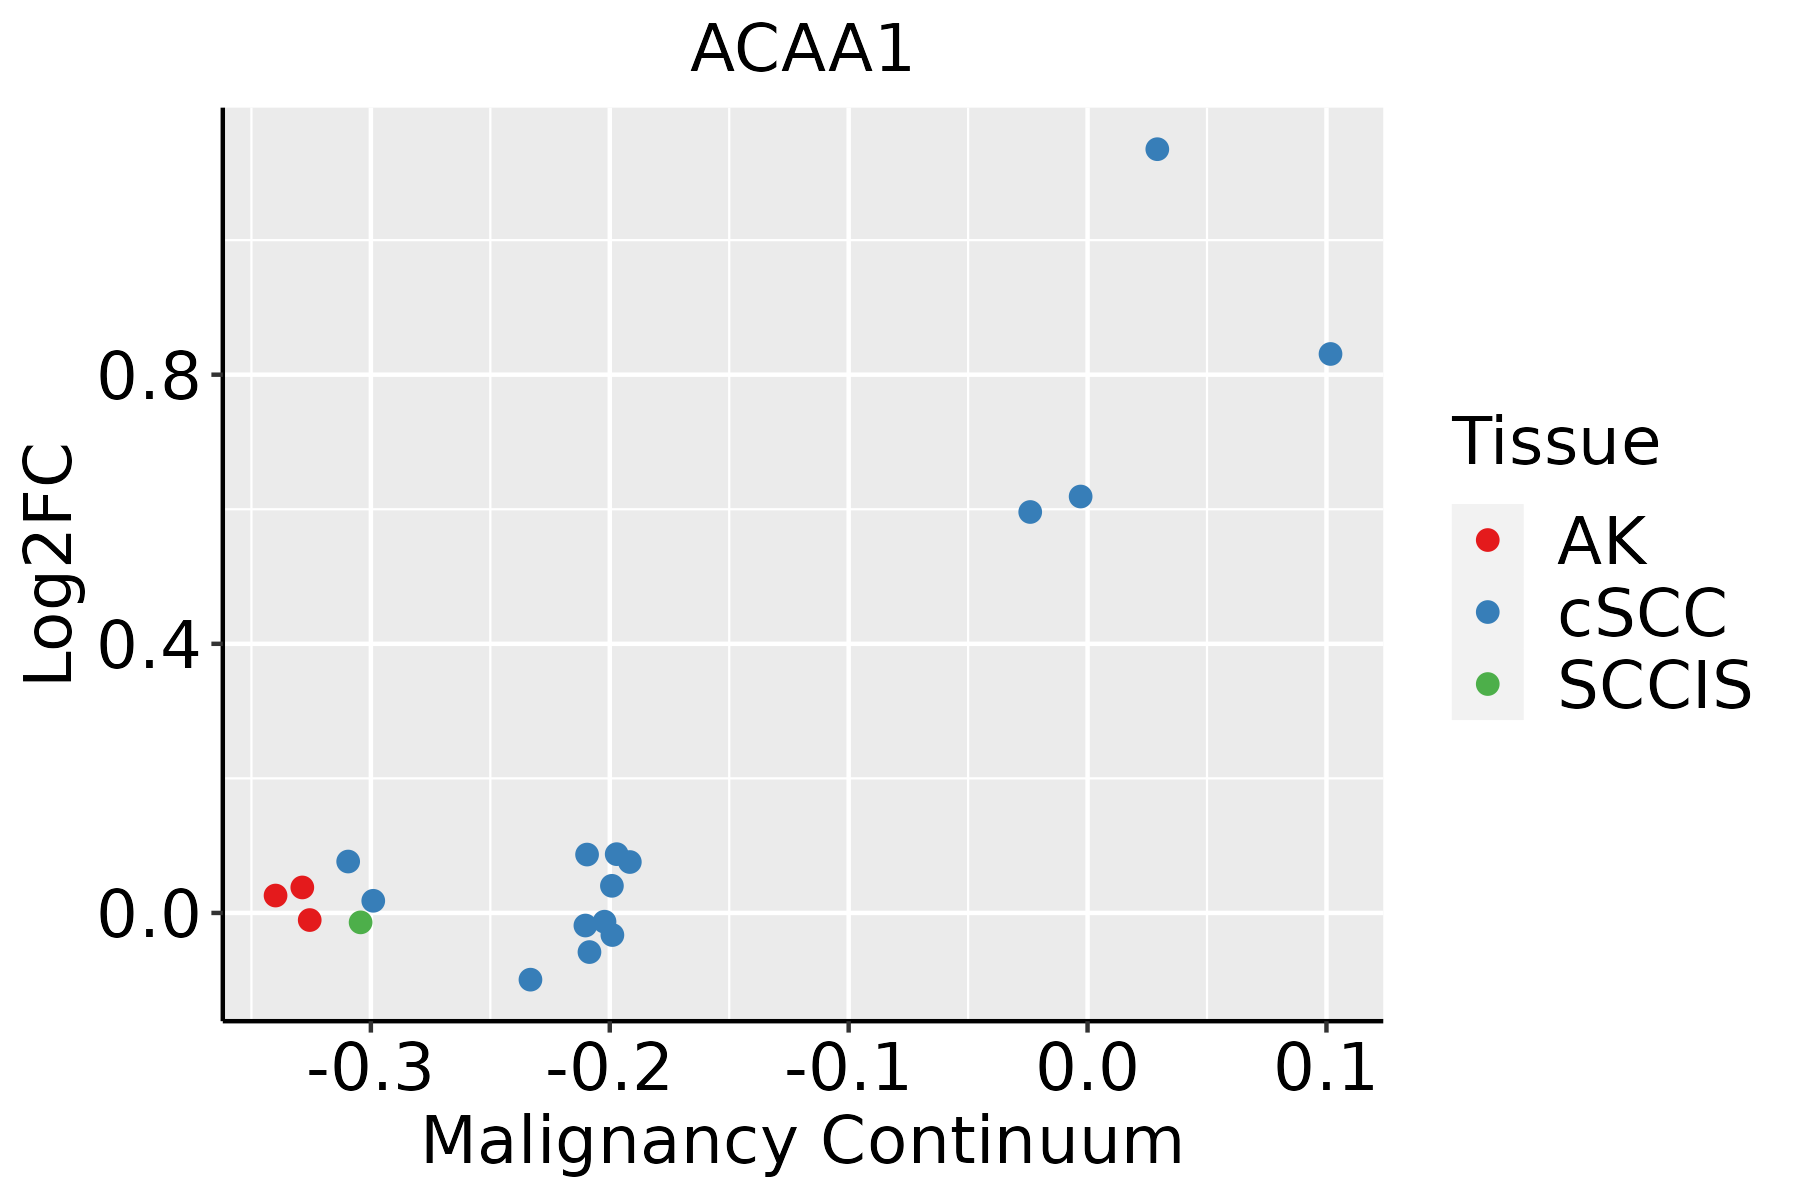 | AK: Actinic keratosis |
| cSCC: Cutaneous squamous cell carcinoma | ||
| SCCIS:squamous cell carcinoma in situ | ||
| Thyroid |  | ATC: Anaplastic thyroid cancer |
| HT: Hashimoto's thyroiditis | ||
| PTC: Papillary thyroid cancer |
| ∗log2FC in expression of this searched gene in stem-like cells from each diseased tissue sample relative to stem-like cells in normal samples in each tissue plotted against the malignancy continuum. Samples are colored based on if they are from different disease stage. |
Top |
Malignant transformation related pathway analysis |
| Find out the enriched GO biological processes and KEGG pathways involved in transition from healthy to precancer to cancer |
| Tissue | Disease Stage | Enriched GO biological Processes |
| Stomach | WIM |  |
| Stomach | SIM |  |
| Liver | NAFLD |  |
| Liver | Cirrhotic |  |
| Liver | HCC |  |
| ∗Top 15 enriched GO BP terms are showed in the bar plot of each disease state in each tissue. Each row represents a significant GO biological process which is colored according to the -log10(p.adjust). |
| Page: 1 2 3 4 5 6 7 8 9 |
| GO ID | Tissue | Disease Stage | Description | Gene Ratio | Bg Ratio | pvalue | p.adjust | Count |
| GO:001943918 | Esophagus | ESCC | aromatic compound catabolic process | 295/8552 | 467/18723 | 1.09e-14 | 5.98e-13 | 295 |
| GO:190136118 | Esophagus | ESCC | organic cyclic compound catabolic process | 307/8552 | 495/18723 | 9.99e-14 | 4.80e-12 | 307 |
| GO:00193958 | Esophagus | ESCC | fatty acid oxidation | 69/8552 | 103/18723 | 9.95e-06 | 9.44e-05 | 69 |
| GO:00344407 | Esophagus | ESCC | lipid oxidation | 71/8552 | 108/18723 | 2.00e-05 | 1.74e-04 | 71 |
| GO:00090628 | Esophagus | ESCC | fatty acid catabolic process | 66/8552 | 100/18723 | 3.21e-05 | 2.66e-04 | 66 |
| GO:00066318 | Esophagus | ESCC | fatty acid metabolic process | 217/8552 | 390/18723 | 4.21e-05 | 3.39e-04 | 217 |
| GO:000941020 | Esophagus | ESCC | response to xenobiotic stimulus | 253/8552 | 462/18723 | 4.55e-05 | 3.58e-04 | 253 |
| GO:00066358 | Esophagus | ESCC | fatty acid beta-oxidation | 50/8552 | 74/18723 | 1.16e-04 | 8.04e-04 | 50 |
| GO:00723297 | Esophagus | ESCC | monocarboxylic acid catabolic process | 74/8552 | 122/18723 | 6.03e-04 | 3.27e-03 | 74 |
| GO:00442427 | Esophagus | ESCC | cellular lipid catabolic process | 121/8552 | 214/18723 | 8.63e-04 | 4.43e-03 | 121 |
| GO:00442827 | Esophagus | ESCC | small molecule catabolic process | 201/8552 | 376/18723 | 1.35e-03 | 6.41e-03 | 201 |
| GO:00302586 | Esophagus | ESCC | lipid modification | 116/8552 | 212/18723 | 4.90e-03 | 1.89e-02 | 116 |
| GO:00160427 | Esophagus | ESCC | lipid catabolic process | 168/8552 | 320/18723 | 7.97e-03 | 2.84e-02 | 168 |
| GO:00463953 | Liver | NAFLD | carboxylic acid catabolic process | 73/1882 | 236/18723 | 4.16e-19 | 1.22e-15 | 73 |
| GO:00160544 | Liver | NAFLD | organic acid catabolic process | 73/1882 | 240/18723 | 1.20e-18 | 2.34e-15 | 73 |
| GO:00442825 | Liver | NAFLD | small molecule catabolic process | 91/1882 | 376/18723 | 8.96e-16 | 1.31e-12 | 91 |
| GO:00066316 | Liver | NAFLD | fatty acid metabolic process | 92/1882 | 390/18723 | 3.38e-15 | 3.29e-12 | 92 |
| GO:00194396 | Liver | NAFLD | aromatic compound catabolic process | 102/1882 | 467/18723 | 2.29e-14 | 1.91e-11 | 102 |
| GO:19013616 | Liver | NAFLD | organic cyclic compound catabolic process | 105/1882 | 495/18723 | 7.04e-14 | 5.15e-11 | 105 |
| GO:00723295 | Liver | NAFLD | monocarboxylic acid catabolic process | 39/1882 | 122/18723 | 2.40e-11 | 8.77e-09 | 39 |
| Page: 1 2 3 4 5 6 7 8 |
| Pathway ID | Tissue | Disease Stage | Description | Gene Ratio | Bg Ratio | pvalue | p.adjust | qvalue | Count |
| hsa002806 | Liver | NAFLD | Valine, leucine and isoleucine degradation | 20/1043 | 48/8465 | 3.03e-07 | 1.65e-05 | 1.33e-05 | 20 |
| hsa04146 | Liver | NAFLD | Peroxisome | 19/1043 | 82/8465 | 4.37e-03 | 4.10e-02 | 3.30e-02 | 19 |
| hsa0028011 | Liver | NAFLD | Valine, leucine and isoleucine degradation | 20/1043 | 48/8465 | 3.03e-07 | 1.65e-05 | 1.33e-05 | 20 |
| hsa041461 | Liver | NAFLD | Peroxisome | 19/1043 | 82/8465 | 4.37e-03 | 4.10e-02 | 3.30e-02 | 19 |
| hsa0028021 | Liver | Cirrhotic | Valine, leucine and isoleucine degradation | 32/2530 | 48/8465 | 1.45e-07 | 2.02e-06 | 1.24e-06 | 32 |
| hsa0007121 | Liver | Cirrhotic | Fatty acid degradation | 29/2530 | 43/8465 | 3.87e-07 | 4.95e-06 | 3.05e-06 | 29 |
| hsa012122 | Liver | Cirrhotic | Fatty acid metabolism | 32/2530 | 57/8465 | 3.12e-05 | 2.47e-04 | 1.52e-04 | 32 |
| hsa041462 | Liver | Cirrhotic | Peroxisome | 36/2530 | 82/8465 | 4.79e-03 | 1.74e-02 | 1.07e-02 | 36 |
| hsa0332021 | Liver | Cirrhotic | PPAR signaling pathway | 32/2530 | 75/8465 | 1.24e-02 | 3.92e-02 | 2.42e-02 | 32 |
| hsa01040 | Liver | Cirrhotic | Biosynthesis of unsaturated fatty acids | 14/2530 | 27/8465 | 1.36e-02 | 4.25e-02 | 2.62e-02 | 14 |
| hsa0028031 | Liver | Cirrhotic | Valine, leucine and isoleucine degradation | 32/2530 | 48/8465 | 1.45e-07 | 2.02e-06 | 1.24e-06 | 32 |
| hsa0007131 | Liver | Cirrhotic | Fatty acid degradation | 29/2530 | 43/8465 | 3.87e-07 | 4.95e-06 | 3.05e-06 | 29 |
| hsa012123 | Liver | Cirrhotic | Fatty acid metabolism | 32/2530 | 57/8465 | 3.12e-05 | 2.47e-04 | 1.52e-04 | 32 |
| hsa041463 | Liver | Cirrhotic | Peroxisome | 36/2530 | 82/8465 | 4.79e-03 | 1.74e-02 | 1.07e-02 | 36 |
| hsa0332031 | Liver | Cirrhotic | PPAR signaling pathway | 32/2530 | 75/8465 | 1.24e-02 | 3.92e-02 | 2.42e-02 | 32 |
| hsa010401 | Liver | Cirrhotic | Biosynthesis of unsaturated fatty acids | 14/2530 | 27/8465 | 1.36e-02 | 4.25e-02 | 2.62e-02 | 14 |
| hsa0028041 | Liver | HCC | Valine, leucine and isoleucine degradation | 41/4020 | 48/8465 | 4.84e-08 | 7.05e-07 | 3.92e-07 | 41 |
| hsa012124 | Liver | HCC | Fatty acid metabolism | 45/4020 | 57/8465 | 1.05e-06 | 1.10e-05 | 6.09e-06 | 45 |
| hsa041464 | Liver | HCC | Peroxisome | 58/4020 | 82/8465 | 1.57e-05 | 1.05e-04 | 5.85e-05 | 58 |
| hsa0007141 | Liver | HCC | Fatty acid degradation | 33/4020 | 43/8465 | 8.41e-05 | 4.27e-04 | 2.37e-04 | 33 |
| Page: 1 2 3 |
Top |
Cell-cell communication analysis |
| Identification of potential cell-cell interactions between two cell types and their ligand-receptor pairs for different disease states |
| Ligand | Receptor | LRpair | Pathway | Tissue | Disease Stage |
| Page: 1 |
Top |
Single-cell gene regulatory network inference analysis |
| Find out the significant the regulons (TFs) and the target genes of each regulon across cell types for different disease states |
| TF | Cell Type | Tissue | Disease Stage | Target Gene | RSS | Regulon Activity |
| ACAA1 | NK | Stomach | WIM | LINC01781,ZFY,PYCARD, etc. | 4.81e-02 |  |
| ∗The dot plots of a searched regulon are shown for all cell subpopulations in each disease state of each tissue based on the regulon specific score inferred using pySCENIC and by calculating the average expression. |
| Page: 1 |
Top |
Somatic mutation of malignant transformation related genes |
| Annotation of somatic variants for genes involved in malignant transformation |
| Hugo Symbol | Variant Class | Variant Classification | dbSNP RS | HGVSc | HGVSp | HGVSp Short | SWISSPROT | BIOTYPE | SIFT | PolyPhen | Tumor Sample Barcode | Tissue | Histology | Sex | Age | Stage | Therapy Types | Drugs | Outcome |
| ACAA1 | SNV | Missense_Mutation | c.439N>A | p.Ala147Thr | p.A147T | P09110 | protein_coding | deleterious(0) | probably_damaging(0.951) | TCGA-AA-3710-01 | Colorectum | colon adenocarcinoma | Female | >=65 | I/II | Unknown | Unknown | SD | |
| ACAA1 | SNV | Missense_Mutation | novel | c.1036N>A | p.Glu346Lys | p.E346K | P09110 | protein_coding | deleterious(0.02) | probably_damaging(0.973) | TCGA-AA-A004-01 | Colorectum | colon adenocarcinoma | Male | >=65 | I/II | Unknown | Unknown | SD |
| ACAA1 | SNV | Missense_Mutation | c.49T>C | p.Ser17Pro | p.S17P | P09110 | protein_coding | tolerated(0.12) | benign(0) | TCGA-CK-4951-01 | Colorectum | colon adenocarcinoma | Female | >=65 | I/II | Unknown | Unknown | PD | |
| ACAA1 | SNV | Missense_Mutation | c.895N>G | p.Pro299Ala | p.P299A | P09110 | protein_coding | deleterious(0.01) | possibly_damaging(0.513) | TCGA-D5-6532-01 | Colorectum | colon adenocarcinoma | Male | <65 | I/II | Unknown | Unknown | SD | |
| ACAA1 | SNV | Missense_Mutation | c.848N>T | p.Ala283Val | p.A283V | P09110 | protein_coding | deleterious(0) | probably_damaging(0.923) | TCGA-DM-A1HB-01 | Colorectum | colon adenocarcinoma | Male | >=65 | III/IV | Unknown | Unknown | SD | |
| ACAA1 | SNV | Missense_Mutation | c.374N>T | p.Ser125Leu | p.S125L | P09110 | protein_coding | deleterious(0) | probably_damaging(1) | TCGA-G4-6304-01 | Colorectum | colon adenocarcinoma | Female | >=65 | I/II | Chemotherapy | fluorouracil | PD | |
| ACAA1 | deletion | Frame_Shift_Del | c.1105delN | p.Leu369TrpfsTer7 | p.L369Wfs*7 | P09110 | protein_coding | TCGA-AZ-4615-01 | Colorectum | colon adenocarcinoma | Male | >=65 | III/IV | Chemotherapy | xeloda | PD | |||
| ACAA1 | SNV | Missense_Mutation | novel | c.1264N>A | p.Pro422Thr | p.P422T | P09110 | protein_coding | deleterious_low_confidence(0.03) | possibly_damaging(0.625) | TCGA-A5-A0G2-01 | Endometrium | uterine corpus endometrioid carcinoma | Female | <65 | III/IV | Unknown | Unknown | SD |
| ACAA1 | SNV | Missense_Mutation | novel | c.970N>A | p.Ala324Thr | p.A324T | P09110 | protein_coding | deleterious(0) | probably_damaging(0.993) | TCGA-A5-A0G2-01 | Endometrium | uterine corpus endometrioid carcinoma | Female | <65 | III/IV | Unknown | Unknown | SD |
| ACAA1 | SNV | Missense_Mutation | rs749249005 | c.1154N>A | p.Arg385Gln | p.R385Q | P09110 | protein_coding | deleterious(0) | probably_damaging(0.955) | TCGA-A5-A1OJ-01 | Endometrium | uterine corpus endometrioid carcinoma | Female | <65 | I/II | Unknown | Unknown | SD |
| Page: 1 2 3 |
Top |
Related drugs of malignant transformation related genes |
| Identification of chemicals and drugs interact with genes involved in malignant transfromation |
| (DGIdb 4.0) |
| Entrez ID | Symbol | Category | Interaction Types | Drug Claim Name | Drug Name | PMIDs |
| Page: 1 |

Copyright 2023-Present -The University of Texas Health Science Center at Houston |