
|
|||||
|
 | |
| |
| |
| |
| |
| |
|
Gene: YIPF3 |
Gene summary for YIPF3 |
| Gene information | Species | Human | Gene symbol | YIPF3 | Gene ID | 25844 |
| Gene name | Yip1 domain family member 3 | |
| Gene Alias | C6orf109 | |
| Cytomap | 6p21.1 | |
| Gene Type | protein-coding | GO ID | GO:0008150 | UniProtAcc | Q9GZM5 |
Top |
Malignant transformation analysis |
| Identification of the aberrant gene expression in precancerous and cancerous lesions by comparing the gene expression of stem-like cells in diseased tissues with normal stem cells |
| Entrez ID | Symbol | Replicates | Species | Organ | Tissue | Adj P-value | Log2FC | Malignancy |
| 25844 | YIPF3 | HTA11_3410_2000001011 | Human | Colorectum | AD | 1.06e-13 | 3.58e-01 | 0.0155 |
| 25844 | YIPF3 | HTA11_2487_2000001011 | Human | Colorectum | SER | 4.32e-21 | 6.70e-01 | -0.1808 |
| 25844 | YIPF3 | HTA11_2951_2000001011 | Human | Colorectum | AD | 1.01e-02 | 4.13e-01 | 0.0216 |
| 25844 | YIPF3 | HTA11_1938_2000001011 | Human | Colorectum | AD | 3.85e-14 | 5.80e-01 | -0.0811 |
| 25844 | YIPF3 | HTA11_78_2000001011 | Human | Colorectum | AD | 2.28e-11 | 3.64e-01 | -0.1088 |
| 25844 | YIPF3 | HTA11_347_2000001011 | Human | Colorectum | AD | 2.53e-33 | 7.14e-01 | -0.1954 |
| 25844 | YIPF3 | HTA11_411_2000001011 | Human | Colorectum | SER | 2.43e-14 | 1.33e+00 | -0.2602 |
| 25844 | YIPF3 | HTA11_2112_2000001011 | Human | Colorectum | SER | 9.34e-05 | 8.49e-01 | -0.2196 |
| 25844 | YIPF3 | HTA11_3361_2000001011 | Human | Colorectum | AD | 7.74e-18 | 7.04e-01 | -0.1207 |
| 25844 | YIPF3 | HTA11_83_2000001011 | Human | Colorectum | SER | 2.55e-10 | 4.46e-01 | -0.1526 |
| 25844 | YIPF3 | HTA11_696_2000001011 | Human | Colorectum | AD | 5.45e-32 | 6.57e-01 | -0.1464 |
| 25844 | YIPF3 | HTA11_866_2000001011 | Human | Colorectum | AD | 3.05e-18 | 3.83e-01 | -0.1001 |
| 25844 | YIPF3 | HTA11_1391_2000001011 | Human | Colorectum | AD | 5.02e-21 | 7.10e-01 | -0.059 |
| 25844 | YIPF3 | HTA11_2992_2000001011 | Human | Colorectum | SER | 3.07e-05 | 6.43e-01 | -0.1706 |
| 25844 | YIPF3 | HTA11_5212_2000001011 | Human | Colorectum | AD | 6.73e-07 | 5.83e-01 | -0.2061 |
| 25844 | YIPF3 | HTA11_5216_2000001011 | Human | Colorectum | SER | 6.49e-04 | 5.99e-01 | -0.1462 |
| 25844 | YIPF3 | HTA11_546_2000001011 | Human | Colorectum | AD | 2.24e-08 | 4.65e-01 | -0.0842 |
| 25844 | YIPF3 | HTA11_7862_2000001011 | Human | Colorectum | AD | 4.37e-04 | 3.35e-01 | -0.0179 |
| 25844 | YIPF3 | HTA11_866_3004761011 | Human | Colorectum | AD | 2.25e-24 | 5.91e-01 | 0.096 |
| 25844 | YIPF3 | HTA11_4255_2000001011 | Human | Colorectum | SER | 1.34e-04 | 4.62e-01 | 0.0446 |
| Page: 1 2 3 4 5 6 7 8 9 10 |
| Tissue | Expression Dynamics | Abbreviation |
| Colorectum (GSE201348) |  | FAP: Familial adenomatous polyposis |
| CRC: Colorectal cancer | ||
| Colorectum (HTA11) | 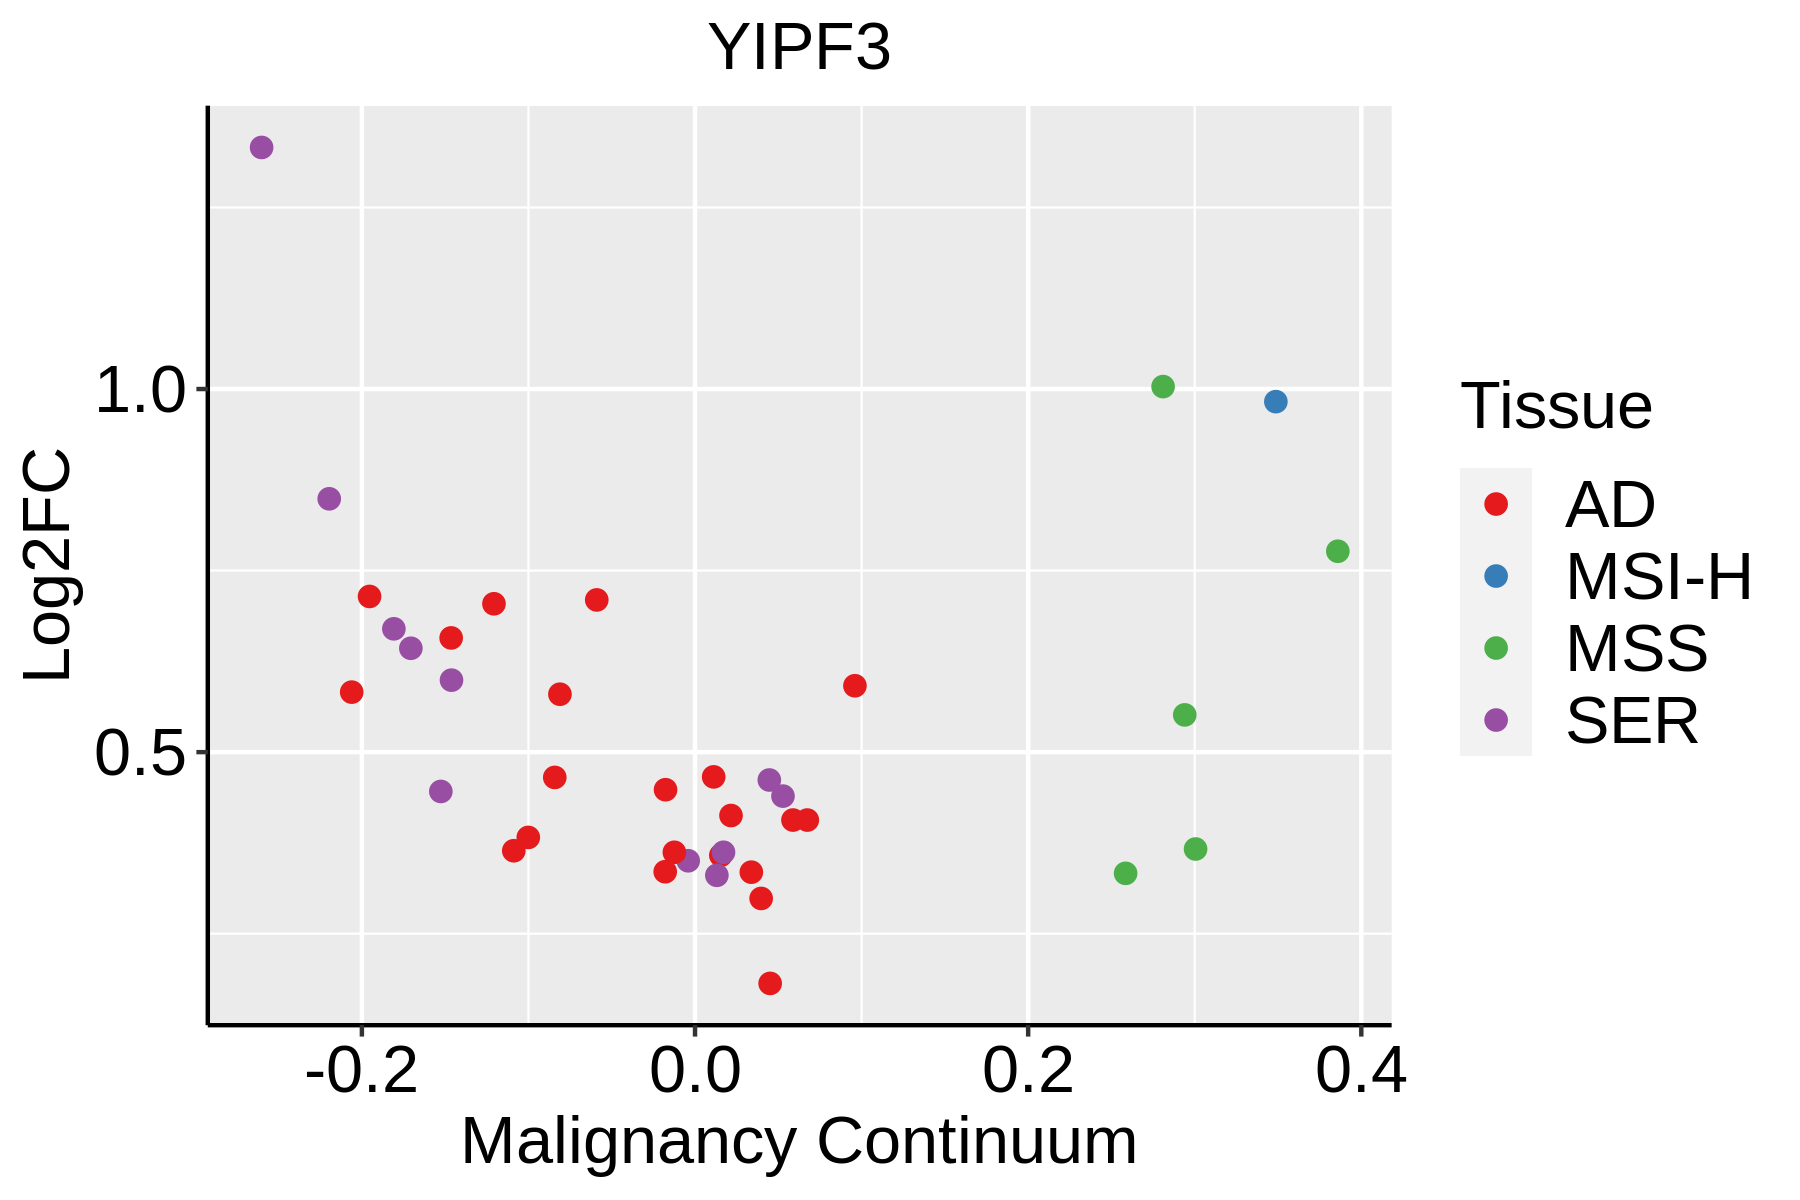 | AD: Adenomas |
| SER: Sessile serrated lesions | ||
| MSI-H: Microsatellite-high colorectal cancer | ||
| MSS: Microsatellite stable colorectal cancer | ||
| Endometrium |  | AEH: Atypical endometrial hyperplasia |
| EEC: Endometrioid Cancer | ||
| Esophagus | 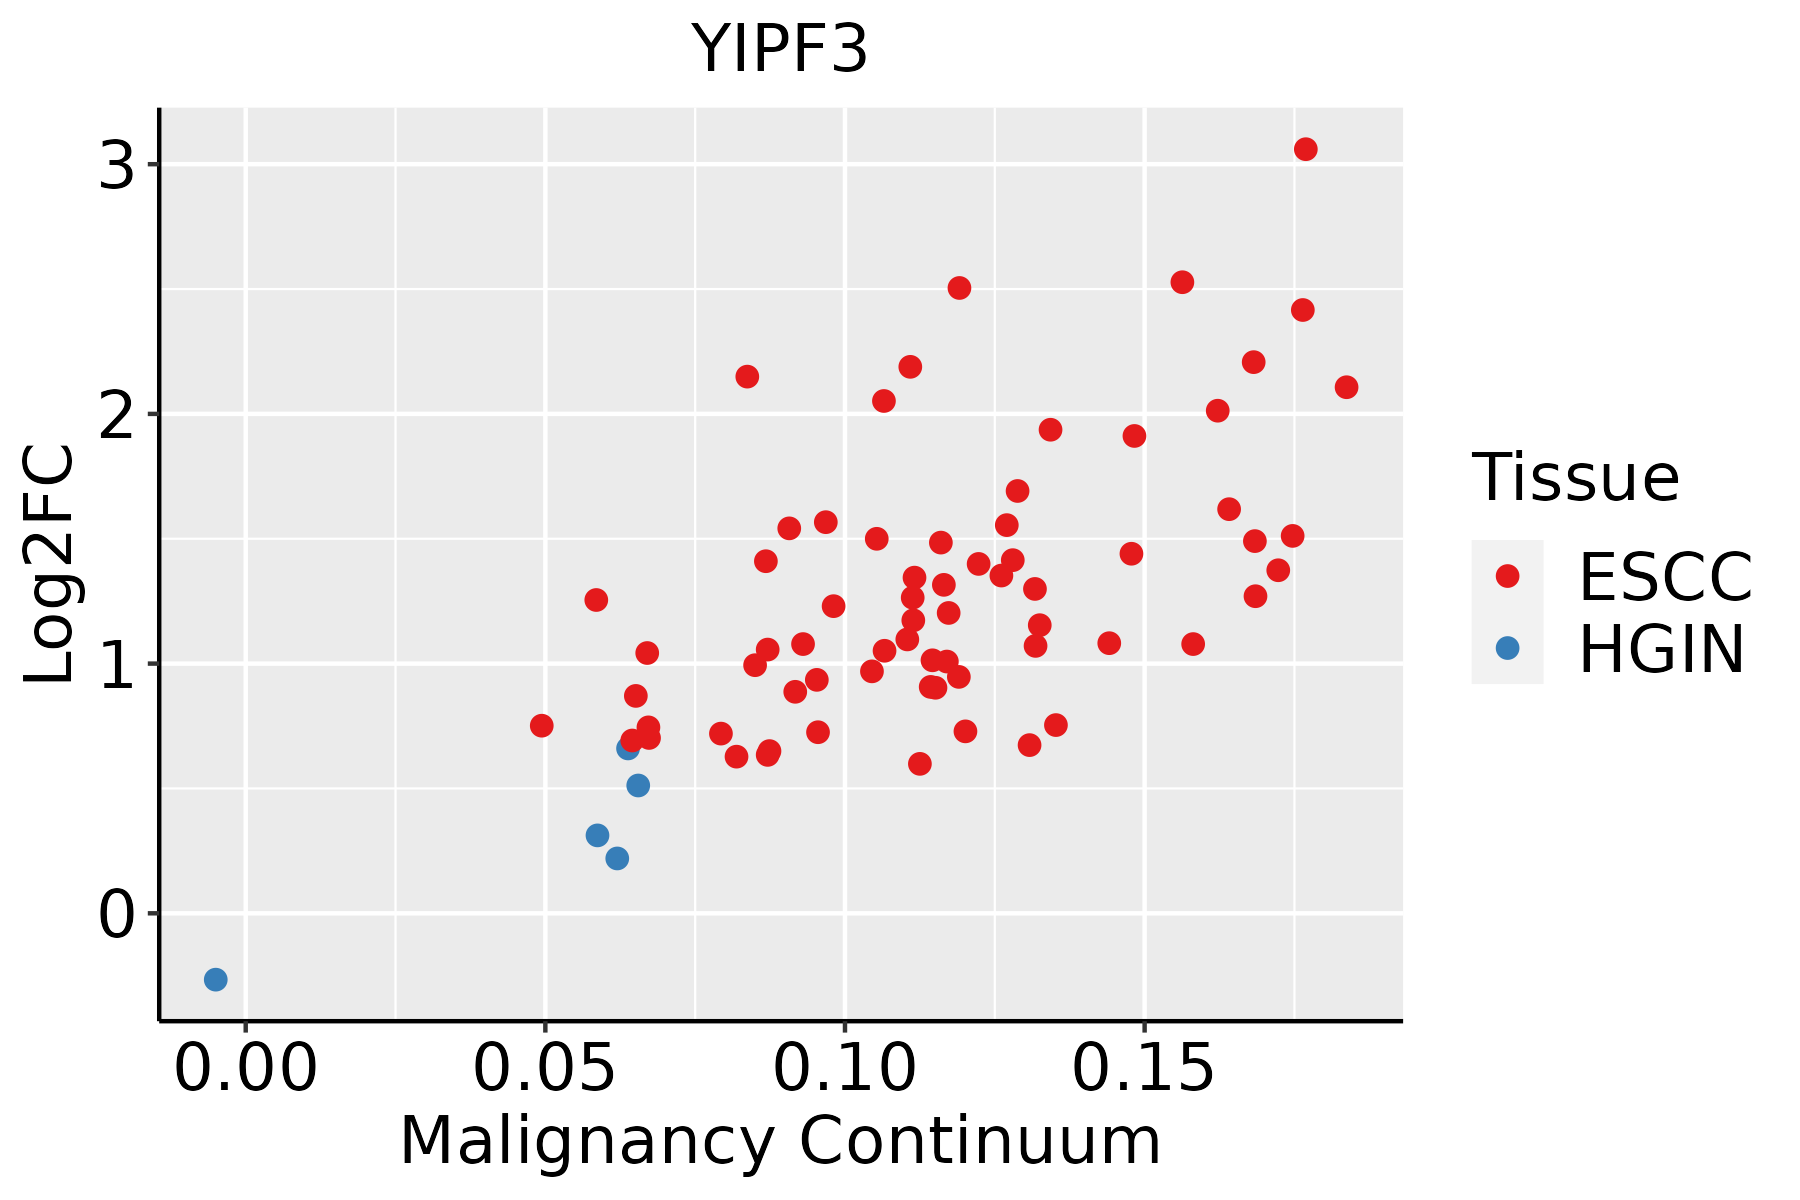 | ESCC: Esophageal squamous cell carcinoma |
| HGIN: High-grade intraepithelial neoplasias | ||
| LGIN: Low-grade intraepithelial neoplasias | ||
| Liver | 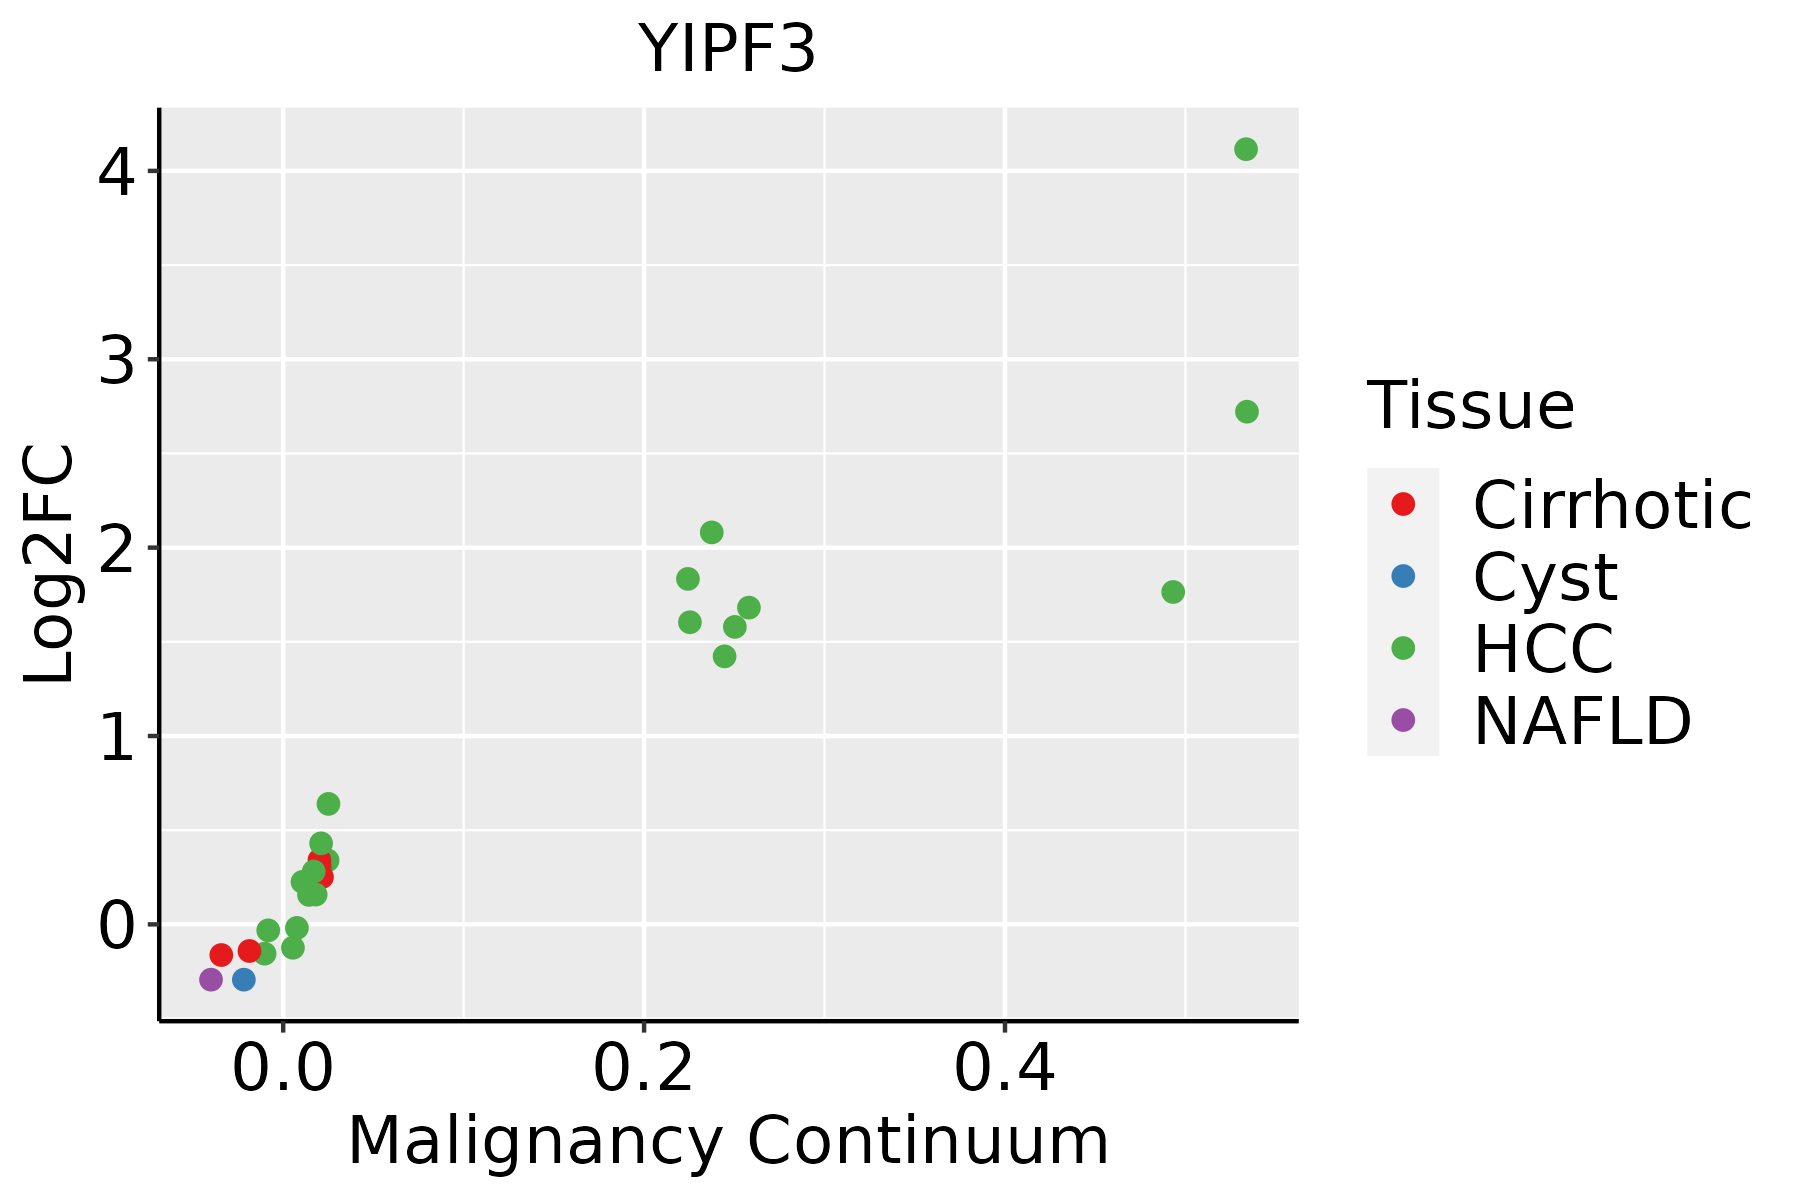 | HCC: Hepatocellular carcinoma |
| NAFLD: Non-alcoholic fatty liver disease | ||
| Oral Cavity | 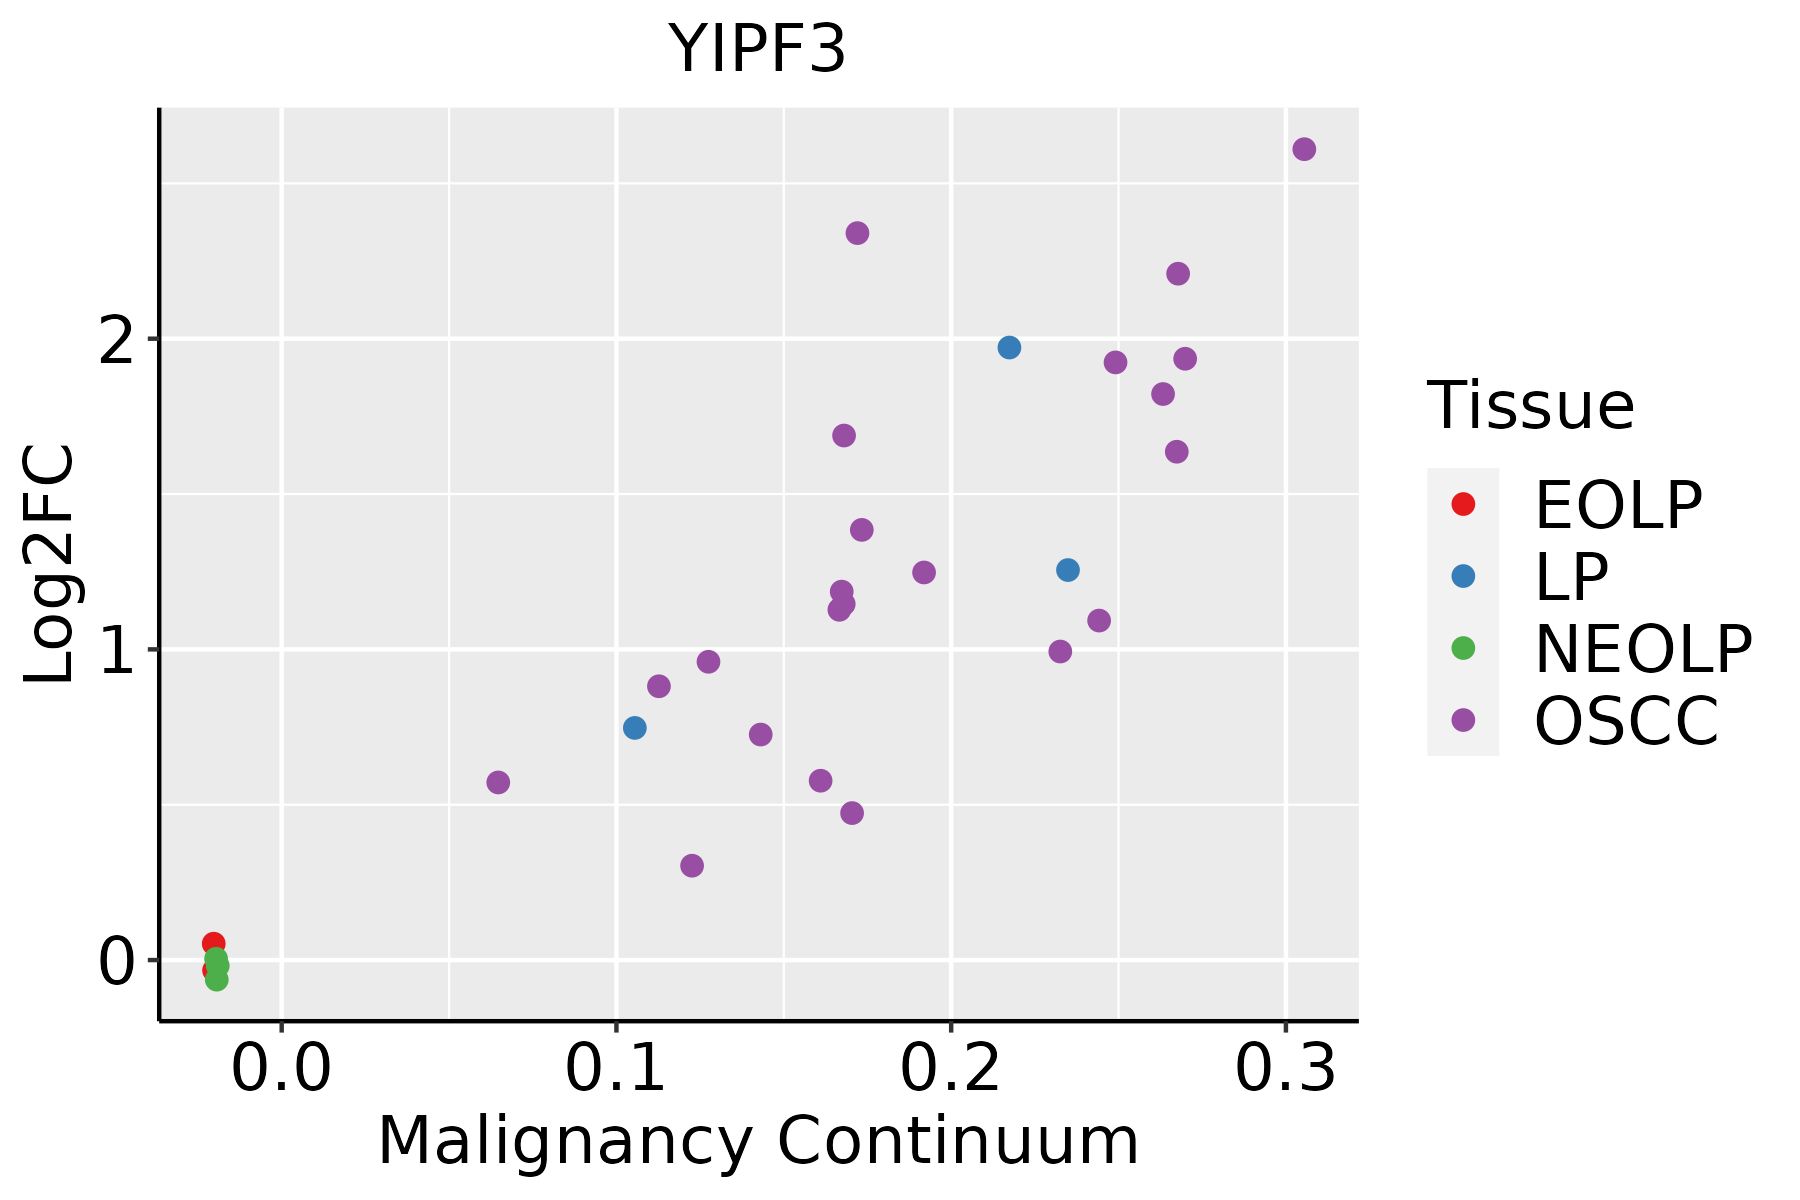 | EOLP: Erosive Oral lichen planus |
| LP: leukoplakia | ||
| NEOLP: Non-erosive oral lichen planus | ||
| OSCC: Oral squamous cell carcinoma | ||
| Prostate |  | BPH: Benign Prostatic Hyperplasia |
| Skin | 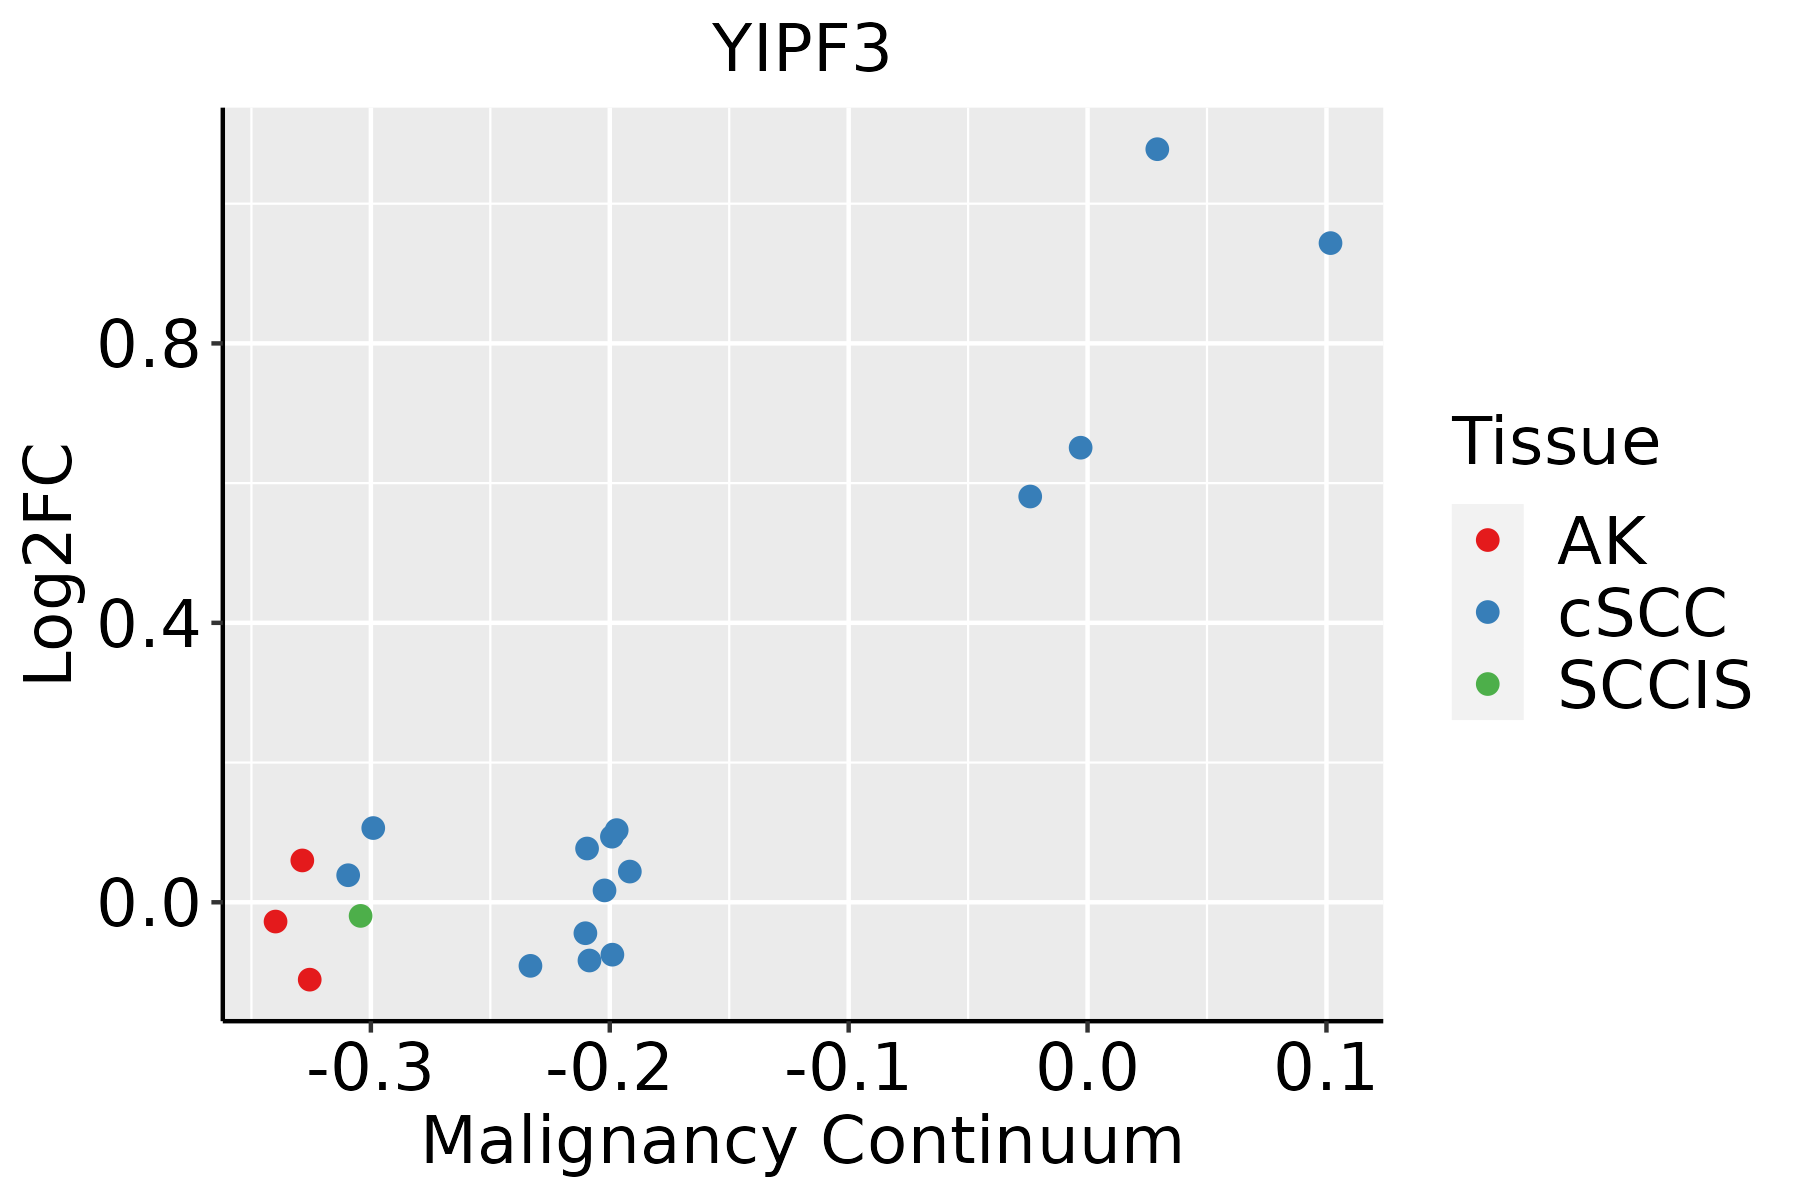 | AK: Actinic keratosis |
| cSCC: Cutaneous squamous cell carcinoma | ||
| SCCIS:squamous cell carcinoma in situ | ||
| Thyroid | 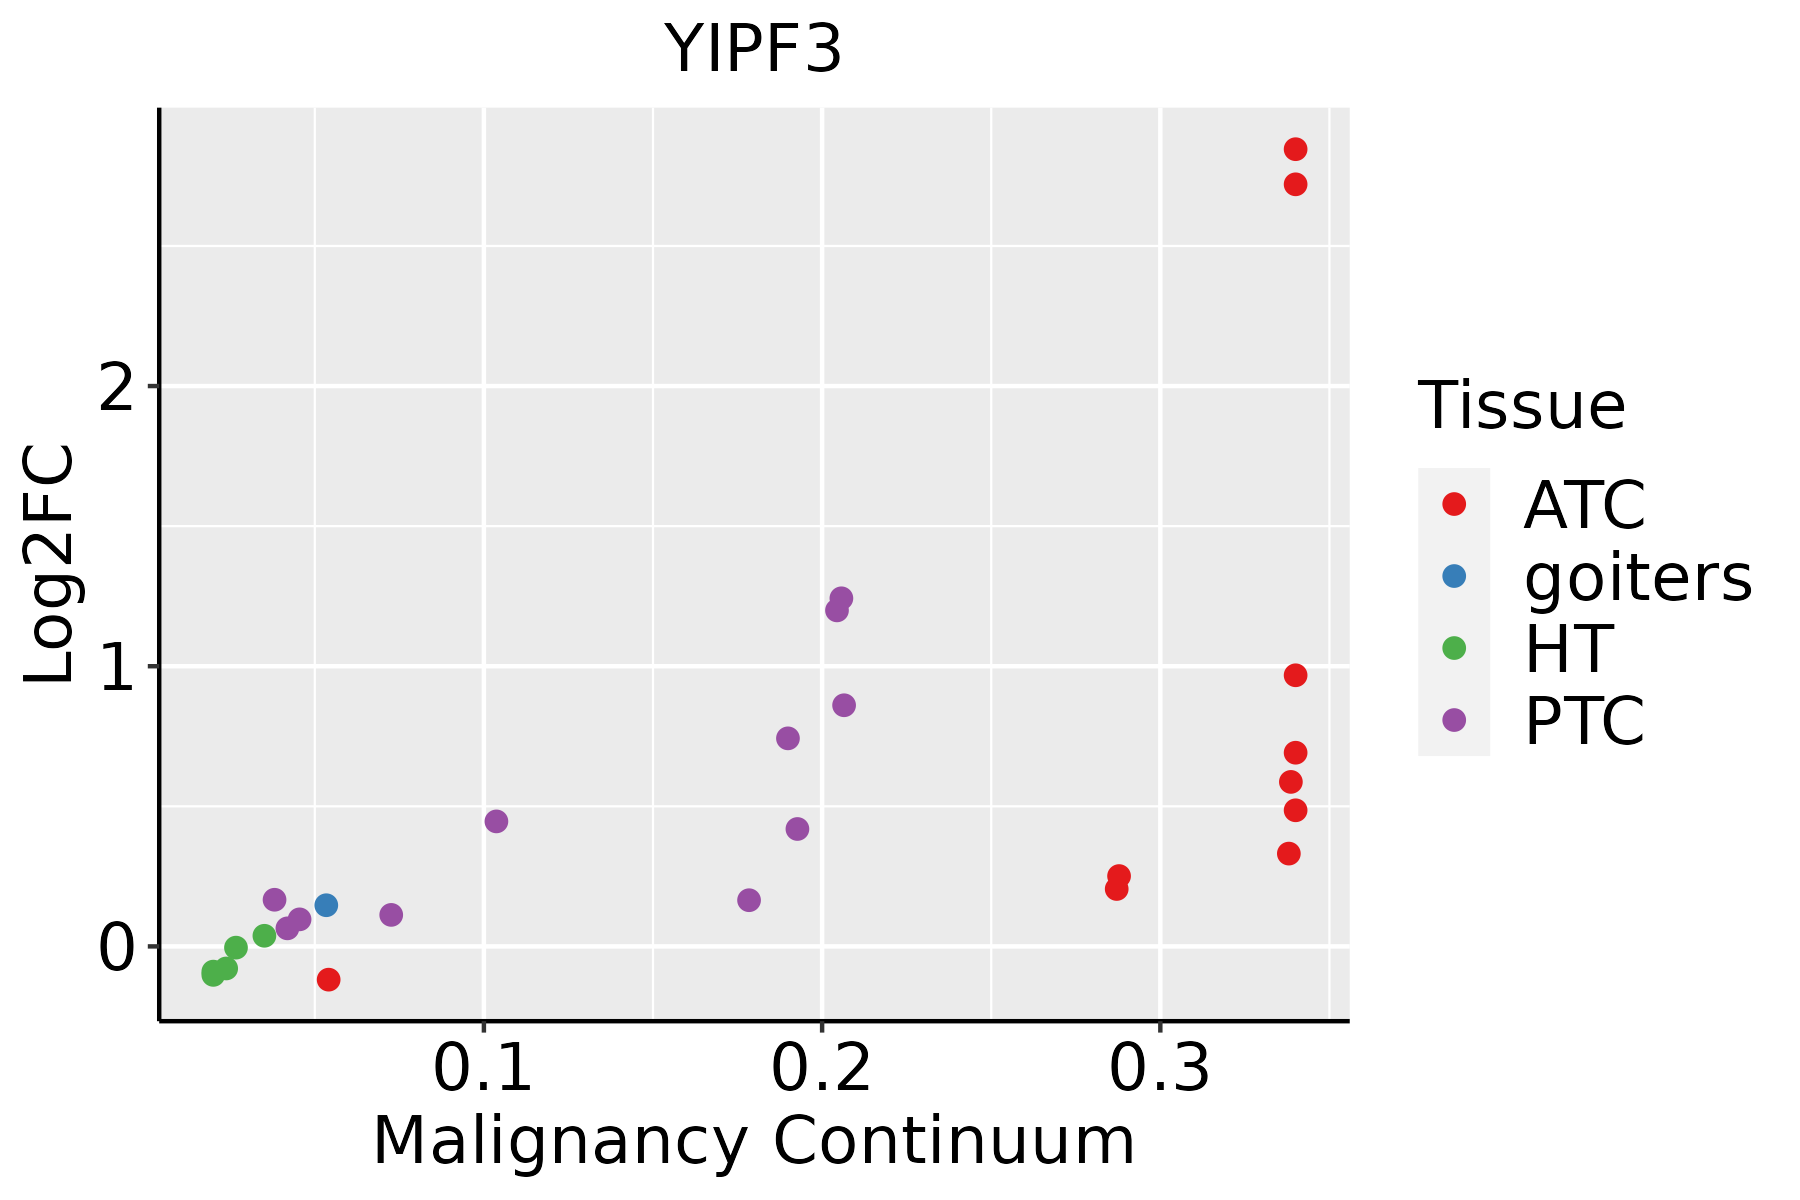 | ATC: Anaplastic thyroid cancer |
| HT: Hashimoto's thyroiditis | ||
| PTC: Papillary thyroid cancer |
| ∗log2FC in expression of this searched gene in stem-like cells from each diseased tissue sample relative to stem-like cells in normal samples in each tissue plotted against the malignancy continuum. Samples are colored based on if they are from different disease stage. |
Top |
Malignant transformation related pathway analysis |
| Find out the enriched GO biological processes and KEGG pathways involved in transition from healthy to precancer to cancer |
| Tissue | Disease Stage | Enriched GO biological Processes |
| Colorectum | CRC |  |
| Stomach | GC |  |
| Stomach | CAG with IM |  |
| Stomach | CSG |  |
| Stomach | CAG |  |
| ∗Top 15 enriched GO BP terms are showed in the bar plot of each disease state in each tissue. Each row represents a significant GO biological process which is colored according to the -log10(p.adjust). |
| Page: 1 2 3 4 5 6 7 8 9 |
| GO ID | Tissue | Disease Stage | Description | Gene Ratio | Bg Ratio | pvalue | p.adjust | Count |
| Page: 1 |
| Pathway ID | Tissue | Disease Stage | Description | Gene Ratio | Bg Ratio | pvalue | p.adjust | qvalue | Count |
| Page: 1 |
Top |
Cell-cell communication analysis |
| Identification of potential cell-cell interactions between two cell types and their ligand-receptor pairs for different disease states |
| Ligand | Receptor | LRpair | Pathway | Tissue | Disease Stage |
| Page: 1 |
Top |
Single-cell gene regulatory network inference analysis |
| Find out the significant the regulons (TFs) and the target genes of each regulon across cell types for different disease states |
| TF | Cell Type | Tissue | Disease Stage | Target Gene | RSS | Regulon Activity |
| ∗The dot plots of a searched regulon are shown for all cell subpopulations in each disease state of each tissue based on the regulon specific score inferred using pySCENIC and by calculating the average expression. |
| Page: 1 |
Top |
Somatic mutation of malignant transformation related genes |
| Annotation of somatic variants for genes involved in malignant transformation |
| Hugo Symbol | Variant Class | Variant Classification | dbSNP RS | HGVSc | HGVSp | HGVSp Short | SWISSPROT | BIOTYPE | SIFT | PolyPhen | Tumor Sample Barcode | Tissue | Histology | Sex | Age | Stage | Therapy Types | Drugs | Outcome |
| YIPF3 | SNV | Missense_Mutation | c.719A>G | p.His240Arg | p.H240R | Q9GZM5 | protein_coding | deleterious(0) | probably_damaging(0.978) | TCGA-A7-A0CJ-01 | Breast | breast invasive carcinoma | Female | <65 | I/II | Chemotherapy | cytoxan | SD | |
| YIPF3 | insertion | Frame_Shift_Ins | novel | c.914_915insAC | p.Asp305GlufsTer42 | p.D305Efs*42 | Q9GZM5 | protein_coding | TCGA-A2-A0D1-01 | Breast | breast invasive carcinoma | Female | >=65 | I/II | Chemotherapy | taxotere | SD | ||
| YIPF3 | insertion | Frame_Shift_Ins | novel | c.912_913insCAAGGCTCTGCAGCCAATGCAGAAAATGGGTCAGCTCCTTTGA | p.Asp305GlnfsTer166 | p.D305Qfs*166 | Q9GZM5 | protein_coding | TCGA-A2-A0D1-01 | Breast | breast invasive carcinoma | Female | >=65 | I/II | Chemotherapy | taxotere | SD | ||
| YIPF3 | insertion | Frame_Shift_Ins | novel | c.558_559insCAGCGGCTGCTCCTCTGTG | p.Ala187GlnfsTer58 | p.A187Qfs*58 | Q9GZM5 | protein_coding | TCGA-A8-A09C-01 | Breast | breast invasive carcinoma | Female | >=65 | I/II | Unknown | Unknown | SD | ||
| YIPF3 | SNV | Missense_Mutation | novel | c.95C>T | p.Ala32Val | p.A32V | Q9GZM5 | protein_coding | deleterious_low_confidence(0) | probably_damaging(0.99) | TCGA-2W-A8YY-01 | Cervix | cervical & endocervical cancer | Female | <65 | I/II | Chemotherapy | cisplatin | CR |
| YIPF3 | SNV | Missense_Mutation | c.237N>G | p.Phe79Leu | p.F79L | Q9GZM5 | protein_coding | tolerated(0.13) | benign(0) | TCGA-C5-A1BK-01 | Cervix | cervical & endocervical cancer | Female | <65 | I/II | Unknown | Unknown | SD | |
| YIPF3 | SNV | Missense_Mutation | c.142N>C | p.Glu48Gln | p.E48Q | Q9GZM5 | protein_coding | deleterious_low_confidence(0.01) | probably_damaging(0.992) | TCGA-EK-A3GK-01 | Cervix | cervical & endocervical cancer | Female | <65 | I/II | Unknown | Unknown | SD | |
| YIPF3 | SNV | Missense_Mutation | novel | c.181N>A | p.Glu61Lys | p.E61K | Q9GZM5 | protein_coding | tolerated(0.17) | possibly_damaging(0.877) | TCGA-JW-A5VL-01 | Cervix | cervical & endocervical cancer | Female | <65 | I/II | Unknown | Unknown | SD |
| YIPF3 | SNV | Missense_Mutation | c.403N>A | p.Glu135Lys | p.E135K | Q9GZM5 | protein_coding | tolerated(0.22) | probably_damaging(0.987) | TCGA-AA-3510-01 | Colorectum | colon adenocarcinoma | Male | >=65 | I/II | Unknown | Unknown | SD | |
| YIPF3 | SNV | Missense_Mutation | rs750414199 | c.337N>A | p.Ala113Thr | p.A113T | Q9GZM5 | protein_coding | deleterious(0.01) | possibly_damaging(0.796) | TCGA-AA-3947-01 | Colorectum | colon adenocarcinoma | Female | <65 | I/II | Unknown | Unknown | SD |
| Page: 1 2 3 4 |
Top |
Related drugs of malignant transformation related genes |
| Identification of chemicals and drugs interact with genes involved in malignant transfromation |
| (DGIdb 4.0) |
| Entrez ID | Symbol | Category | Interaction Types | Drug Claim Name | Drug Name | PMIDs |
| Page: 1 |

Copyright 2023-Present -The University of Texas Health Science Center at Houston |