
|
|||||
|
 | |
| |
| |
| |
| |
| |
|
Gene: SUMO3 |
Gene summary for SUMO3 |
| Gene information | Species | Human | Gene symbol | SUMO3 | Gene ID | 6612 |
| Gene name | small ubiquitin like modifier 3 | |
| Gene Alias | SMT3A | |
| Cytomap | 21q22.3 | |
| Gene Type | protein-coding | GO ID | GO:0006464 | UniProtAcc | P55854 |
Top |
Malignant transformation analysis |
| Identification of the aberrant gene expression in precancerous and cancerous lesions by comparing the gene expression of stem-like cells in diseased tissues with normal stem cells |
| Entrez ID | Symbol | Replicates | Species | Organ | Tissue | Adj P-value | Log2FC | Malignancy |
| 6612 | SUMO3 | GSM4909281 | Human | Breast | IDC | 1.96e-09 | 4.53e-01 | 0.21 |
| 6612 | SUMO3 | GSM4909282 | Human | Breast | IDC | 2.97e-13 | 4.72e-01 | -0.0288 |
| 6612 | SUMO3 | GSM4909285 | Human | Breast | IDC | 2.80e-17 | 6.03e-01 | 0.21 |
| 6612 | SUMO3 | GSM4909288 | Human | Breast | IDC | 5.97e-06 | 2.58e-01 | 0.0988 |
| 6612 | SUMO3 | GSM4909293 | Human | Breast | IDC | 1.27e-41 | 7.70e-01 | 0.1581 |
| 6612 | SUMO3 | GSM4909294 | Human | Breast | IDC | 1.97e-07 | 3.01e-01 | 0.2022 |
| 6612 | SUMO3 | GSM4909295 | Human | Breast | IDC | 1.01e-02 | 3.54e-01 | 0.0898 |
| 6612 | SUMO3 | GSM4909296 | Human | Breast | IDC | 6.76e-10 | -5.37e-02 | 0.1524 |
| 6612 | SUMO3 | GSM4909297 | Human | Breast | IDC | 1.70e-17 | -1.06e-01 | 0.1517 |
| 6612 | SUMO3 | GSM4909301 | Human | Breast | IDC | 5.89e-04 | -1.86e-01 | 0.1577 |
| 6612 | SUMO3 | GSM4909304 | Human | Breast | IDC | 2.30e-17 | 5.11e-01 | 0.1636 |
| 6612 | SUMO3 | GSM4909307 | Human | Breast | IDC | 4.10e-04 | 3.19e-01 | 0.1569 |
| 6612 | SUMO3 | GSM4909308 | Human | Breast | IDC | 3.01e-18 | 5.57e-01 | 0.158 |
| 6612 | SUMO3 | GSM4909311 | Human | Breast | IDC | 2.20e-36 | 6.20e-03 | 0.1534 |
| 6612 | SUMO3 | GSM4909312 | Human | Breast | IDC | 1.85e-25 | 4.18e-01 | 0.1552 |
| 6612 | SUMO3 | GSM4909313 | Human | Breast | IDC | 4.88e-06 | 3.61e-02 | 0.0391 |
| 6612 | SUMO3 | GSM4909315 | Human | Breast | IDC | 1.13e-12 | 4.52e-01 | 0.21 |
| 6612 | SUMO3 | GSM4909316 | Human | Breast | IDC | 9.70e-11 | 4.66e-01 | 0.21 |
| 6612 | SUMO3 | GSM4909319 | Human | Breast | IDC | 9.29e-39 | -2.71e-01 | 0.1563 |
| 6612 | SUMO3 | GSM4909320 | Human | Breast | IDC | 1.03e-08 | -2.78e-01 | 0.1575 |
| Page: 1 2 3 4 5 6 7 8 9 10 |
| Tissue | Expression Dynamics | Abbreviation |
| Breast | 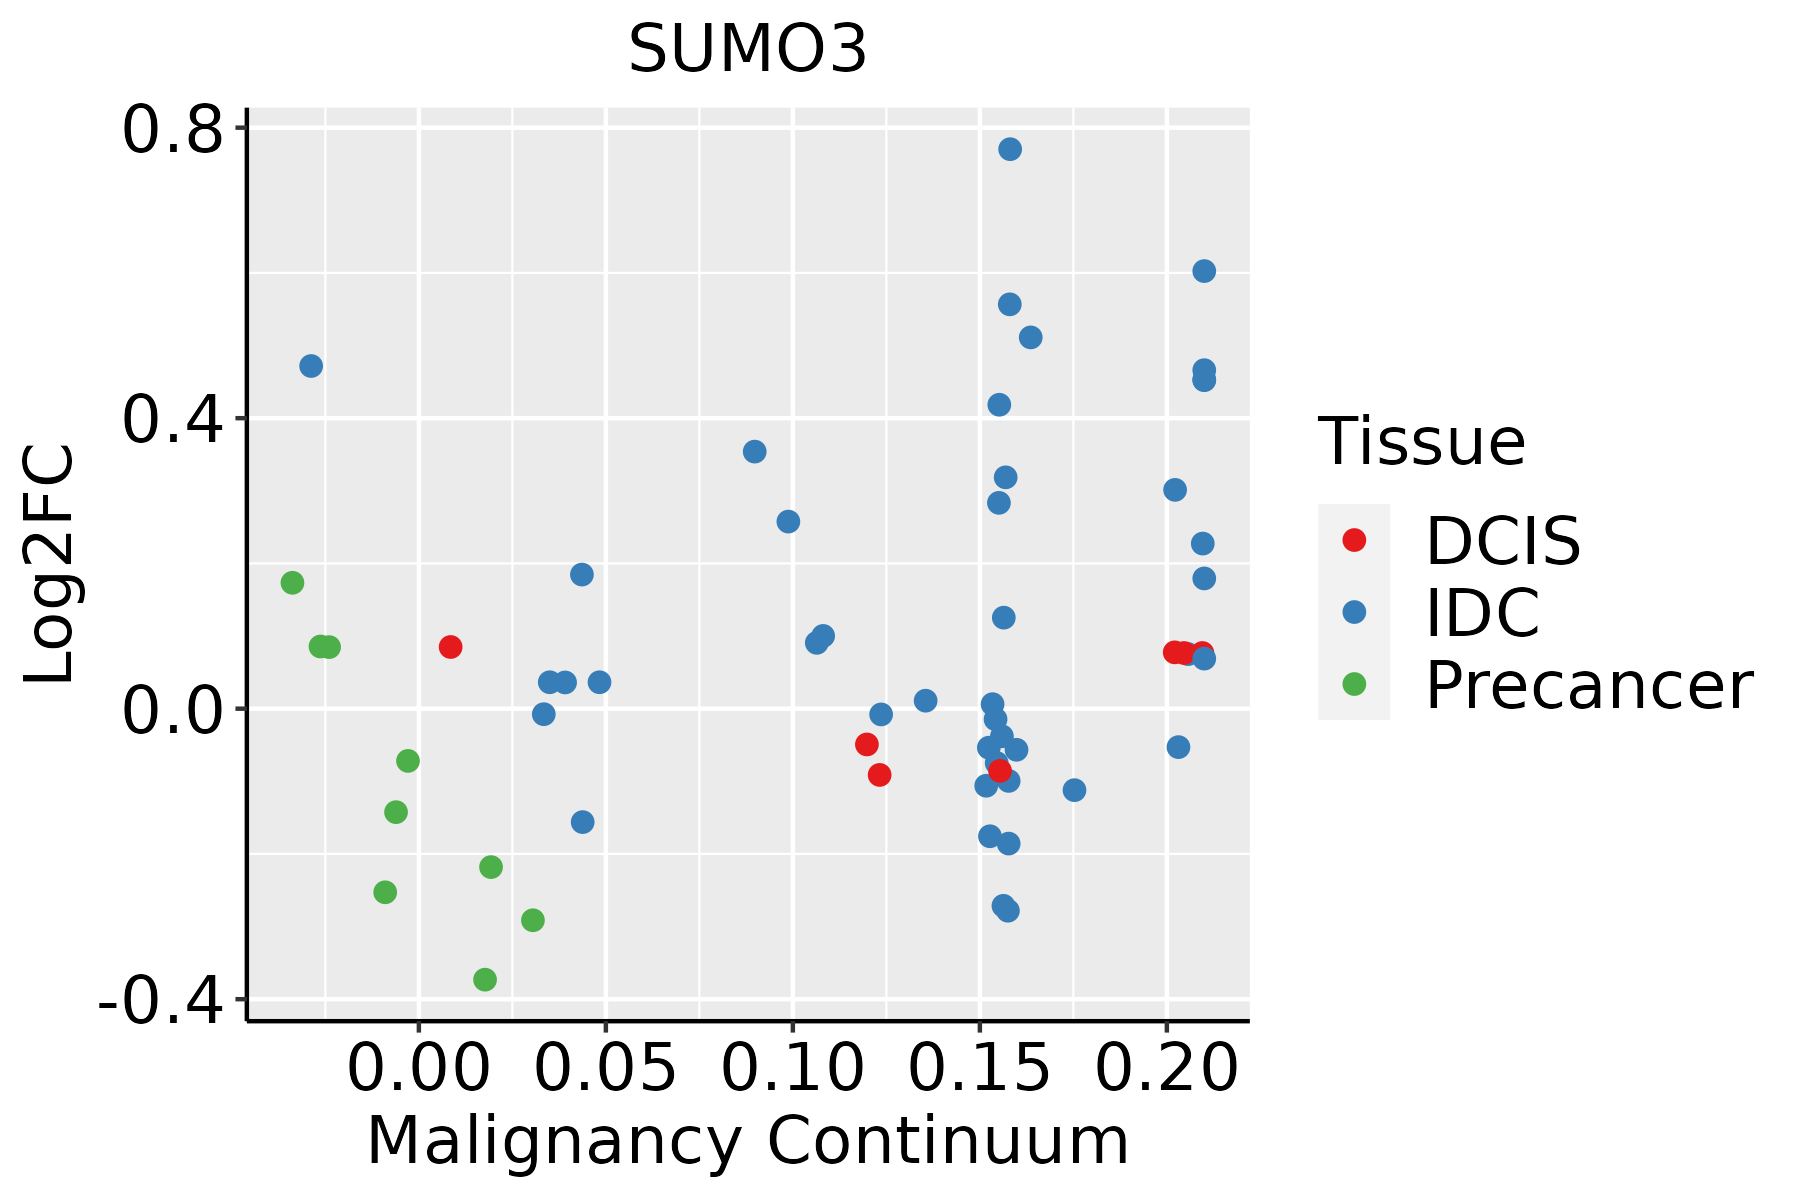 | IDC: Invasive ductal carcinoma |
| DCIS: Ductal carcinoma in situ | ||
| Precancer(BRCA1-mut): Precancerous lesion from BRCA1 mutation carriers | ||
| Colorectum (GSE201348) |  | FAP: Familial adenomatous polyposis |
| CRC: Colorectal cancer | ||
| Colorectum (HTA11) |  | AD: Adenomas |
| SER: Sessile serrated lesions | ||
| MSI-H: Microsatellite-high colorectal cancer | ||
| MSS: Microsatellite stable colorectal cancer | ||
| Endometrium | 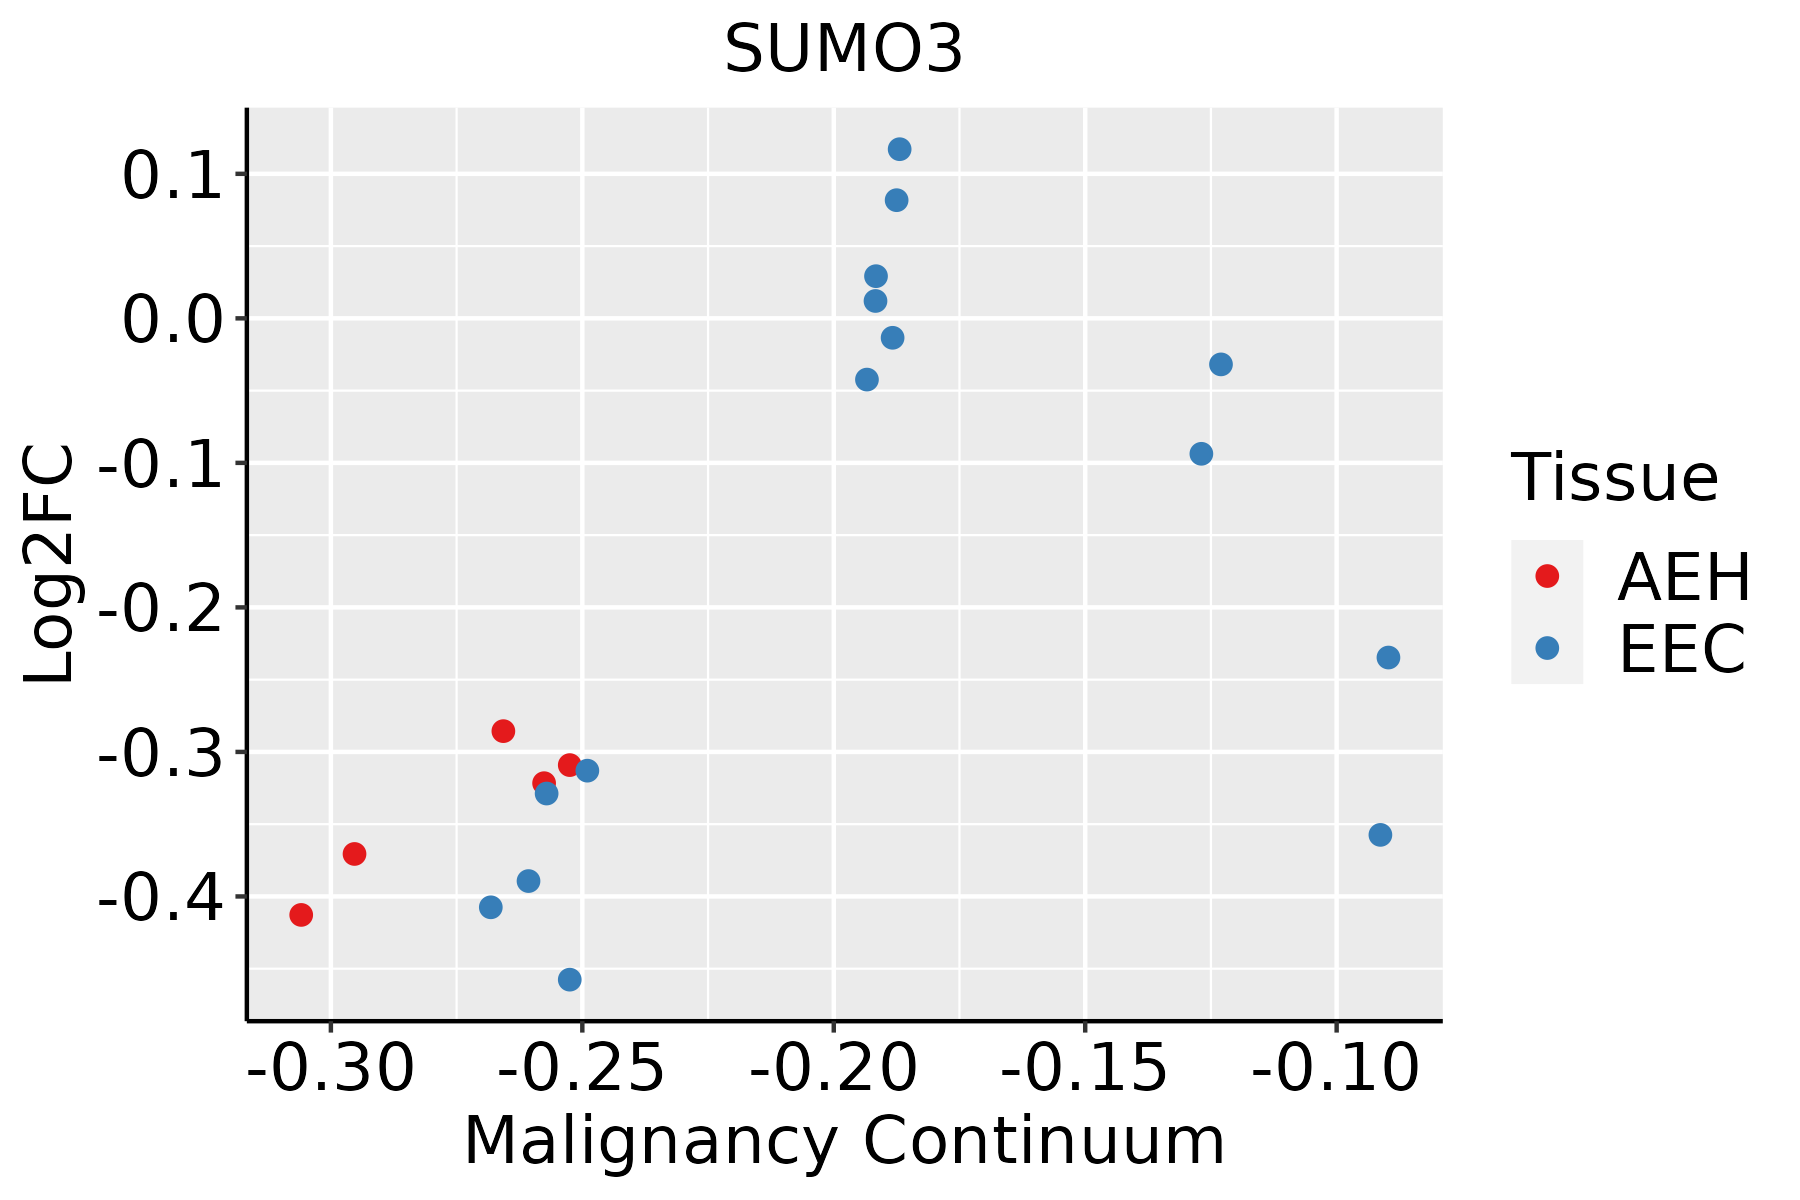 | AEH: Atypical endometrial hyperplasia |
| EEC: Endometrioid Cancer | ||
| Esophagus | 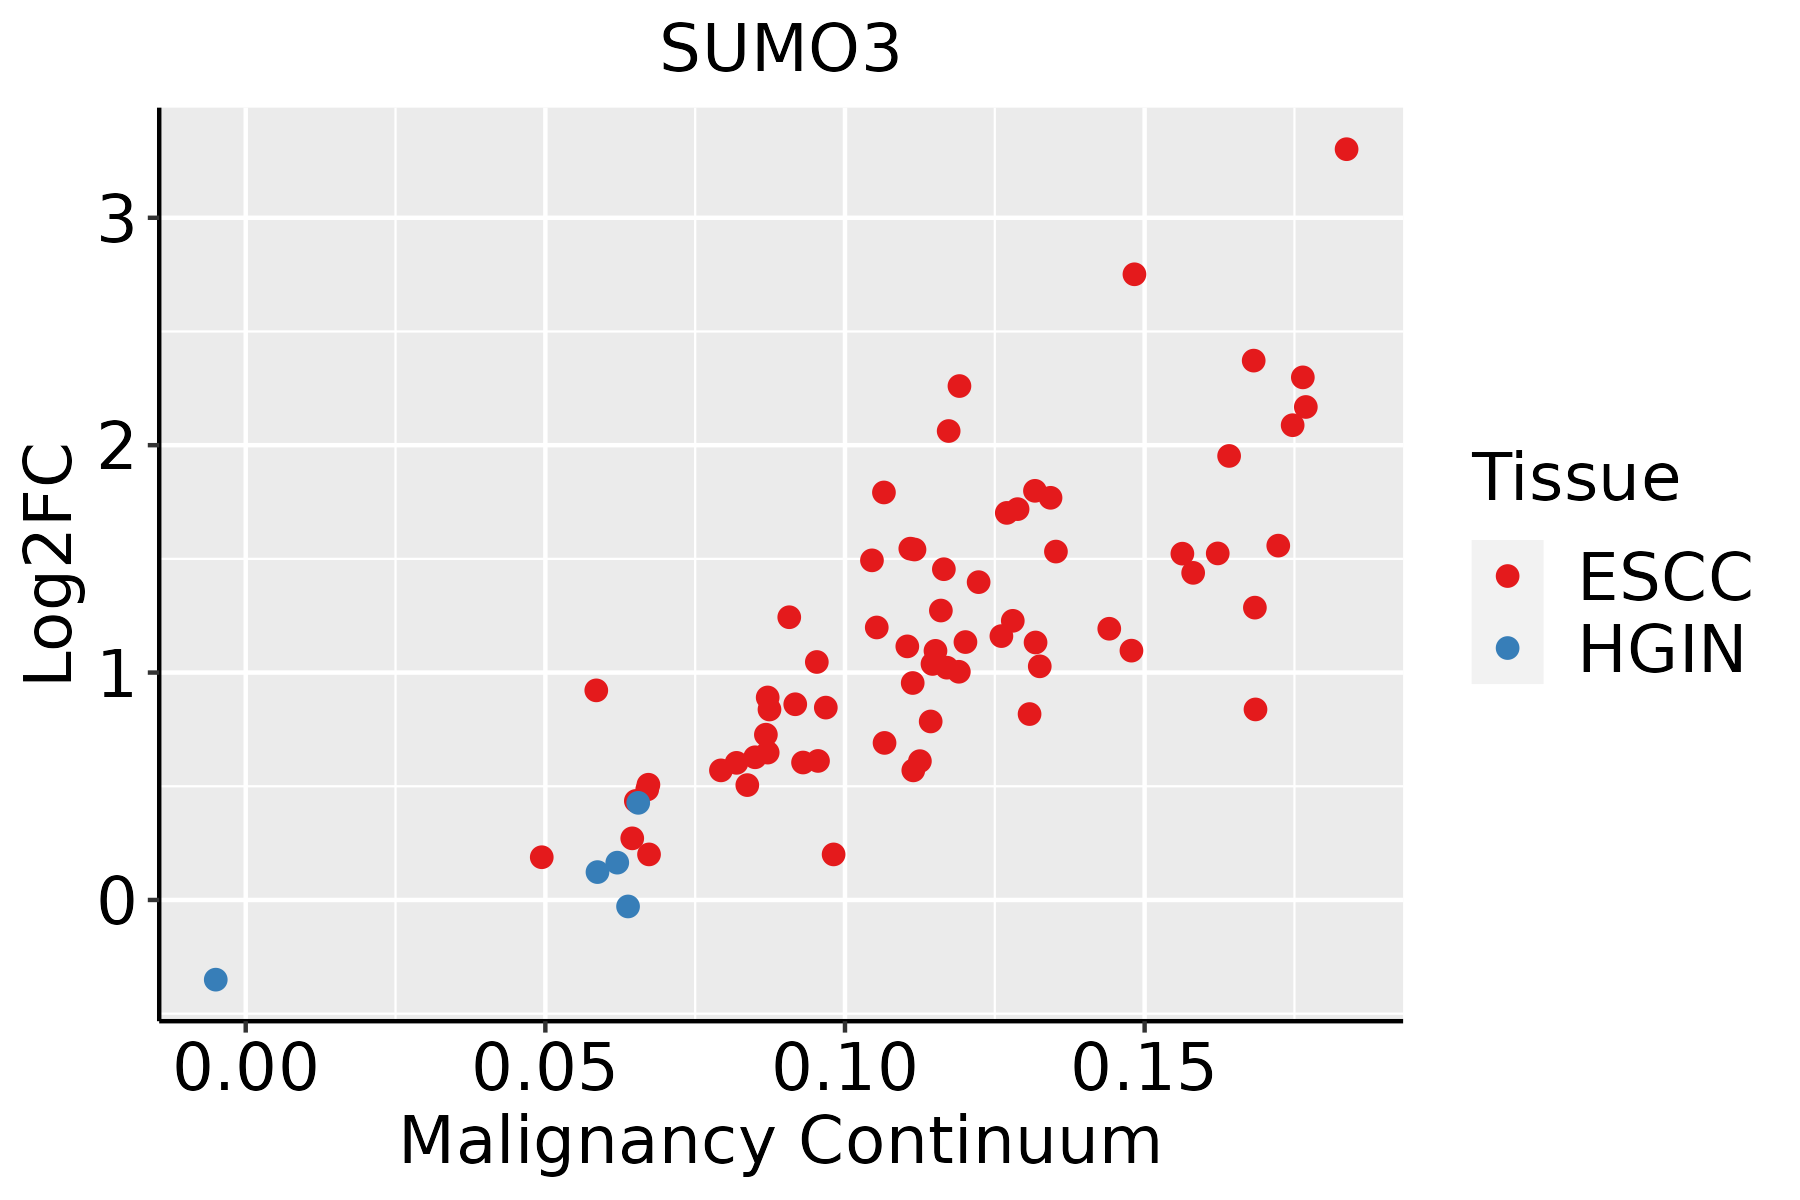 | ESCC: Esophageal squamous cell carcinoma |
| HGIN: High-grade intraepithelial neoplasias | ||
| LGIN: Low-grade intraepithelial neoplasias | ||
| Liver | 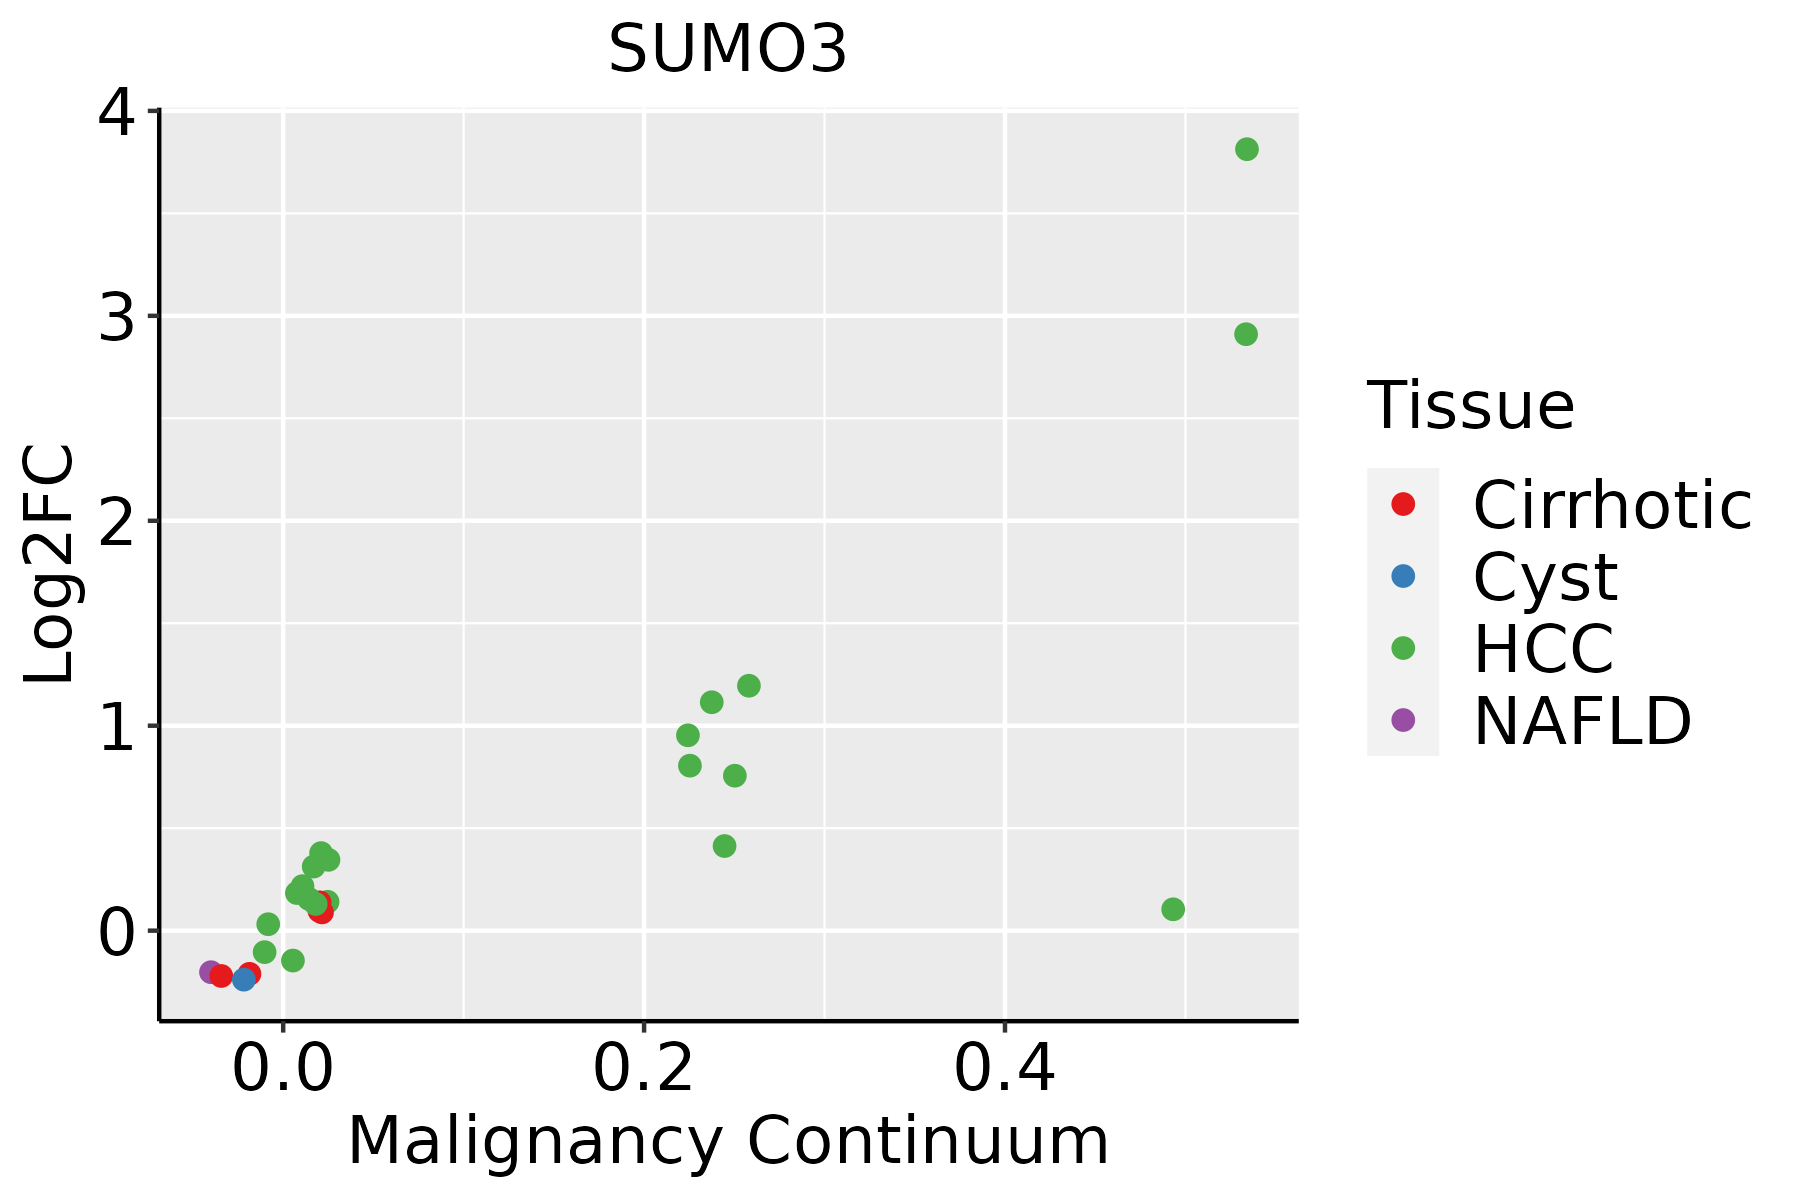 | HCC: Hepatocellular carcinoma |
| NAFLD: Non-alcoholic fatty liver disease | ||
| Oral Cavity | 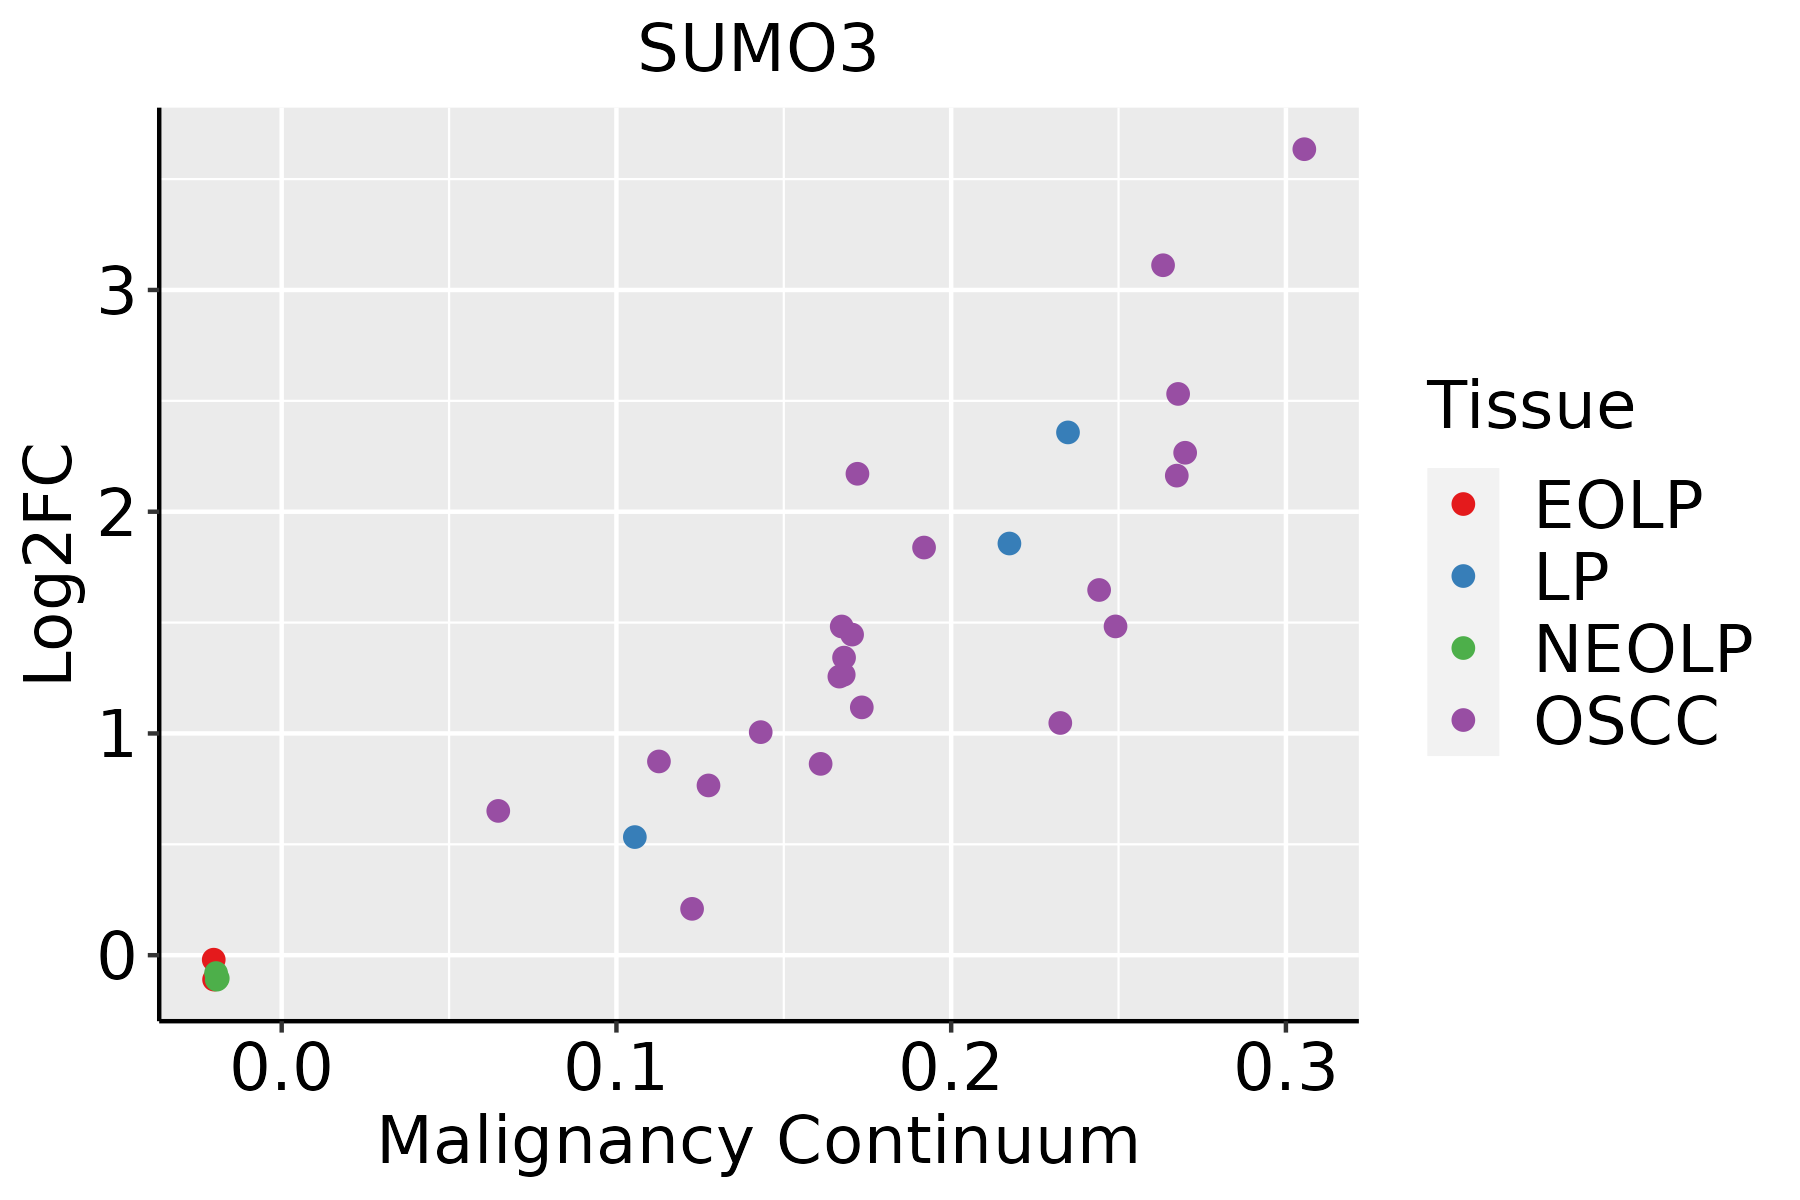 | EOLP: Erosive Oral lichen planus |
| LP: leukoplakia | ||
| NEOLP: Non-erosive oral lichen planus | ||
| OSCC: Oral squamous cell carcinoma | ||
| Skin | 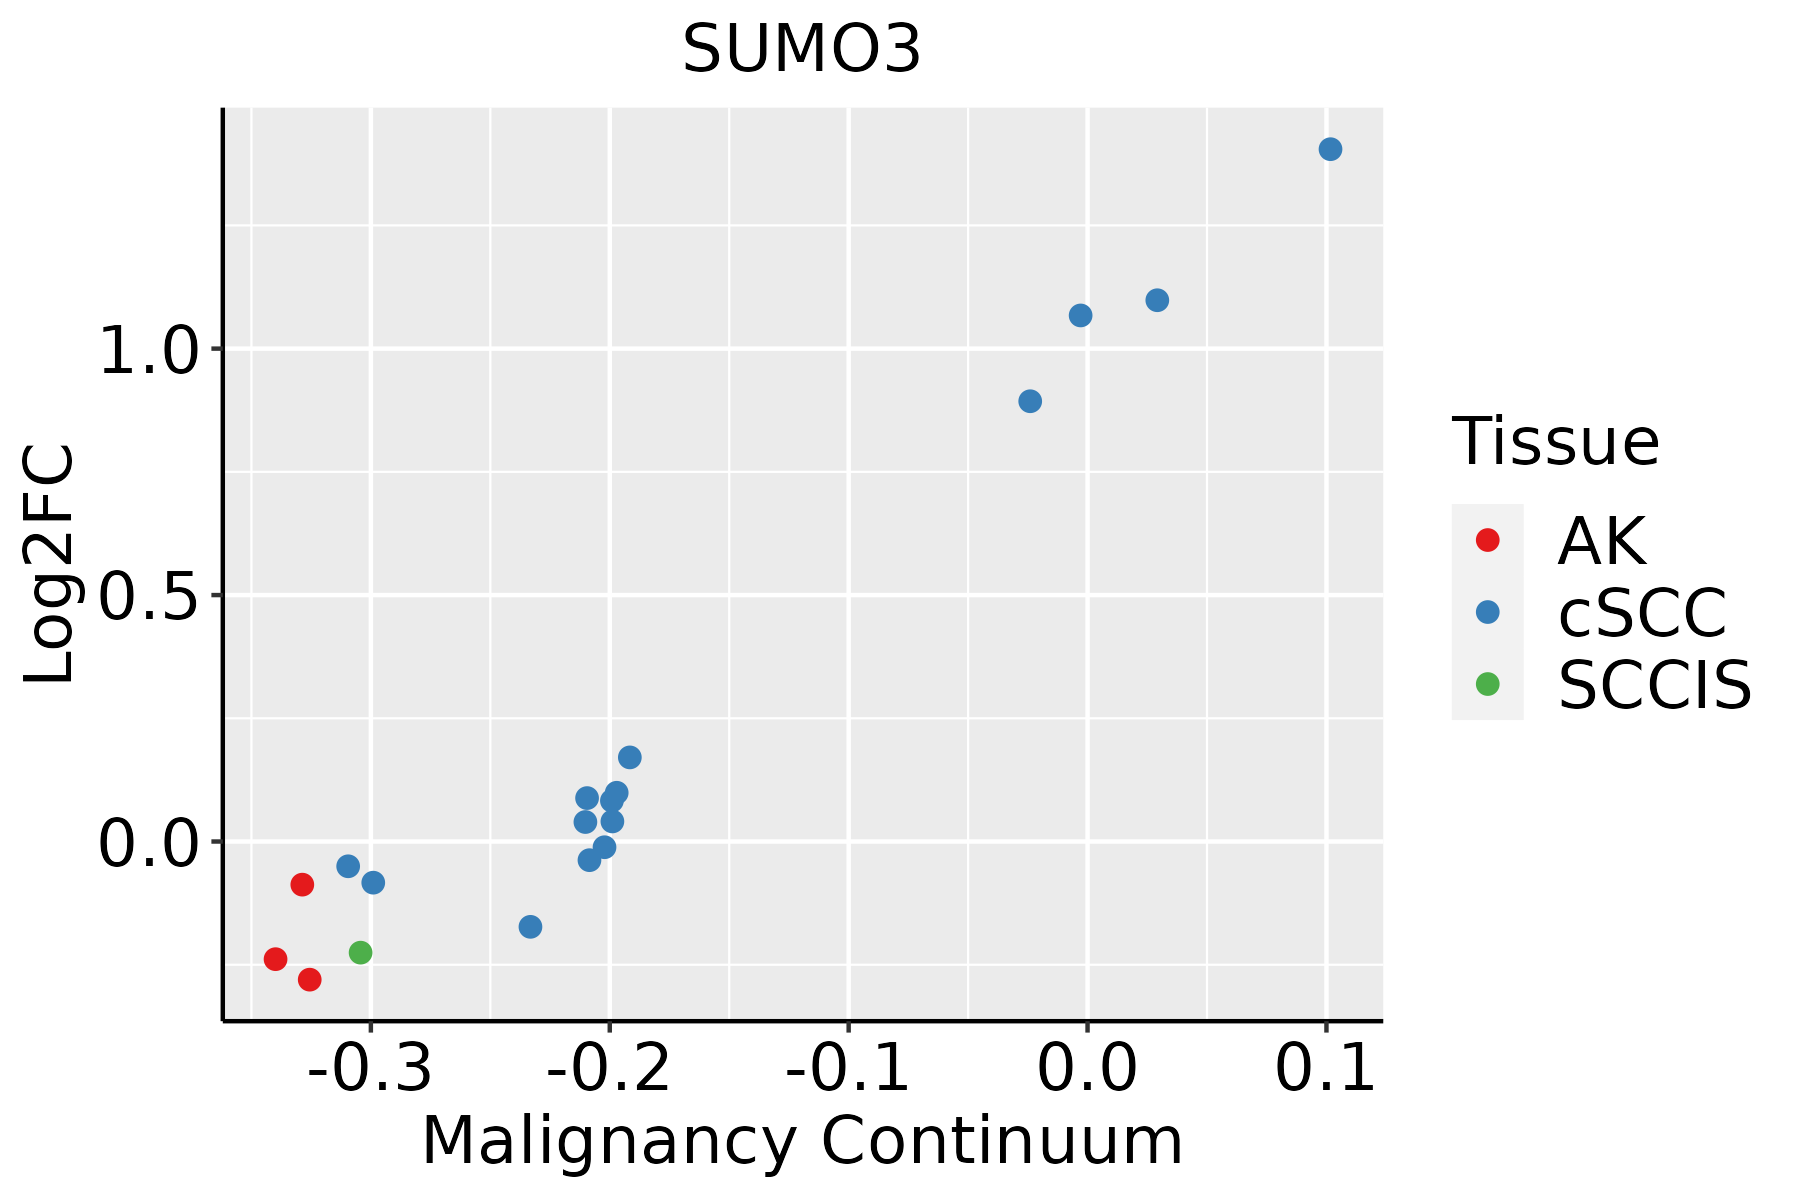 | AK: Actinic keratosis |
| cSCC: Cutaneous squamous cell carcinoma | ||
| SCCIS:squamous cell carcinoma in situ | ||
| Thyroid | 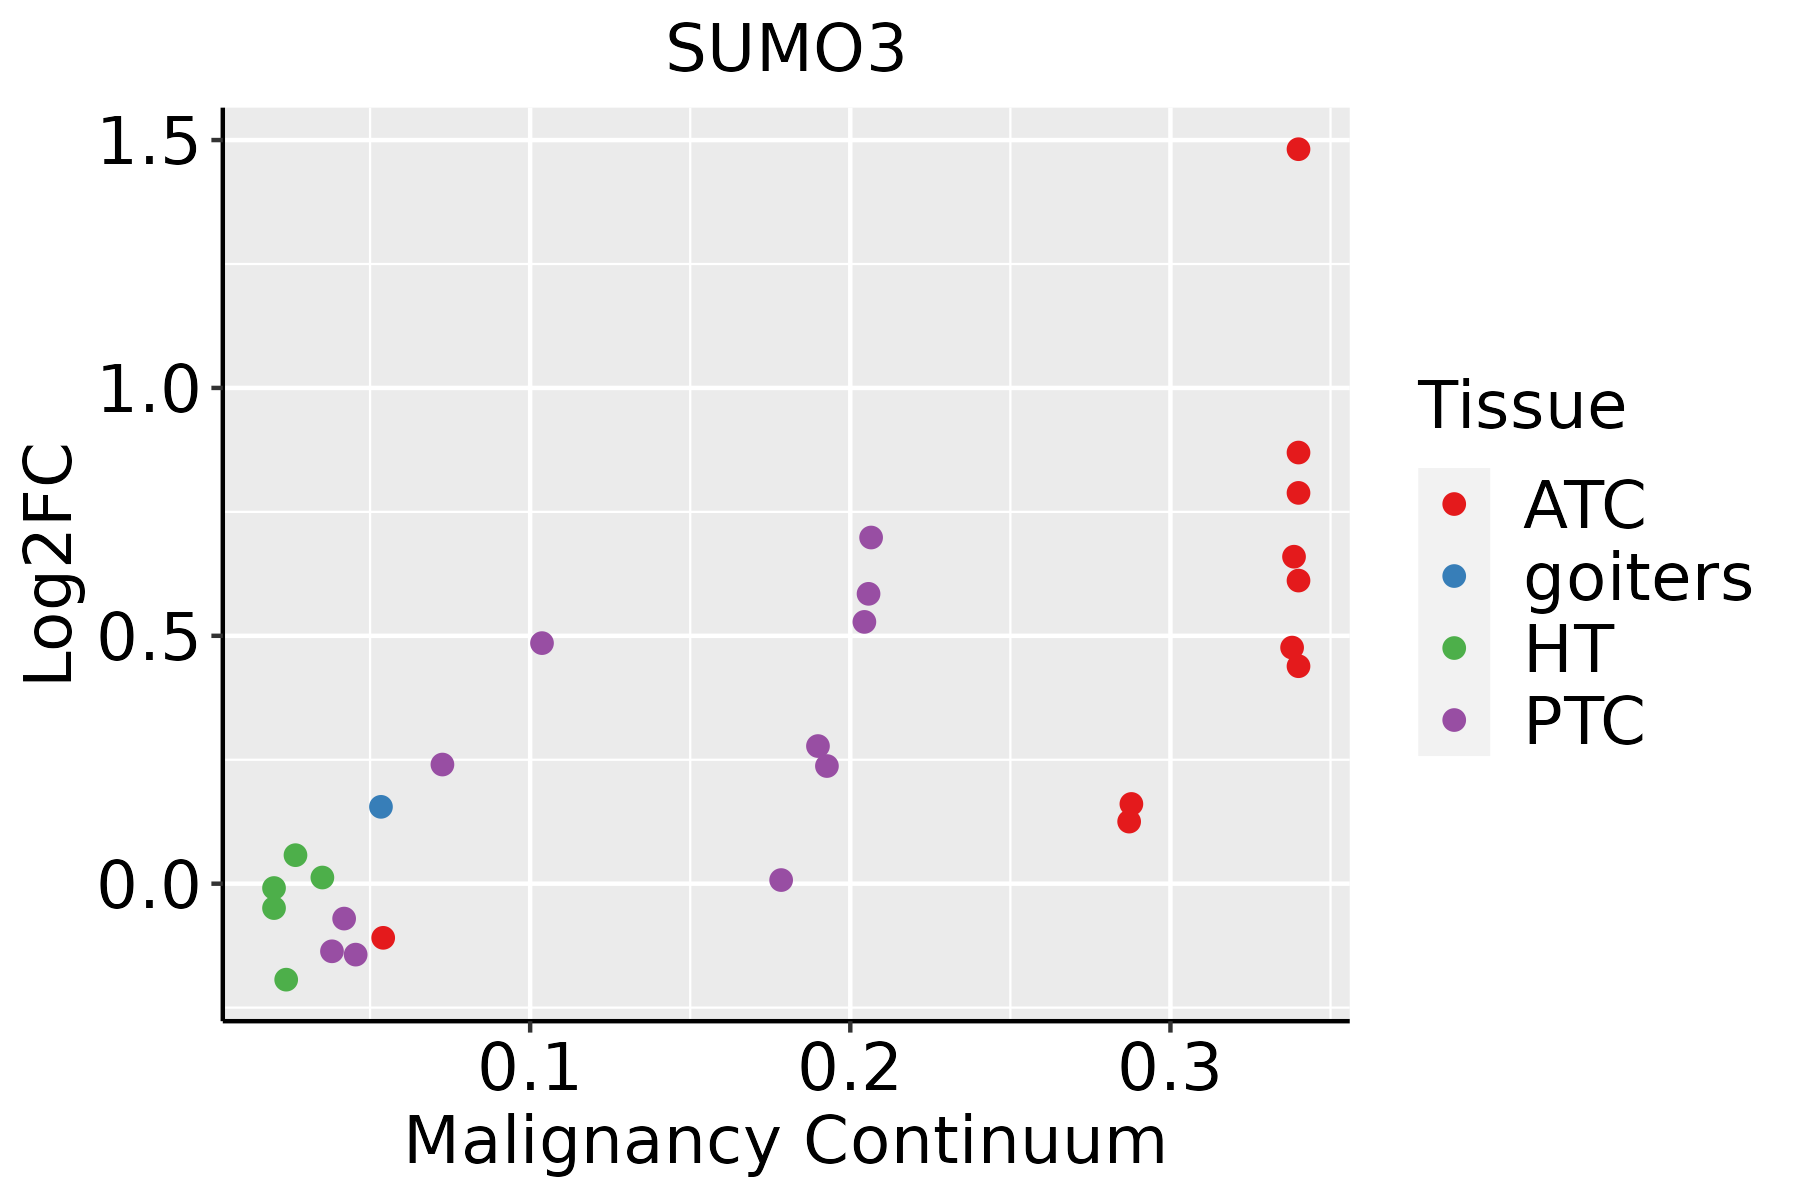 | ATC: Anaplastic thyroid cancer |
| HT: Hashimoto's thyroiditis | ||
| PTC: Papillary thyroid cancer |
| ∗log2FC in expression of this searched gene in stem-like cells from each diseased tissue sample relative to stem-like cells in normal samples in each tissue plotted against the malignancy continuum. Samples are colored based on if they are from different disease stage. |
Top |
Malignant transformation related pathway analysis |
| Find out the enriched GO biological processes and KEGG pathways involved in transition from healthy to precancer to cancer |
| Tissue | Disease Stage | Enriched GO biological Processes |
| Colorectum | CRC |  |
| Stomach | GC |  |
| Stomach | CAG with IM |  |
| Stomach | CSG |  |
| Stomach | CAG |  |
| ∗Top 15 enriched GO BP terms are showed in the bar plot of each disease state in each tissue. Each row represents a significant GO biological process which is colored according to the -log10(p.adjust). |
| Page: 1 2 3 4 5 6 7 8 9 |
| GO ID | Tissue | Disease Stage | Description | Gene Ratio | Bg Ratio | pvalue | p.adjust | Count |
| GO:005109814 | Breast | IDC | regulation of binding | 57/1434 | 363/18723 | 1.59e-07 | 8.76e-06 | 57 |
| GO:005110114 | Breast | IDC | regulation of DNA binding | 26/1434 | 118/18723 | 7.42e-07 | 3.40e-05 | 26 |
| GO:00433922 | Breast | IDC | negative regulation of DNA binding | 12/1434 | 52/18723 | 4.51e-04 | 6.07e-03 | 12 |
| GO:005110014 | Breast | IDC | negative regulation of binding | 25/1434 | 162/18723 | 5.98e-04 | 7.54e-03 | 25 |
| GO:005109823 | Breast | DCIS | regulation of binding | 55/1390 | 363/18723 | 3.14e-07 | 1.48e-05 | 55 |
| GO:005110123 | Breast | DCIS | regulation of DNA binding | 26/1390 | 118/18723 | 4.09e-07 | 1.87e-05 | 26 |
| GO:004339211 | Breast | DCIS | negative regulation of DNA binding | 12/1390 | 52/18723 | 3.40e-04 | 4.87e-03 | 12 |
| GO:005110022 | Breast | DCIS | negative regulation of binding | 25/1390 | 162/18723 | 3.77e-04 | 5.27e-03 | 25 |
| GO:0051098 | Colorectum | AD | regulation of binding | 126/3918 | 363/18723 | 6.01e-10 | 4.88e-08 | 126 |
| GO:1900180 | Colorectum | AD | regulation of protein localization to nucleus | 55/3918 | 136/18723 | 1.70e-07 | 7.34e-06 | 55 |
| GO:0034504 | Colorectum | AD | protein localization to nucleus | 94/3918 | 290/18723 | 2.83e-06 | 8.09e-05 | 94 |
| GO:0051101 | Colorectum | AD | regulation of DNA binding | 42/3918 | 118/18723 | 1.62e-04 | 2.23e-03 | 42 |
| GO:0051100 | Colorectum | AD | negative regulation of binding | 50/3918 | 162/18723 | 1.84e-03 | 1.51e-02 | 50 |
| GO:00510981 | Colorectum | SER | regulation of binding | 97/2897 | 363/18723 | 1.98e-08 | 1.43e-06 | 97 |
| GO:19001801 | Colorectum | SER | regulation of protein localization to nucleus | 46/2897 | 136/18723 | 8.50e-08 | 5.27e-06 | 46 |
| GO:00345041 | Colorectum | SER | protein localization to nucleus | 74/2897 | 290/18723 | 5.74e-06 | 2.05e-04 | 74 |
| GO:00511011 | Colorectum | SER | regulation of DNA binding | 33/2897 | 118/18723 | 3.70e-04 | 5.71e-03 | 33 |
| GO:00511001 | Colorectum | SER | negative regulation of binding | 40/2897 | 162/18723 | 1.46e-03 | 1.59e-02 | 40 |
| GO:00510982 | Colorectum | MSS | regulation of binding | 113/3467 | 363/18723 | 3.55e-09 | 2.41e-07 | 113 |
| GO:19001802 | Colorectum | MSS | regulation of protein localization to nucleus | 54/3467 | 136/18723 | 6.20e-09 | 3.95e-07 | 54 |
| Page: 1 2 3 4 5 |
| Pathway ID | Tissue | Disease Stage | Description | Gene Ratio | Bg Ratio | pvalue | p.adjust | qvalue | Count |
| hsa0541824 | Breast | IDC | Fluid shear stress and atherosclerosis | 34/867 | 139/8465 | 9.41e-07 | 1.61e-05 | 1.20e-05 | 34 |
| hsa0541834 | Breast | IDC | Fluid shear stress and atherosclerosis | 34/867 | 139/8465 | 9.41e-07 | 1.61e-05 | 1.20e-05 | 34 |
| hsa0541844 | Breast | DCIS | Fluid shear stress and atherosclerosis | 34/846 | 139/8465 | 5.31e-07 | 9.03e-06 | 6.65e-06 | 34 |
| hsa0541854 | Breast | DCIS | Fluid shear stress and atherosclerosis | 34/846 | 139/8465 | 5.31e-07 | 9.03e-06 | 6.65e-06 | 34 |
| hsa05418 | Colorectum | AD | Fluid shear stress and atherosclerosis | 54/2092 | 139/8465 | 1.41e-04 | 1.16e-03 | 7.37e-04 | 54 |
| hsa054181 | Colorectum | AD | Fluid shear stress and atherosclerosis | 54/2092 | 139/8465 | 1.41e-04 | 1.16e-03 | 7.37e-04 | 54 |
| hsa054182 | Colorectum | SER | Fluid shear stress and atherosclerosis | 40/1580 | 139/8465 | 2.28e-03 | 1.75e-02 | 1.27e-02 | 40 |
| hsa054183 | Colorectum | SER | Fluid shear stress and atherosclerosis | 40/1580 | 139/8465 | 2.28e-03 | 1.75e-02 | 1.27e-02 | 40 |
| hsa054184 | Colorectum | MSS | Fluid shear stress and atherosclerosis | 51/1875 | 139/8465 | 6.06e-05 | 5.80e-04 | 3.55e-04 | 51 |
| hsa054185 | Colorectum | MSS | Fluid shear stress and atherosclerosis | 51/1875 | 139/8465 | 6.06e-05 | 5.80e-04 | 3.55e-04 | 51 |
| hsa0541826 | Endometrium | AEH | Fluid shear stress and atherosclerosis | 43/1197 | 139/8465 | 2.47e-07 | 3.49e-06 | 2.55e-06 | 43 |
| hsa05418112 | Endometrium | AEH | Fluid shear stress and atherosclerosis | 43/1197 | 139/8465 | 2.47e-07 | 3.49e-06 | 2.55e-06 | 43 |
| hsa0541827 | Endometrium | EEC | Fluid shear stress and atherosclerosis | 45/1237 | 139/8465 | 7.76e-08 | 1.22e-06 | 9.07e-07 | 45 |
| hsa0541836 | Endometrium | EEC | Fluid shear stress and atherosclerosis | 45/1237 | 139/8465 | 7.76e-08 | 1.22e-06 | 9.07e-07 | 45 |
| hsa0301321 | Esophagus | ESCC | Nucleocytoplasmic transport | 89/4205 | 108/8465 | 1.20e-12 | 2.37e-11 | 1.21e-11 | 89 |
| hsa05418211 | Esophagus | ESCC | Fluid shear stress and atherosclerosis | 109/4205 | 139/8465 | 2.00e-12 | 3.72e-11 | 1.90e-11 | 109 |
| hsa0301331 | Esophagus | ESCC | Nucleocytoplasmic transport | 89/4205 | 108/8465 | 1.20e-12 | 2.37e-11 | 1.21e-11 | 89 |
| hsa05418310 | Esophagus | ESCC | Fluid shear stress and atherosclerosis | 109/4205 | 139/8465 | 2.00e-12 | 3.72e-11 | 1.90e-11 | 109 |
| hsa0541822 | Liver | Cirrhotic | Fluid shear stress and atherosclerosis | 62/2530 | 139/8465 | 1.53e-04 | 1.06e-03 | 6.54e-04 | 62 |
| hsa0541832 | Liver | Cirrhotic | Fluid shear stress and atherosclerosis | 62/2530 | 139/8465 | 1.53e-04 | 1.06e-03 | 6.54e-04 | 62 |
| Page: 1 2 |
Top |
Cell-cell communication analysis |
| Identification of potential cell-cell interactions between two cell types and their ligand-receptor pairs for different disease states |
| Ligand | Receptor | LRpair | Pathway | Tissue | Disease Stage |
| Page: 1 |
Top |
Single-cell gene regulatory network inference analysis |
| Find out the significant the regulons (TFs) and the target genes of each regulon across cell types for different disease states |
| TF | Cell Type | Tissue | Disease Stage | Target Gene | RSS | Regulon Activity |
| ∗The dot plots of a searched regulon are shown for all cell subpopulations in each disease state of each tissue based on the regulon specific score inferred using pySCENIC and by calculating the average expression. |
| Page: 1 |
Top |
Somatic mutation of malignant transformation related genes |
| Annotation of somatic variants for genes involved in malignant transformation |
| Hugo Symbol | Variant Class | Variant Classification | dbSNP RS | HGVSc | HGVSp | HGVSp Short | SWISSPROT | BIOTYPE | SIFT | PolyPhen | Tumor Sample Barcode | Tissue | Histology | Sex | Age | Stage | Therapy Types | Drugs | Outcome |
| SUMO3 | SNV | Missense_Mutation | novel | c.301N>A | p.Gly101Arg | p.G101R | P55854 | protein_coding | deleterious(0.04) | benign(0.36) | TCGA-2W-A8YY-01 | Cervix | cervical & endocervical cancer | Female | <65 | I/II | Chemotherapy | cisplatin | CR |
| SUMO3 | SNV | Missense_Mutation | novel | c.385N>A | p.Gly129Arg | p.G129R | P55854 | protein_coding | deleterious(0.04) | possibly_damaging(0.728) | TCGA-A5-A0G2-01 | Endometrium | uterine corpus endometrioid carcinoma | Female | <65 | III/IV | Unknown | Unknown | SD |
| SUMO3 | SNV | Missense_Mutation | novel | c.44N>T | p.Asp15Val | p.D15V | P55854 | protein_coding | deleterious(0) | probably_damaging(0.999) | TCGA-DI-A1BU-01 | Endometrium | uterine corpus endometrioid carcinoma | Female | <65 | I/II | Chemotherapy | paclitaxel | SD |
| SUMO3 | SNV | Missense_Mutation | c.276N>A | p.Met92Ile | p.M92I | P55854 | protein_coding | tolerated(0.3) | benign(0.034) | TCGA-69-8254-01 | Lung | lung adenocarcinoma | Male | >=65 | I/II | Unknown | Unknown | SD | |
| SUMO3 | SNV | Missense_Mutation | rs767384489 | c.262G>A | p.Glu88Lys | p.E88K | P55854 | protein_coding | tolerated(0.59) | benign(0.017) | TCGA-KK-A59V-01 | Prostate | prostate adenocarcinoma | Male | <65 | 9 | Unknown | Unknown | SD |
| SUMO3 | SNV | Missense_Mutation | c.110C>T | p.Thr37Met | p.T37M | P55854 | protein_coding | deleterious(0.03) | probably_damaging(0.991) | TCGA-F1-6177-01 | Stomach | stomach adenocarcinoma | Male | >=65 | I/II | Unknown | Unknown | SD | |
| SUMO3 | SNV | Missense_Mutation | c.407T>C | p.Leu136Pro | p.L136P | P55854 | protein_coding | deleterious_low_confidence(0.01) | benign(0.001) | TCGA-HU-A4G9-01 | Stomach | stomach adenocarcinoma | Female | >=65 | I/II | Unknown | Unknown | SD |
| Page: 1 |
Top |
Related drugs of malignant transformation related genes |
| Identification of chemicals and drugs interact with genes involved in malignant transfromation |
| (DGIdb 4.0) |
| Entrez ID | Symbol | Category | Interaction Types | Drug Claim Name | Drug Name | PMIDs |
| Page: 1 |

Copyright 2023-Present -The University of Texas Health Science Center at Houston |