
|
|||||
|
 | |
| |
| |
| |
| |
| |
|
Gene: RPSAP58 |
Gene summary for RPSAP58 |
| Gene information | Species | Human | Gene symbol | RPSAP58 | Gene ID | 388524 |
| Gene name | ribosomal protein SA pseudogene 58 | |
| Gene Alias | RPSA_30_1642 | |
| Cytomap | 19p12 | |
| Gene Type | protein-coding | GO ID | NA | UniProtAcc | NA |
Top |
Malignant transformation analysis |
| Identification of the aberrant gene expression in precancerous and cancerous lesions by comparing the gene expression of stem-like cells in diseased tissues with normal stem cells |
| Entrez ID | Symbol | Replicates | Species | Organ | Tissue | Adj P-value | Log2FC | Malignancy |
| 388524 | RPSAP58 | HCC1 | Human | Liver | HCC | 5.27e-21 | 1.55e+00 | 0.5336 |
| 388524 | RPSAP58 | HCC2 | Human | Liver | HCC | 8.12e-38 | 2.53e+00 | 0.5341 |
| 388524 | RPSAP58 | Pt13.b | Human | Liver | HCC | 7.49e-33 | 2.45e-01 | 0.0251 |
| 388524 | RPSAP58 | Pt14.a | Human | Liver | HCC | 4.95e-31 | 7.21e-01 | 0.0169 |
| 388524 | RPSAP58 | Pt14.b | Human | Liver | HCC | 8.19e-04 | 1.10e-01 | 0.018 |
| 388524 | RPSAP58 | Pt14.d | Human | Liver | HCC | 1.20e-17 | 2.90e-01 | 0.0143 |
| 388524 | RPSAP58 | P1_S1_AK | Human | Skin | AK | 3.45e-19 | -4.64e-01 | -0.3399 |
| 388524 | RPSAP58 | P2_S3_AK | Human | Skin | AK | 6.46e-20 | -4.64e-01 | -0.3287 |
| 388524 | RPSAP58 | P2_S4_SCCIS | Human | Skin | SCCIS | 3.45e-19 | -4.64e-01 | -0.3043 |
| 388524 | RPSAP58 | P3_S6_AK | Human | Skin | AK | 2.79e-20 | -4.64e-01 | -0.3256 |
| 388524 | RPSAP58 | P4_S8_cSCC | Human | Skin | cSCC | 7.24e-12 | -4.64e-01 | -0.3095 |
| 388524 | RPSAP58 | P5_S10_cSCC | Human | Skin | cSCC | 2.79e-20 | -4.64e-01 | -0.299 |
| 388524 | RPSAP58 | P1_cSCC | Human | Skin | cSCC | 1.19e-54 | 2.53e+00 | 0.0292 |
| 388524 | RPSAP58 | P2_cSCC | Human | Skin | cSCC | 1.43e-78 | 2.08e+00 | -0.024 |
| 388524 | RPSAP58 | P4_cSCC | Human | Skin | cSCC | 4.40e-27 | 1.03e+00 | -0.00290000000000005 |
| 388524 | RPSAP58 | P10_cSCC | Human | Skin | cSCC | 1.57e-37 | 1.48e+00 | 0.1017 |
| 388524 | RPSAP58 | cSCC_p1 | Human | Skin | cSCC | 6.46e-20 | -4.64e-01 | -0.1916 |
| 388524 | RPSAP58 | cSCC_p10 | Human | Skin | cSCC | 2.79e-20 | -4.64e-01 | -0.2095 |
| 388524 | RPSAP58 | cSCC_p11 | Human | Skin | cSCC | 2.79e-20 | -4.64e-01 | -0.2102 |
| 388524 | RPSAP58 | cSCC_p3 | Human | Skin | cSCC | 2.79e-20 | -4.64e-01 | -0.2085 |
| Page: 1 2 3 |
| Tissue | Expression Dynamics | Abbreviation |
| GC | 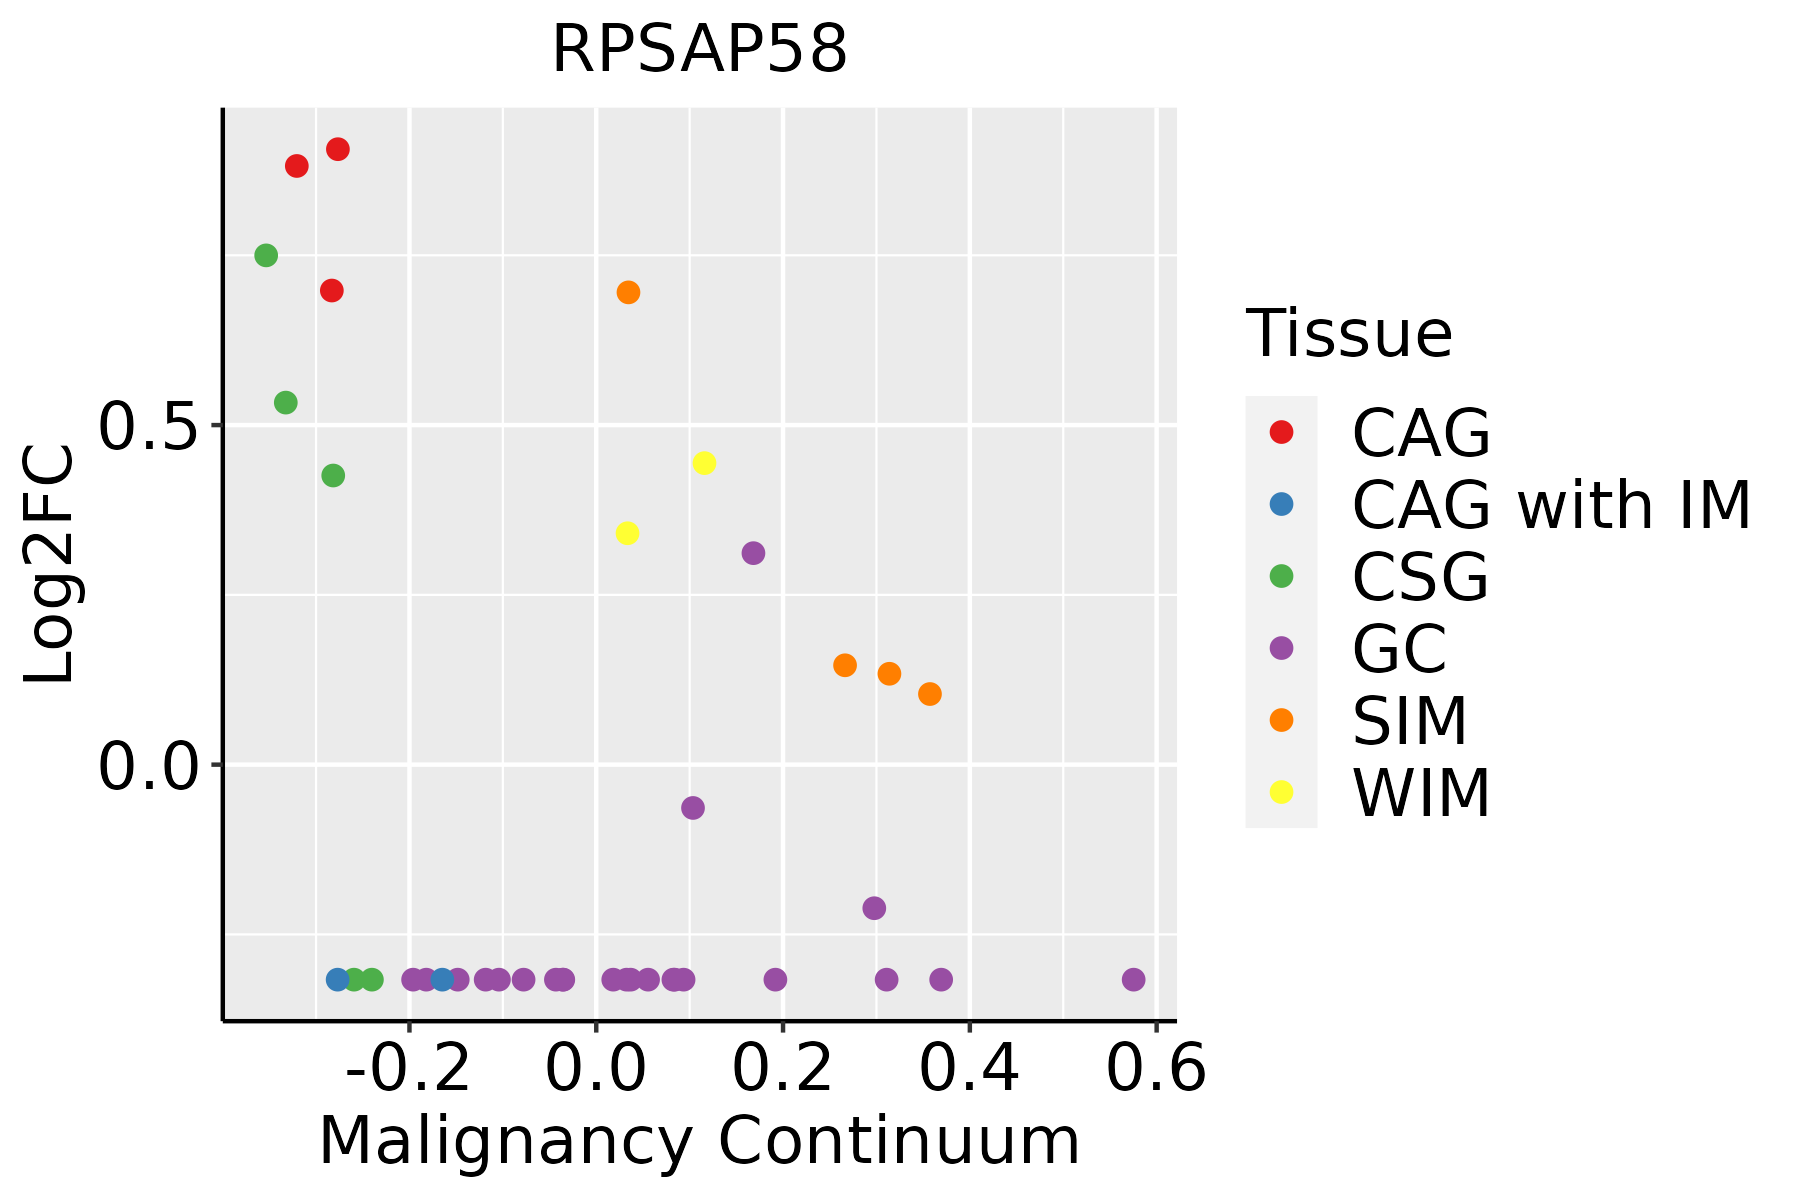 | CAG: Chronic atrophic gastritis |
| CAG with IM: Chronic atrophic gastritis with intestinal metaplasia | ||
| CSG: Chronic superficial gastritis | ||
| GC: Gastric cancer | ||
| SIM: Severe intestinal metaplasia | ||
| WIM: Wild intestinal metaplasia | ||
| Liver | 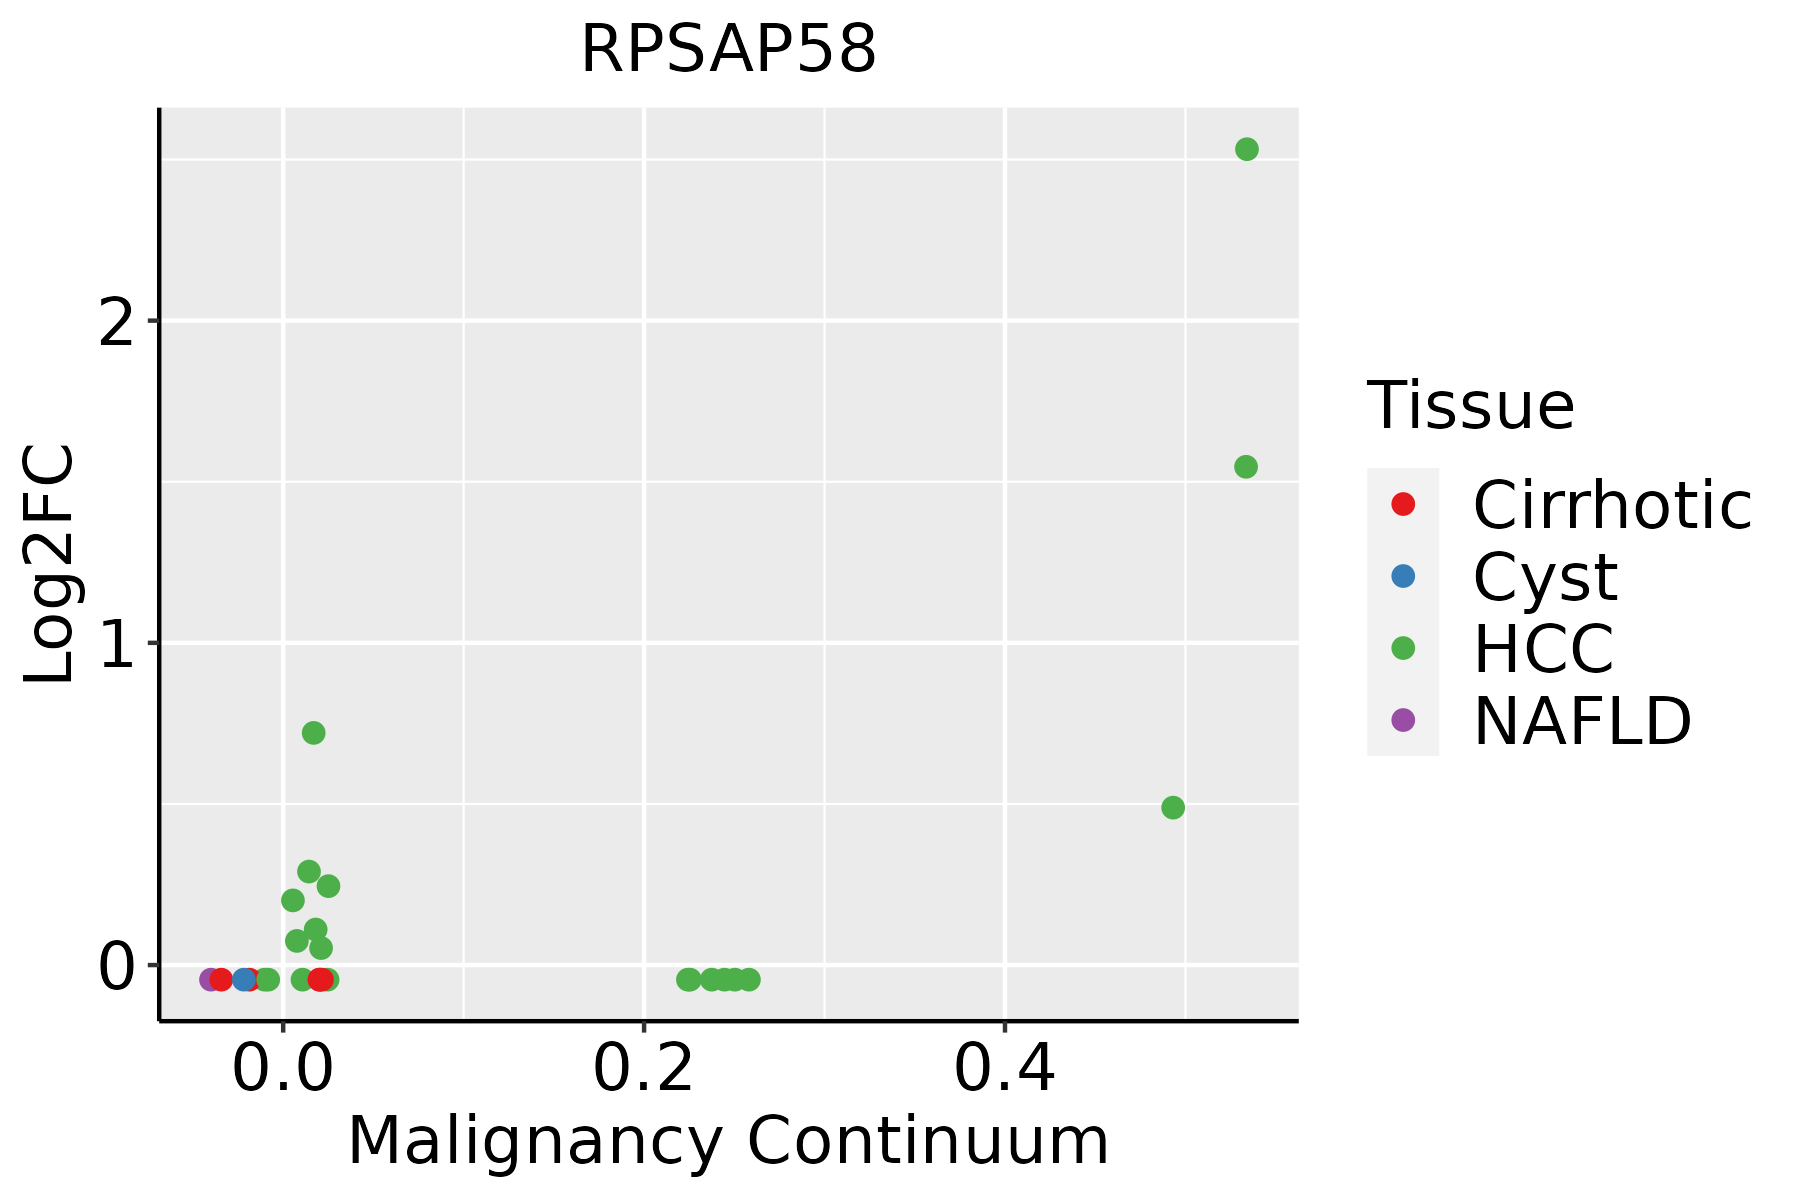 | HCC: Hepatocellular carcinoma |
| NAFLD: Non-alcoholic fatty liver disease | ||
| Skin | 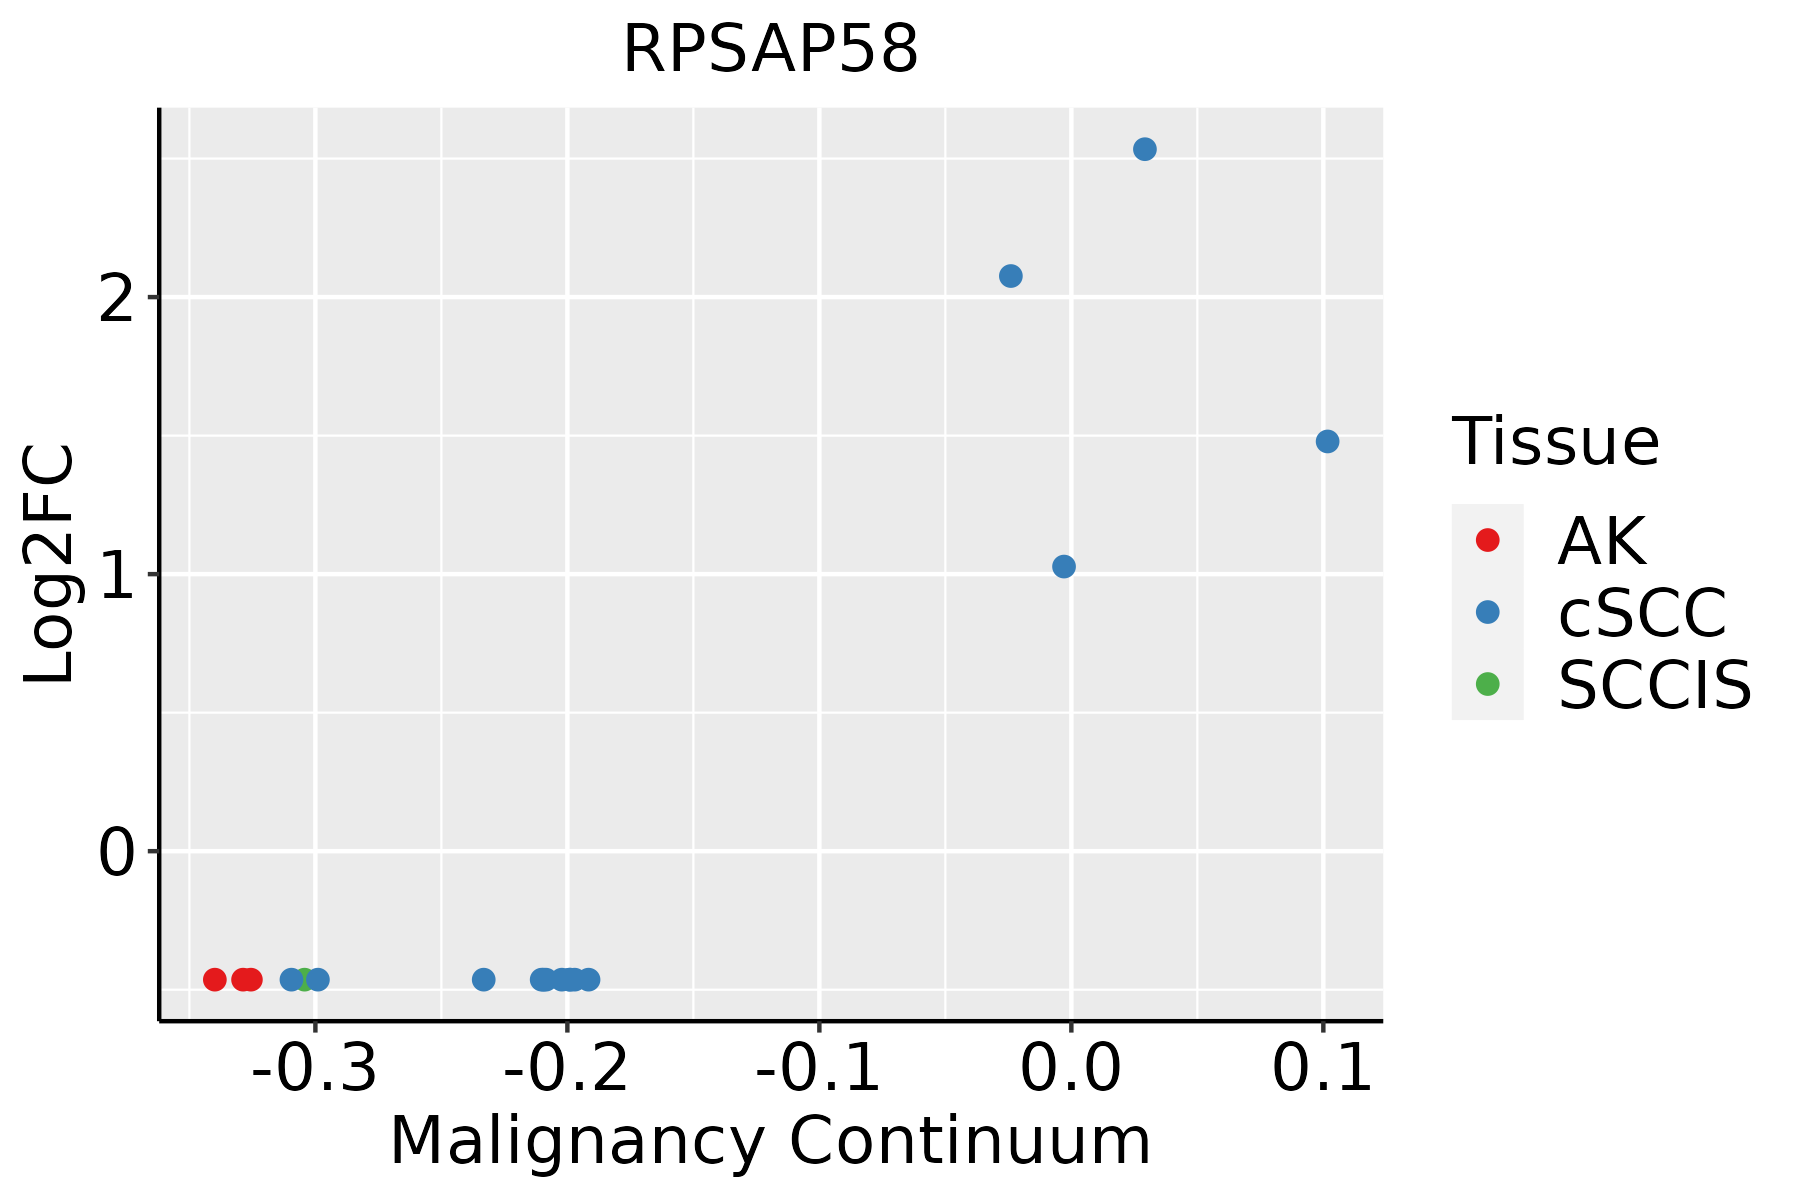 | AK: Actinic keratosis |
| cSCC: Cutaneous squamous cell carcinoma | ||
| SCCIS:squamous cell carcinoma in situ |
| ∗log2FC in expression of this searched gene in stem-like cells from each diseased tissue sample relative to stem-like cells in normal samples in each tissue plotted against the malignancy continuum. Samples are colored based on if they are from different disease stage. |
Top |
Malignant transformation related pathway analysis |
| Find out the enriched GO biological processes and KEGG pathways involved in transition from healthy to precancer to cancer |
| Tissue | Disease Stage | Enriched GO biological Processes |
| Colorectum | CRC |  |
| Stomach | GC |  |
| Stomach | CAG with IM |  |
| Stomach | CSG |  |
| Stomach | CAG |  |
| ∗Top 15 enriched GO BP terms are showed in the bar plot of each disease state in each tissue. Each row represents a significant GO biological process which is colored according to the -log10(p.adjust). |
| Page: 1 2 3 4 5 6 7 8 9 |
| GO ID | Tissue | Disease Stage | Description | Gene Ratio | Bg Ratio | pvalue | p.adjust | Count |
| Page: 1 |
| Pathway ID | Tissue | Disease Stage | Description | Gene Ratio | Bg Ratio | pvalue | p.adjust | qvalue | Count |
| Page: 1 |
Top |
Cell-cell communication analysis |
| Identification of potential cell-cell interactions between two cell types and their ligand-receptor pairs for different disease states |
| Ligand | Receptor | LRpair | Pathway | Tissue | Disease Stage |
| Page: 1 |
Top |
Single-cell gene regulatory network inference analysis |
| Find out the significant the regulons (TFs) and the target genes of each regulon across cell types for different disease states |
| TF | Cell Type | Tissue | Disease Stage | Target Gene | RSS | Regulon Activity |
| ∗The dot plots of a searched regulon are shown for all cell subpopulations in each disease state of each tissue based on the regulon specific score inferred using pySCENIC and by calculating the average expression. |
| Page: 1 |
Top |
Somatic mutation of malignant transformation related genes |
| Annotation of somatic variants for genes involved in malignant transformation |
| Hugo Symbol | Variant Class | Variant Classification | dbSNP RS | HGVSc | HGVSp | HGVSp Short | SWISSPROT | BIOTYPE | SIFT | PolyPhen | Tumor Sample Barcode | Tissue | Histology | Sex | Age | Stage | Therapy Types | Drugs | Outcome |
| Page: 1 |
Top |
Related drugs of malignant transformation related genes |
| Identification of chemicals and drugs interact with genes involved in malignant transfromation |
| (DGIdb 4.0) |
| Entrez ID | Symbol | Category | Interaction Types | Drug Claim Name | Drug Name | PMIDs |
| Page: 1 |

Copyright 2023-Present -The University of Texas Health Science Center at Houston |