
|
|||||
|
 | |
| |
| |
| |
| |
| |
|
Gene: PLAAT4 |
Gene summary for PLAAT4 |
| Gene information | Species | Human | Gene symbol | PLAAT4 | Gene ID | 5920 |
| Gene name | phospholipase A and acyltransferase 4 | |
| Gene Alias | HRASLS4 | |
| Cytomap | 11q12.3 | |
| Gene Type | protein-coding | GO ID | GO:0006629 | UniProtAcc | Q9UL19 |
Top |
Malignant transformation analysis |
| Identification of the aberrant gene expression in precancerous and cancerous lesions by comparing the gene expression of stem-like cells in diseased tissues with normal stem cells |
| Entrez ID | Symbol | Replicates | Species | Organ | Tissue | Adj P-value | Log2FC | Malignancy |
| 5920 | PLAAT4 | HTA11_2487_2000001011 | Human | Colorectum | SER | 1.14e-02 | 1.53e-01 | -0.1808 |
| 5920 | PLAAT4 | HTA11_411_2000001011 | Human | Colorectum | SER | 1.20e-07 | 9.77e-01 | -0.2602 |
| 5920 | PLAAT4 | HTA11_2112_2000001011 | Human | Colorectum | SER | 1.29e-05 | 1.14e+00 | -0.2196 |
| 5920 | PLAAT4 | HTA11_866_2000001011 | Human | Colorectum | AD | 1.71e-02 | 1.35e-01 | -0.1001 |
| 5920 | PLAAT4 | HTA11_1391_2000001011 | Human | Colorectum | AD | 3.65e-10 | 2.74e-01 | -0.059 |
| 5920 | PLAAT4 | HTA11_2992_2000001011 | Human | Colorectum | SER | 1.09e-02 | 2.39e-01 | -0.1706 |
| 5920 | PLAAT4 | HTA11_5212_2000001011 | Human | Colorectum | AD | 5.12e-05 | 5.32e-01 | -0.2061 |
| 5920 | PLAAT4 | HTA11_866_3004761011 | Human | Colorectum | AD | 1.51e-05 | 1.54e-01 | 0.096 |
| 5920 | PLAAT4 | AEH-subject1 | Human | Endometrium | AEH | 7.69e-12 | 3.11e-01 | -0.3059 |
| 5920 | PLAAT4 | AEH-subject2 | Human | Endometrium | AEH | 9.76e-17 | 4.34e-01 | -0.2525 |
| 5920 | PLAAT4 | AEH-subject3 | Human | Endometrium | AEH | 1.17e-28 | 5.87e-01 | -0.2576 |
| 5920 | PLAAT4 | AEH-subject4 | Human | Endometrium | AEH | 3.63e-17 | 4.68e-01 | -0.2657 |
| 5920 | PLAAT4 | AEH-subject5 | Human | Endometrium | AEH | 8.15e-11 | 2.36e-01 | -0.2953 |
| 5920 | PLAAT4 | EEC-subject1 | Human | Endometrium | EEC | 3.87e-05 | 2.09e-01 | -0.2682 |
| 5920 | PLAAT4 | EEC-subject2 | Human | Endometrium | EEC | 1.73e-27 | 5.75e-01 | -0.2607 |
| 5920 | PLAAT4 | EEC-subject4 | Human | Endometrium | EEC | 7.80e-30 | 6.19e-01 | -0.2571 |
| 5920 | PLAAT4 | EEC-subject5 | Human | Endometrium | EEC | 2.44e-20 | 4.77e-01 | -0.249 |
| 5920 | PLAAT4 | LZE2D | Human | Esophagus | HGIN | 1.57e-04 | 7.22e-01 | 0.0642 |
| 5920 | PLAAT4 | LZE3D | Human | Esophagus | HGIN | 6.21e-05 | 5.85e-01 | 0.0668 |
| 5920 | PLAAT4 | LZE4T | Human | Esophagus | ESCC | 9.66e-09 | 4.66e-01 | 0.0811 |
| Page: 1 2 3 4 5 |
| Tissue | Expression Dynamics | Abbreviation |
| Colorectum (GSE201348) |  | FAP: Familial adenomatous polyposis |
| CRC: Colorectal cancer | ||
| Colorectum (HTA11) |  | AD: Adenomas |
| SER: Sessile serrated lesions | ||
| MSI-H: Microsatellite-high colorectal cancer | ||
| MSS: Microsatellite stable colorectal cancer | ||
| Endometrium |  | AEH: Atypical endometrial hyperplasia |
| EEC: Endometrioid Cancer | ||
| Esophagus |  | ESCC: Esophageal squamous cell carcinoma |
| HGIN: High-grade intraepithelial neoplasias | ||
| LGIN: Low-grade intraepithelial neoplasias | ||
| GC |  | CAG: Chronic atrophic gastritis |
| CAG with IM: Chronic atrophic gastritis with intestinal metaplasia | ||
| CSG: Chronic superficial gastritis | ||
| GC: Gastric cancer | ||
| SIM: Severe intestinal metaplasia | ||
| WIM: Wild intestinal metaplasia | ||
| Lung | 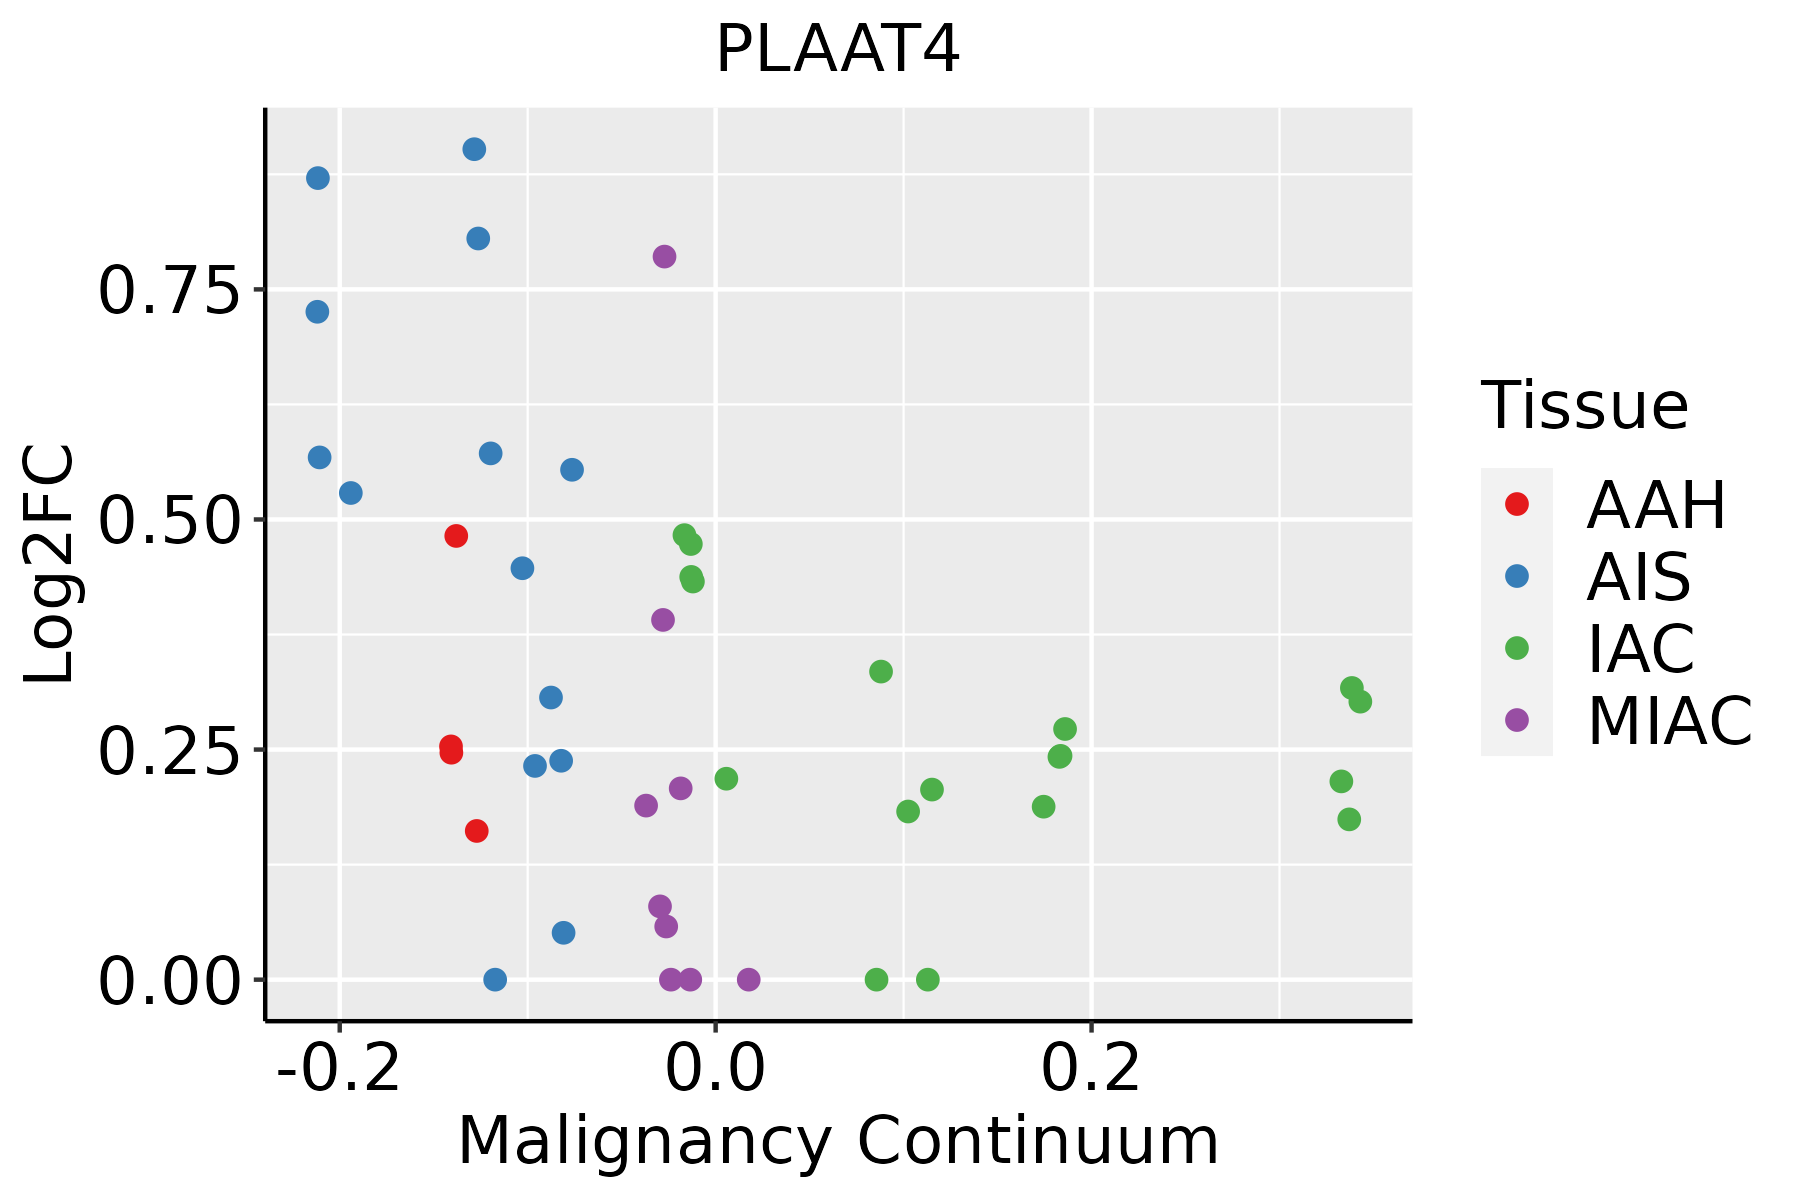 | AAH: Atypical adenomatous hyperplasia |
| AIS: Adenocarcinoma in situ | ||
| IAC: Invasive lung adenocarcinoma | ||
| MIA: Minimally invasive adenocarcinoma | ||
| Prostate |  | BPH: Benign Prostatic Hyperplasia |
| ∗log2FC in expression of this searched gene in stem-like cells from each diseased tissue sample relative to stem-like cells in normal samples in each tissue plotted against the malignancy continuum. Samples are colored based on if they are from different disease stage. |
Top |
Malignant transformation related pathway analysis |
| Find out the enriched GO biological processes and KEGG pathways involved in transition from healthy to precancer to cancer |
| Tissue | Disease Stage | Enriched GO biological Processes |
| Colorectum | CRC |  |
| Stomach | GC |  |
| Stomach | CAG with IM |  |
| Stomach | CSG |  |
| Stomach | CAG |  |
| ∗Top 15 enriched GO BP terms are showed in the bar plot of each disease state in each tissue. Each row represents a significant GO biological process which is colored according to the -log10(p.adjust). |
| Page: 1 2 3 4 5 6 7 8 9 |
| GO ID | Tissue | Disease Stage | Description | Gene Ratio | Bg Ratio | pvalue | p.adjust | Count |
| GO:0016042 | Colorectum | AD | lipid catabolic process | 97/3918 | 320/18723 | 4.31e-05 | 7.56e-04 | 97 |
| GO:0009913 | Colorectum | AD | epidermal cell differentiation | 58/3918 | 202/18723 | 5.16e-03 | 3.42e-02 | 58 |
| GO:0006650 | Colorectum | AD | glycerophospholipid metabolic process | 83/3918 | 306/18723 | 5.40e-03 | 3.55e-02 | 83 |
| GO:0006644 | Colorectum | AD | phospholipid metabolic process | 101/3918 | 383/18723 | 5.80e-03 | 3.67e-02 | 101 |
| GO:0008544 | Colorectum | AD | epidermis development | 87/3918 | 324/18723 | 5.99e-03 | 3.76e-02 | 87 |
| GO:00160421 | Colorectum | SER | lipid catabolic process | 77/2897 | 320/18723 | 3.52e-05 | 9.18e-04 | 77 |
| GO:0046486 | Colorectum | SER | glycerolipid metabolic process | 82/2897 | 392/18723 | 2.26e-03 | 2.17e-02 | 82 |
| GO:00066441 | Colorectum | SER | phospholipid metabolic process | 79/2897 | 383/18723 | 3.94e-03 | 3.24e-02 | 79 |
| GO:00066501 | Colorectum | SER | glycerophospholipid metabolic process | 64/2897 | 306/18723 | 6.41e-03 | 4.60e-02 | 64 |
| GO:00308564 | Endometrium | AEH | regulation of epithelial cell differentiation | 33/2100 | 154/18723 | 1.81e-04 | 2.32e-03 | 33 |
| GO:00456823 | Endometrium | AEH | regulation of epidermis development | 16/2100 | 65/18723 | 1.81e-03 | 1.44e-02 | 16 |
| GO:00435885 | Endometrium | AEH | skin development | 45/2100 | 263/18723 | 2.58e-03 | 1.90e-02 | 45 |
| GO:00456043 | Endometrium | AEH | regulation of epidermal cell differentiation | 14/2100 | 58/18723 | 4.12e-03 | 2.73e-02 | 14 |
| GO:00085447 | Endometrium | AEH | epidermis development | 52/2100 | 324/18723 | 5.00e-03 | 3.14e-02 | 52 |
| GO:00456164 | Endometrium | AEH | regulation of keratinocyte differentiation | 10/2100 | 37/18723 | 6.23e-03 | 3.70e-02 | 10 |
| GO:003085613 | Endometrium | EEC | regulation of epithelial cell differentiation | 34/2168 | 154/18723 | 1.47e-04 | 1.87e-03 | 34 |
| GO:004568212 | Endometrium | EEC | regulation of epidermis development | 16/2168 | 65/18723 | 2.51e-03 | 1.83e-02 | 16 |
| GO:004358814 | Endometrium | EEC | skin development | 45/2168 | 263/18723 | 4.69e-03 | 2.99e-02 | 45 |
| GO:004560412 | Endometrium | EEC | regulation of epidermal cell differentiation | 14/2168 | 58/18723 | 5.49e-03 | 3.33e-02 | 14 |
| GO:000854414 | Endometrium | EEC | epidermis development | 53/2168 | 324/18723 | 5.92e-03 | 3.54e-02 | 53 |
| Page: 1 2 3 4 |
| Pathway ID | Tissue | Disease Stage | Description | Gene Ratio | Bg Ratio | pvalue | p.adjust | qvalue | Count |
| Page: 1 |
Top |
Cell-cell communication analysis |
| Identification of potential cell-cell interactions between two cell types and their ligand-receptor pairs for different disease states |
| Ligand | Receptor | LRpair | Pathway | Tissue | Disease Stage |
| Page: 1 |
Top |
Single-cell gene regulatory network inference analysis |
| Find out the significant the regulons (TFs) and the target genes of each regulon across cell types for different disease states |
| TF | Cell Type | Tissue | Disease Stage | Target Gene | RSS | Regulon Activity |
| ∗The dot plots of a searched regulon are shown for all cell subpopulations in each disease state of each tissue based on the regulon specific score inferred using pySCENIC and by calculating the average expression. |
| Page: 1 |
Top |
Somatic mutation of malignant transformation related genes |
| Annotation of somatic variants for genes involved in malignant transformation |
| Hugo Symbol | Variant Class | Variant Classification | dbSNP RS | HGVSc | HGVSp | HGVSp Short | SWISSPROT | BIOTYPE | SIFT | PolyPhen | Tumor Sample Barcode | Tissue | Histology | Sex | Age | Stage | Therapy Types | Drugs | Outcome |
| Page: 1 |
Top |
Related drugs of malignant transformation related genes |
| Identification of chemicals and drugs interact with genes involved in malignant transfromation |
| (DGIdb 4.0) |
| Entrez ID | Symbol | Category | Interaction Types | Drug Claim Name | Drug Name | PMIDs |
| Page: 1 |

Copyright 2023-Present -The University of Texas Health Science Center at Houston |