
|
|||||
|
 | |
| |
| |
| |
| |
| |
|
Gene: NEAT1 |
Gene summary for NEAT1 |
| Gene information | Species | Human | Gene symbol | NEAT1 | Gene ID | 283131 |
| Gene name | nuclear paraspeckle assembly transcript 1 | |
| Gene Alias | LINC00084 | |
| Cytomap | 11q13.1 | |
| Gene Type | ncRNA | GO ID | GO:0002941 | UniProtAcc | NA |
Top |
Malignant transformation analysis |
| Identification of the aberrant gene expression in precancerous and cancerous lesions by comparing the gene expression of stem-like cells in diseased tissues with normal stem cells |
| Entrez ID | Symbol | Replicates | Species | Organ | Tissue | Adj P-value | Log2FC | Malignancy |
| 283131 | NEAT1 | GSM4909281 | Human | Breast | IDC | 3.49e-09 | 2.94e-01 | 0.21 |
| 283131 | NEAT1 | GSM4909286 | Human | Breast | IDC | 7.60e-20 | -3.25e-01 | 0.1081 |
| 283131 | NEAT1 | GSM4909287 | Human | Breast | IDC | 5.15e-24 | 2.03e-01 | 0.2057 |
| 283131 | NEAT1 | GSM4909288 | Human | Breast | IDC | 1.06e-08 | -6.83e-01 | 0.0988 |
| 283131 | NEAT1 | GSM4909290 | Human | Breast | IDC | 1.80e-11 | 2.45e-01 | 0.2096 |
| 283131 | NEAT1 | GSM4909291 | Human | Breast | IDC | 2.64e-15 | 4.06e-01 | 0.1753 |
| 283131 | NEAT1 | GSM4909292 | Human | Breast | IDC | 8.24e-33 | 7.94e-01 | 0.1236 |
| 283131 | NEAT1 | GSM4909293 | Human | Breast | IDC | 5.16e-12 | 2.95e-01 | 0.1581 |
| 283131 | NEAT1 | GSM4909294 | Human | Breast | IDC | 8.16e-48 | -8.28e-01 | 0.2022 |
| 283131 | NEAT1 | GSM4909296 | Human | Breast | IDC | 1.18e-09 | 2.14e-01 | 0.1524 |
| 283131 | NEAT1 | GSM4909297 | Human | Breast | IDC | 2.11e-13 | -3.26e-01 | 0.1517 |
| 283131 | NEAT1 | GSM4909299 | Human | Breast | IDC | 3.33e-05 | 2.55e-01 | 0.035 |
| 283131 | NEAT1 | GSM4909300 | Human | Breast | IDC | 7.57e-03 | 2.66e-01 | 0.0334 |
| 283131 | NEAT1 | GSM4909301 | Human | Breast | IDC | 7.18e-62 | 5.50e-01 | 0.1577 |
| 283131 | NEAT1 | GSM4909302 | Human | Breast | IDC | 2.48e-24 | 4.13e-01 | 0.1545 |
| 283131 | NEAT1 | GSM4909303 | Human | Breast | IDC | 7.46e-06 | 1.44e-01 | 0.0438 |
| 283131 | NEAT1 | GSM4909304 | Human | Breast | IDC | 4.74e-42 | 4.66e-01 | 0.1636 |
| 283131 | NEAT1 | GSM4909307 | Human | Breast | IDC | 2.47e-05 | 2.64e-01 | 0.1569 |
| 283131 | NEAT1 | GSM4909308 | Human | Breast | IDC | 8.03e-18 | 3.72e-01 | 0.158 |
| 283131 | NEAT1 | GSM4909309 | Human | Breast | IDC | 1.14e-07 | 2.51e-01 | 0.0483 |
| Page: 1 2 3 4 5 6 7 8 9 10 11 12 13 14 15 16 17 18 19 |
| Tissue | Expression Dynamics | Abbreviation |
| Breast | 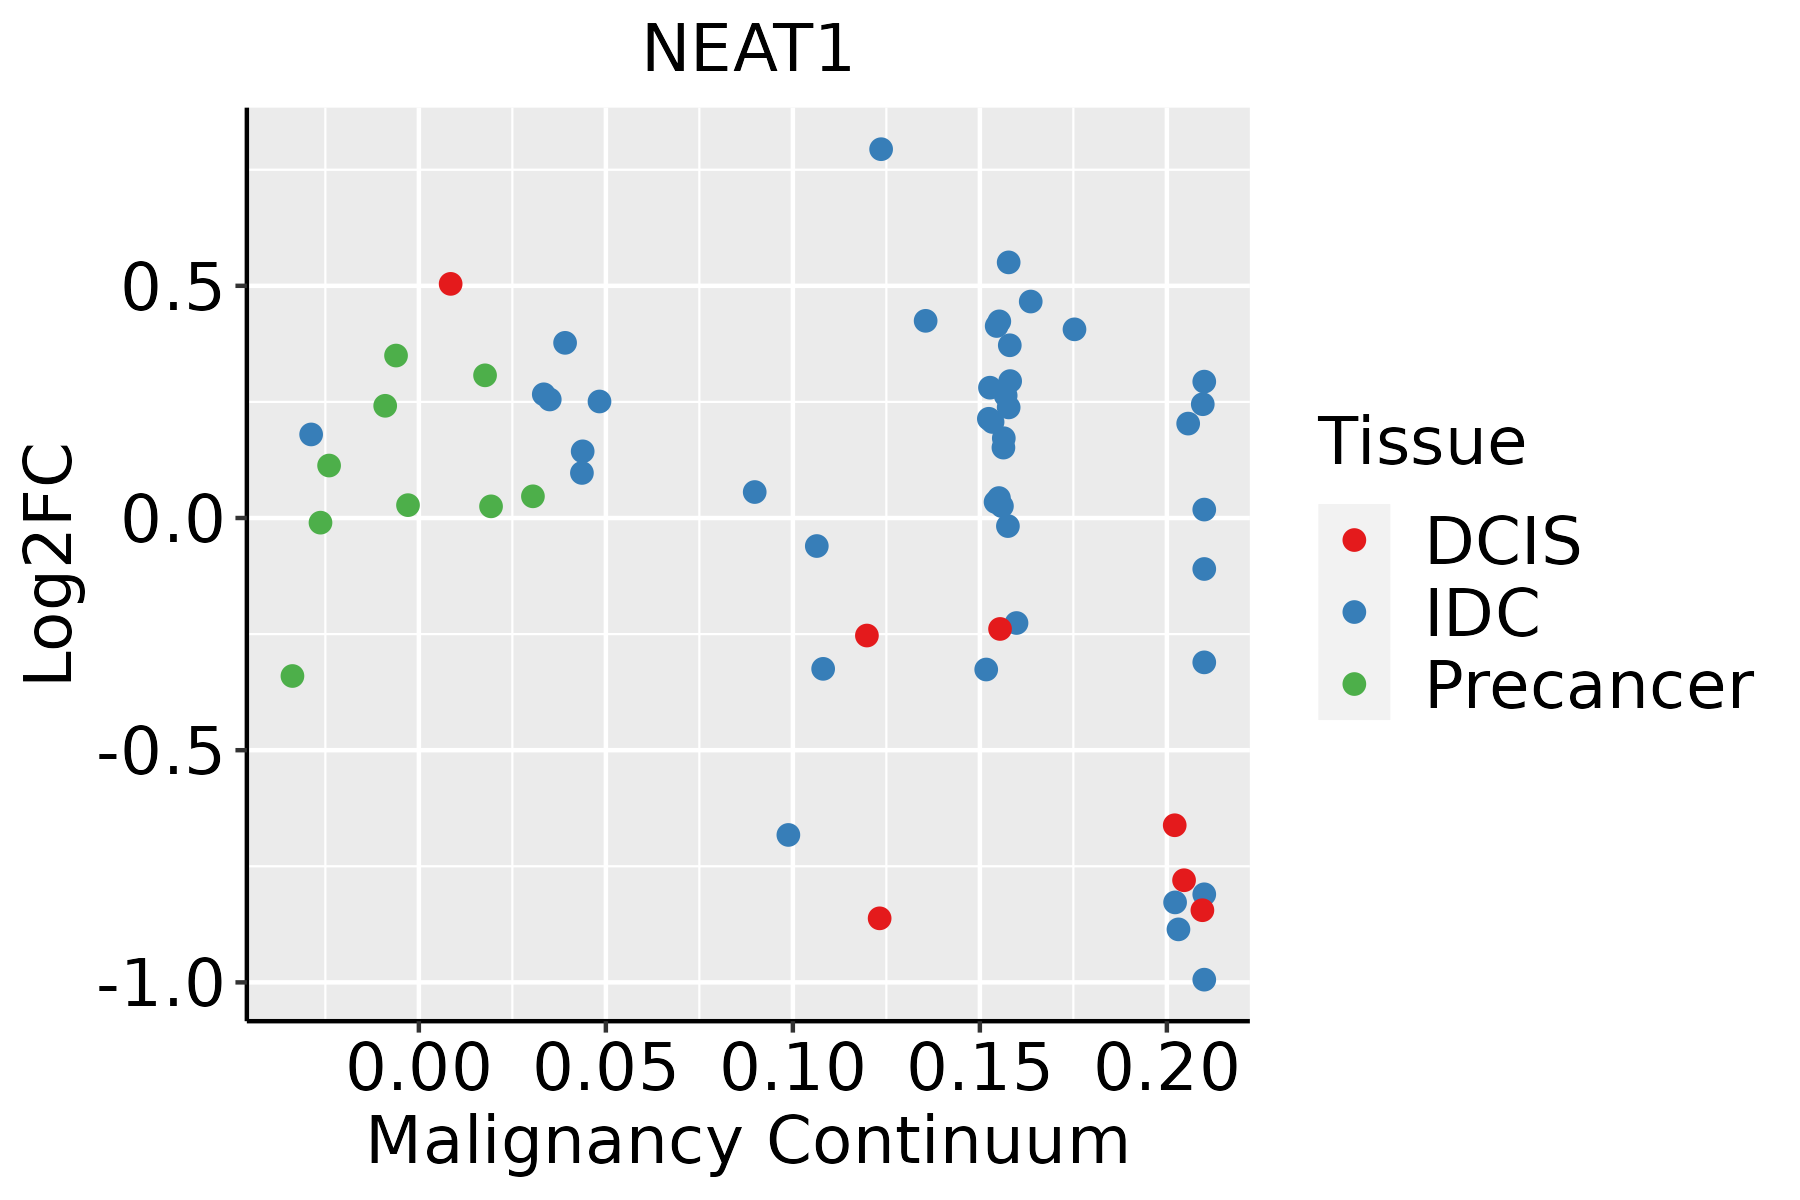 | IDC: Invasive ductal carcinoma |
| DCIS: Ductal carcinoma in situ | ||
| Precancer(BRCA1-mut): Precancerous lesion from BRCA1 mutation carriers | ||
| Cervix | 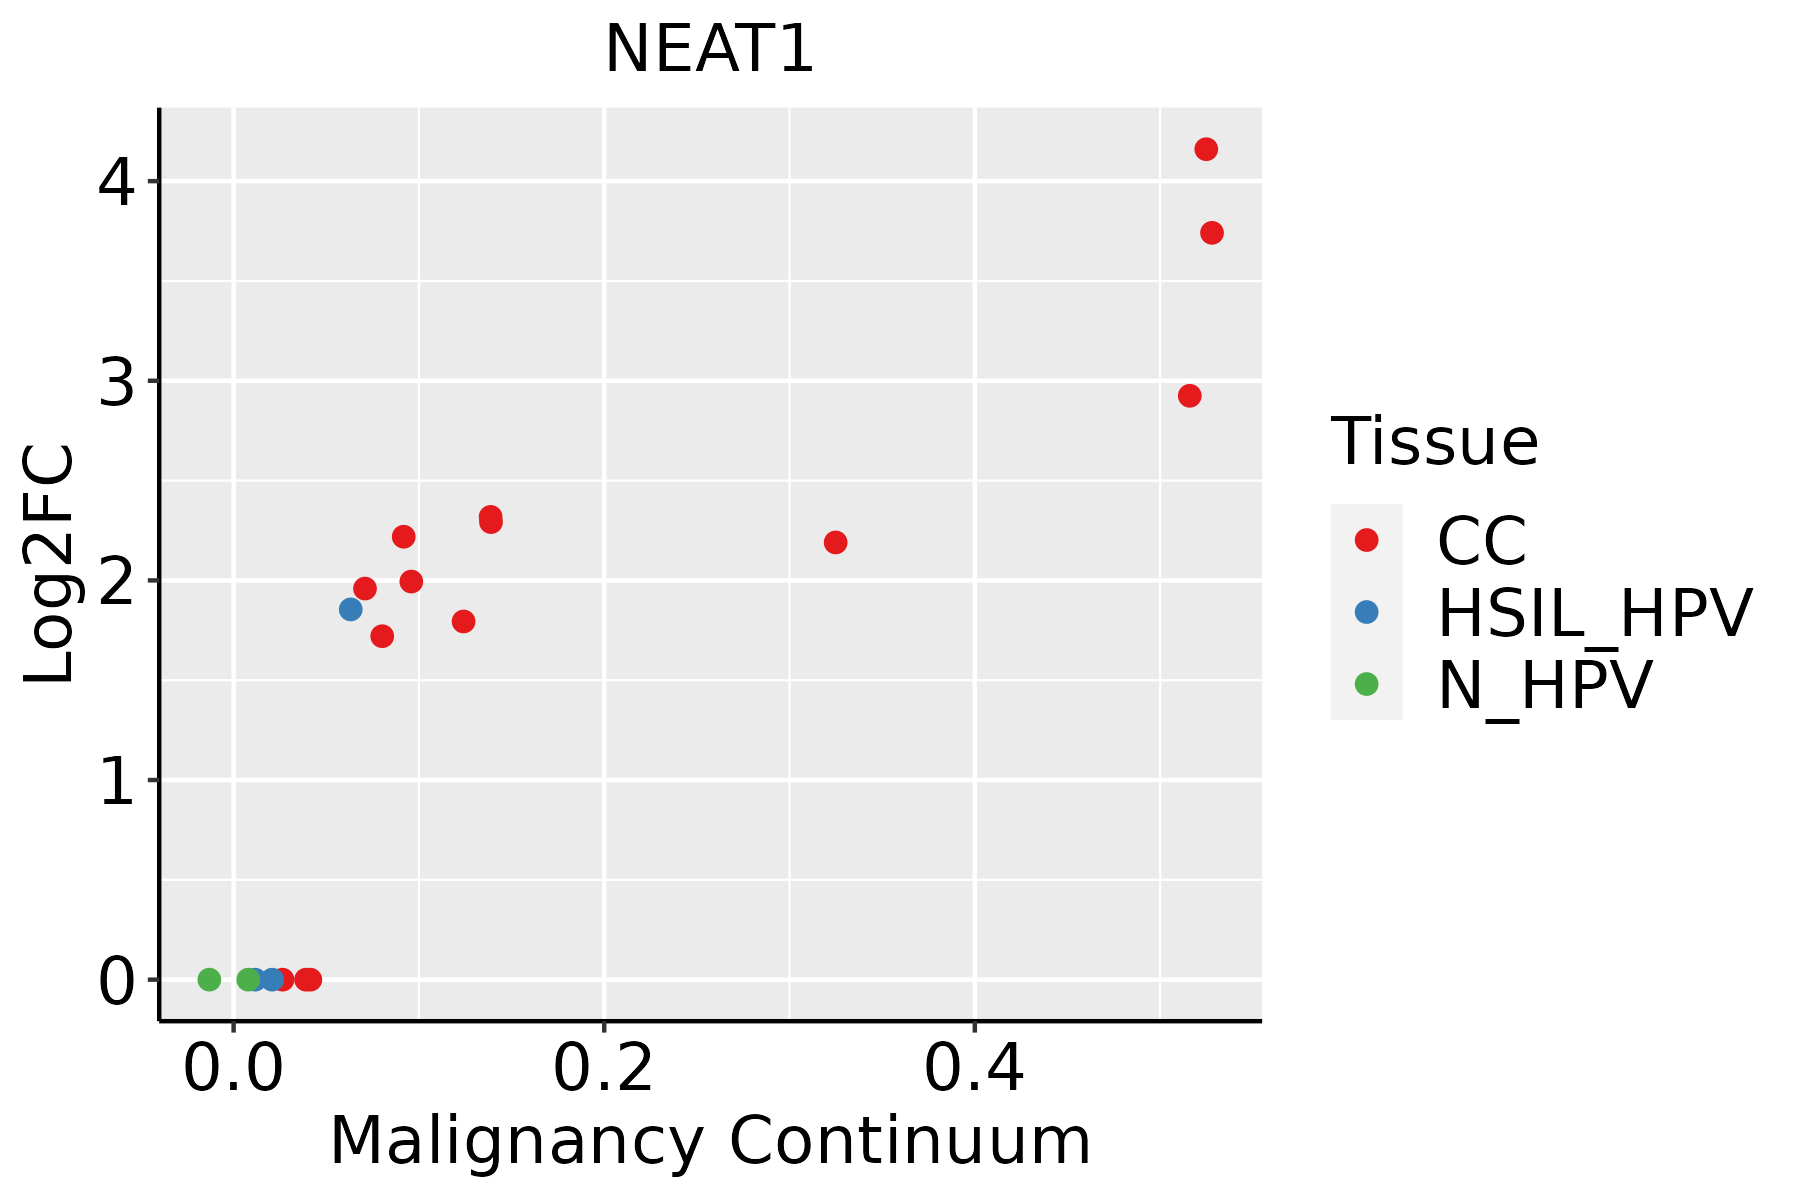 | CC: Cervix cancer |
| HSIL_HPV: HPV-infected high-grade squamous intraepithelial lesions | ||
| N_HPV: HPV-infected normal cervix | ||
| Colorectum (GSE201348) |  | FAP: Familial adenomatous polyposis |
| CRC: Colorectal cancer | ||
| Colorectum (HTA11) |  | AD: Adenomas |
| SER: Sessile serrated lesions | ||
| MSI-H: Microsatellite-high colorectal cancer | ||
| MSS: Microsatellite stable colorectal cancer | ||
| Endometrium | 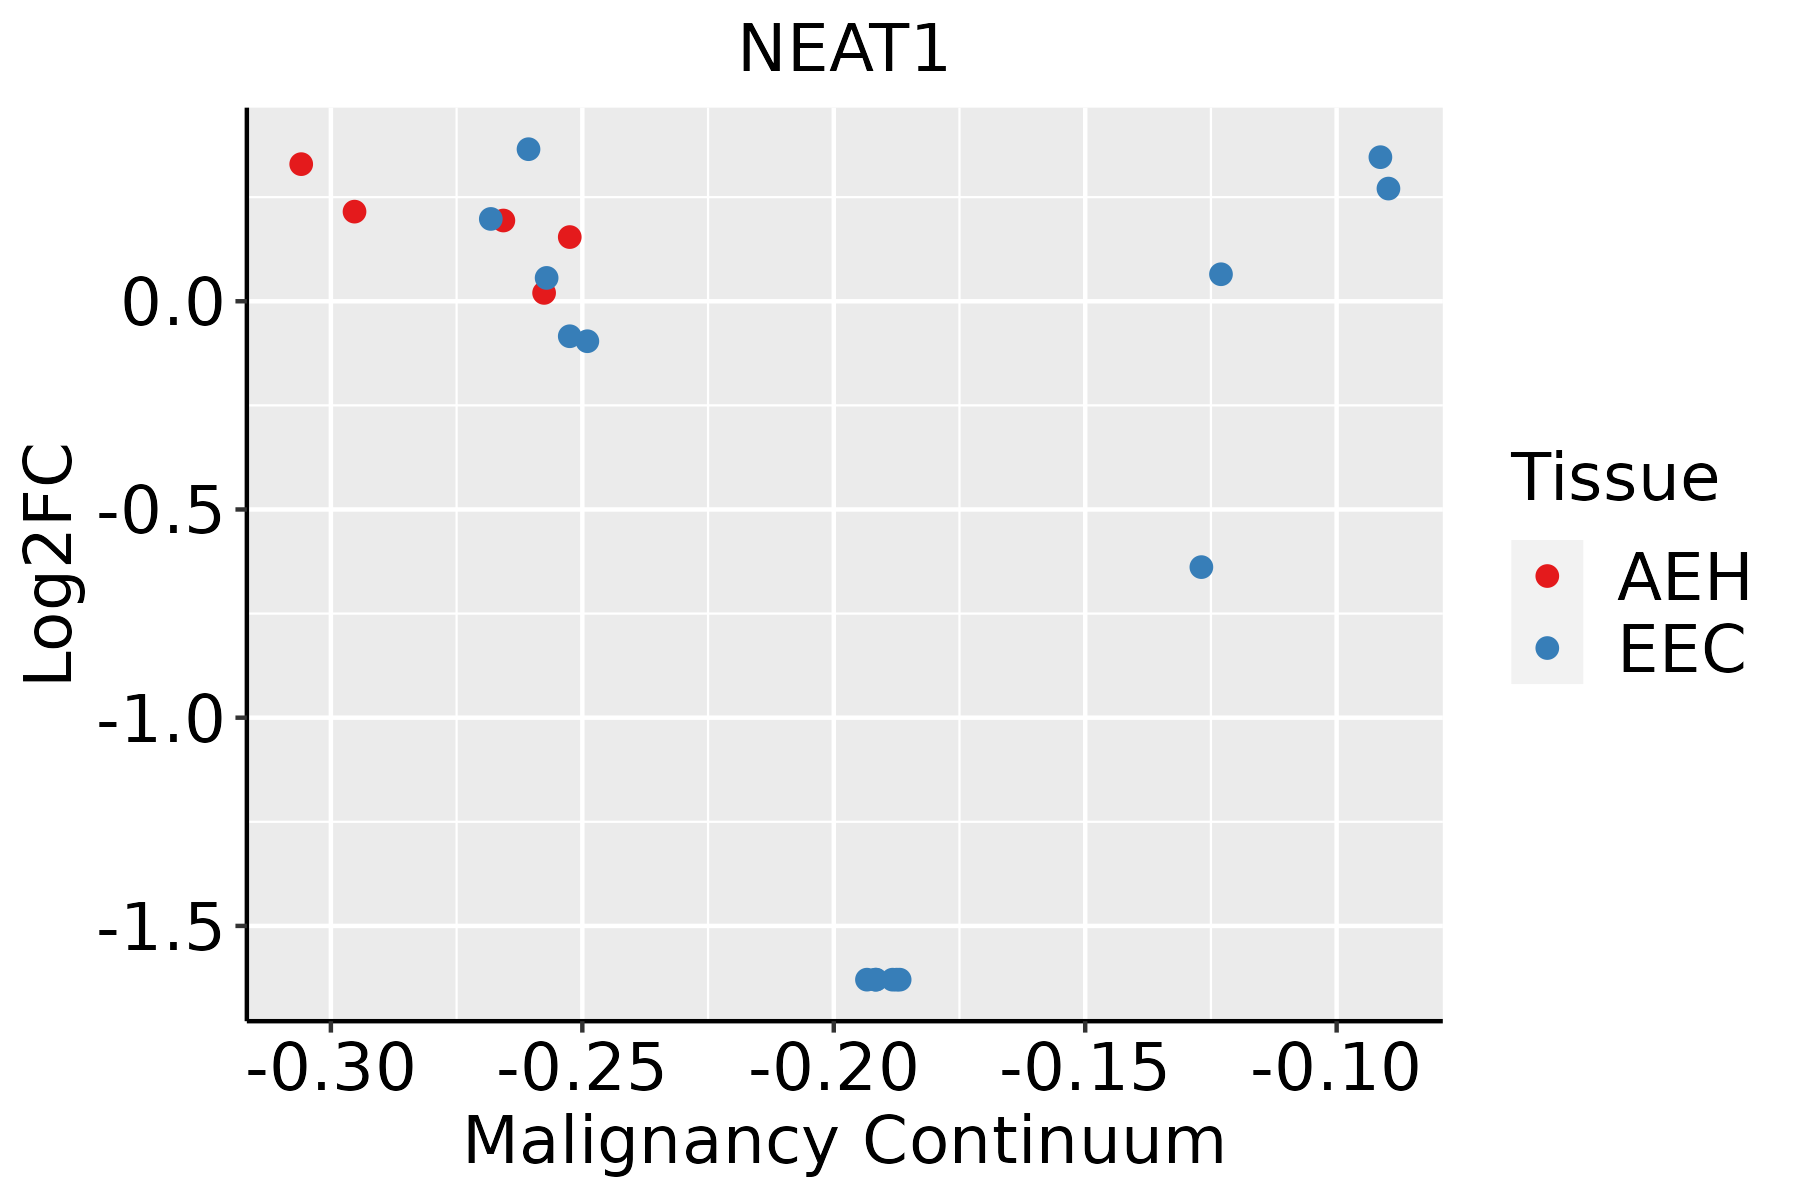 | AEH: Atypical endometrial hyperplasia |
| EEC: Endometrioid Cancer | ||
| Esophagus | 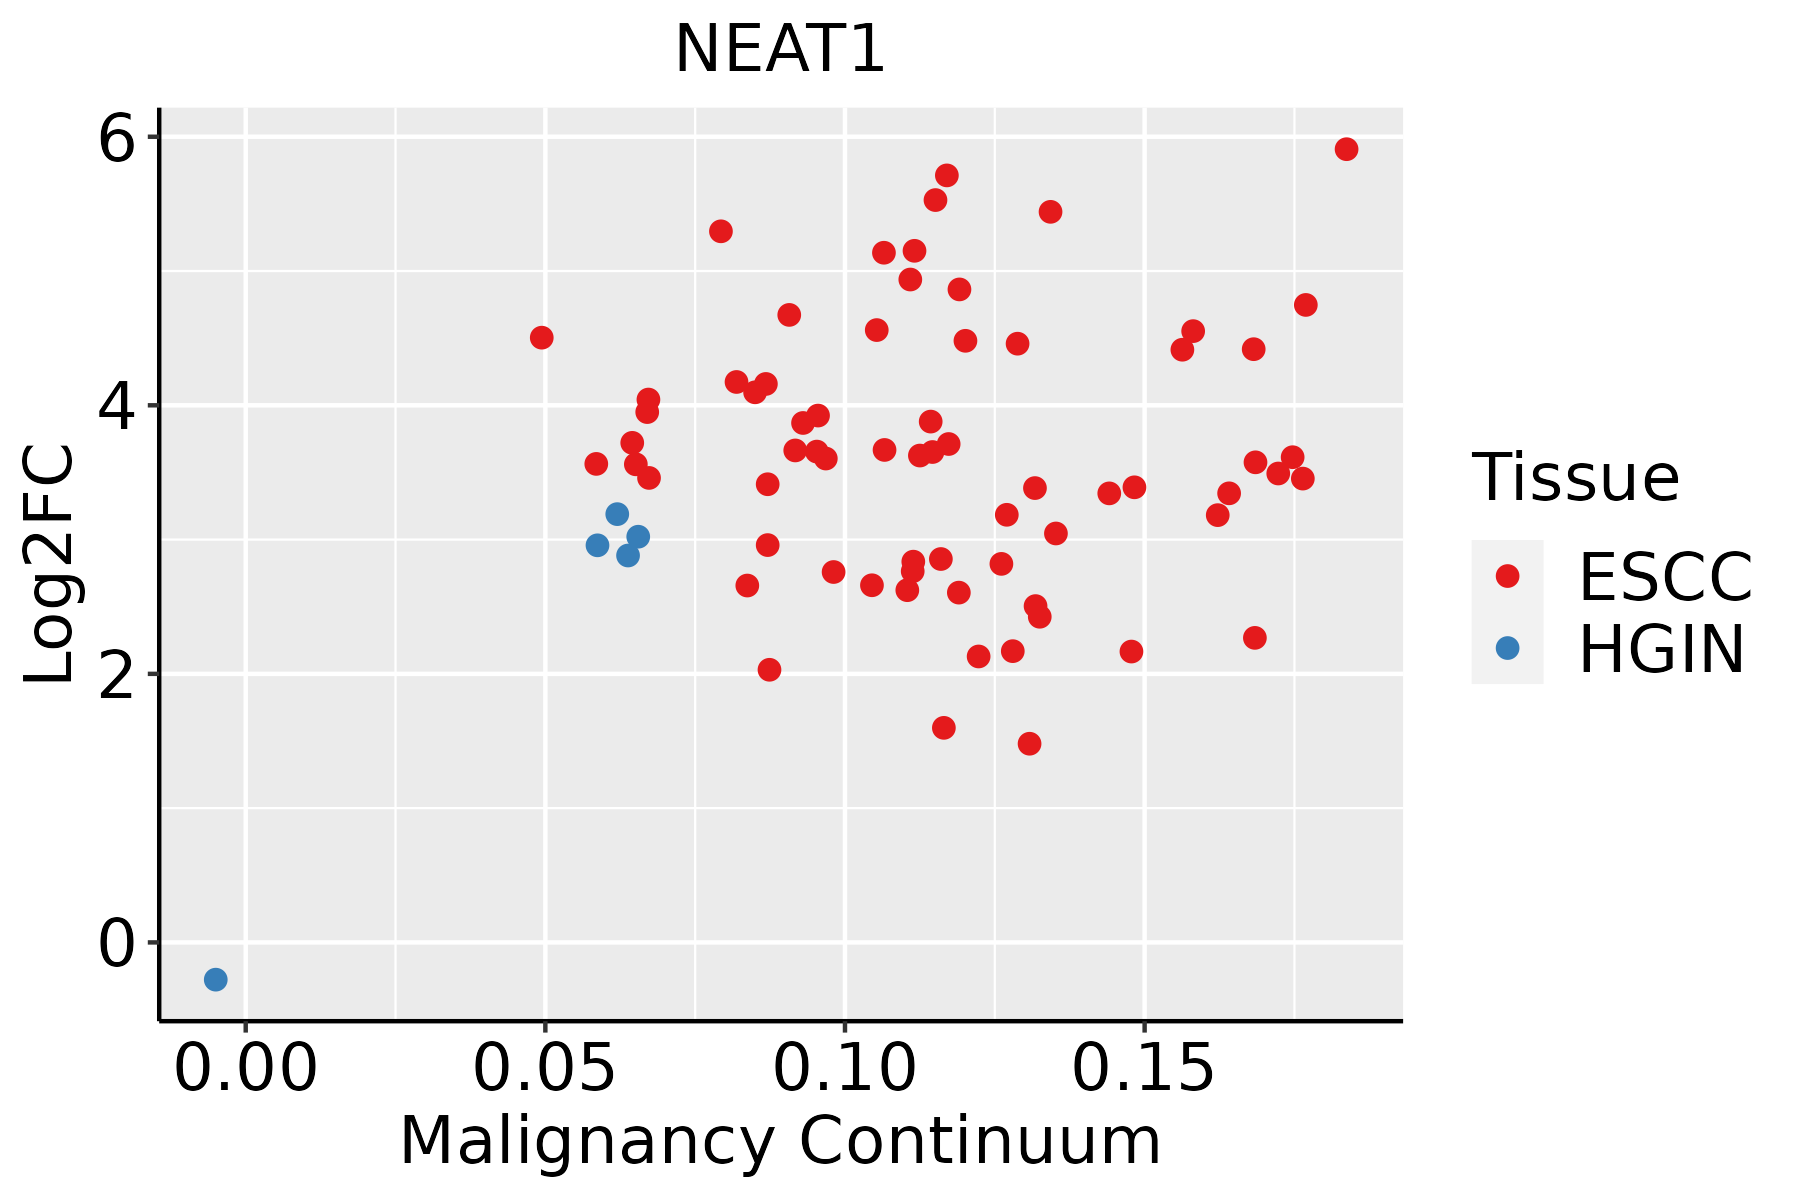 | ESCC: Esophageal squamous cell carcinoma |
| HGIN: High-grade intraepithelial neoplasias | ||
| LGIN: Low-grade intraepithelial neoplasias | ||
| GC | 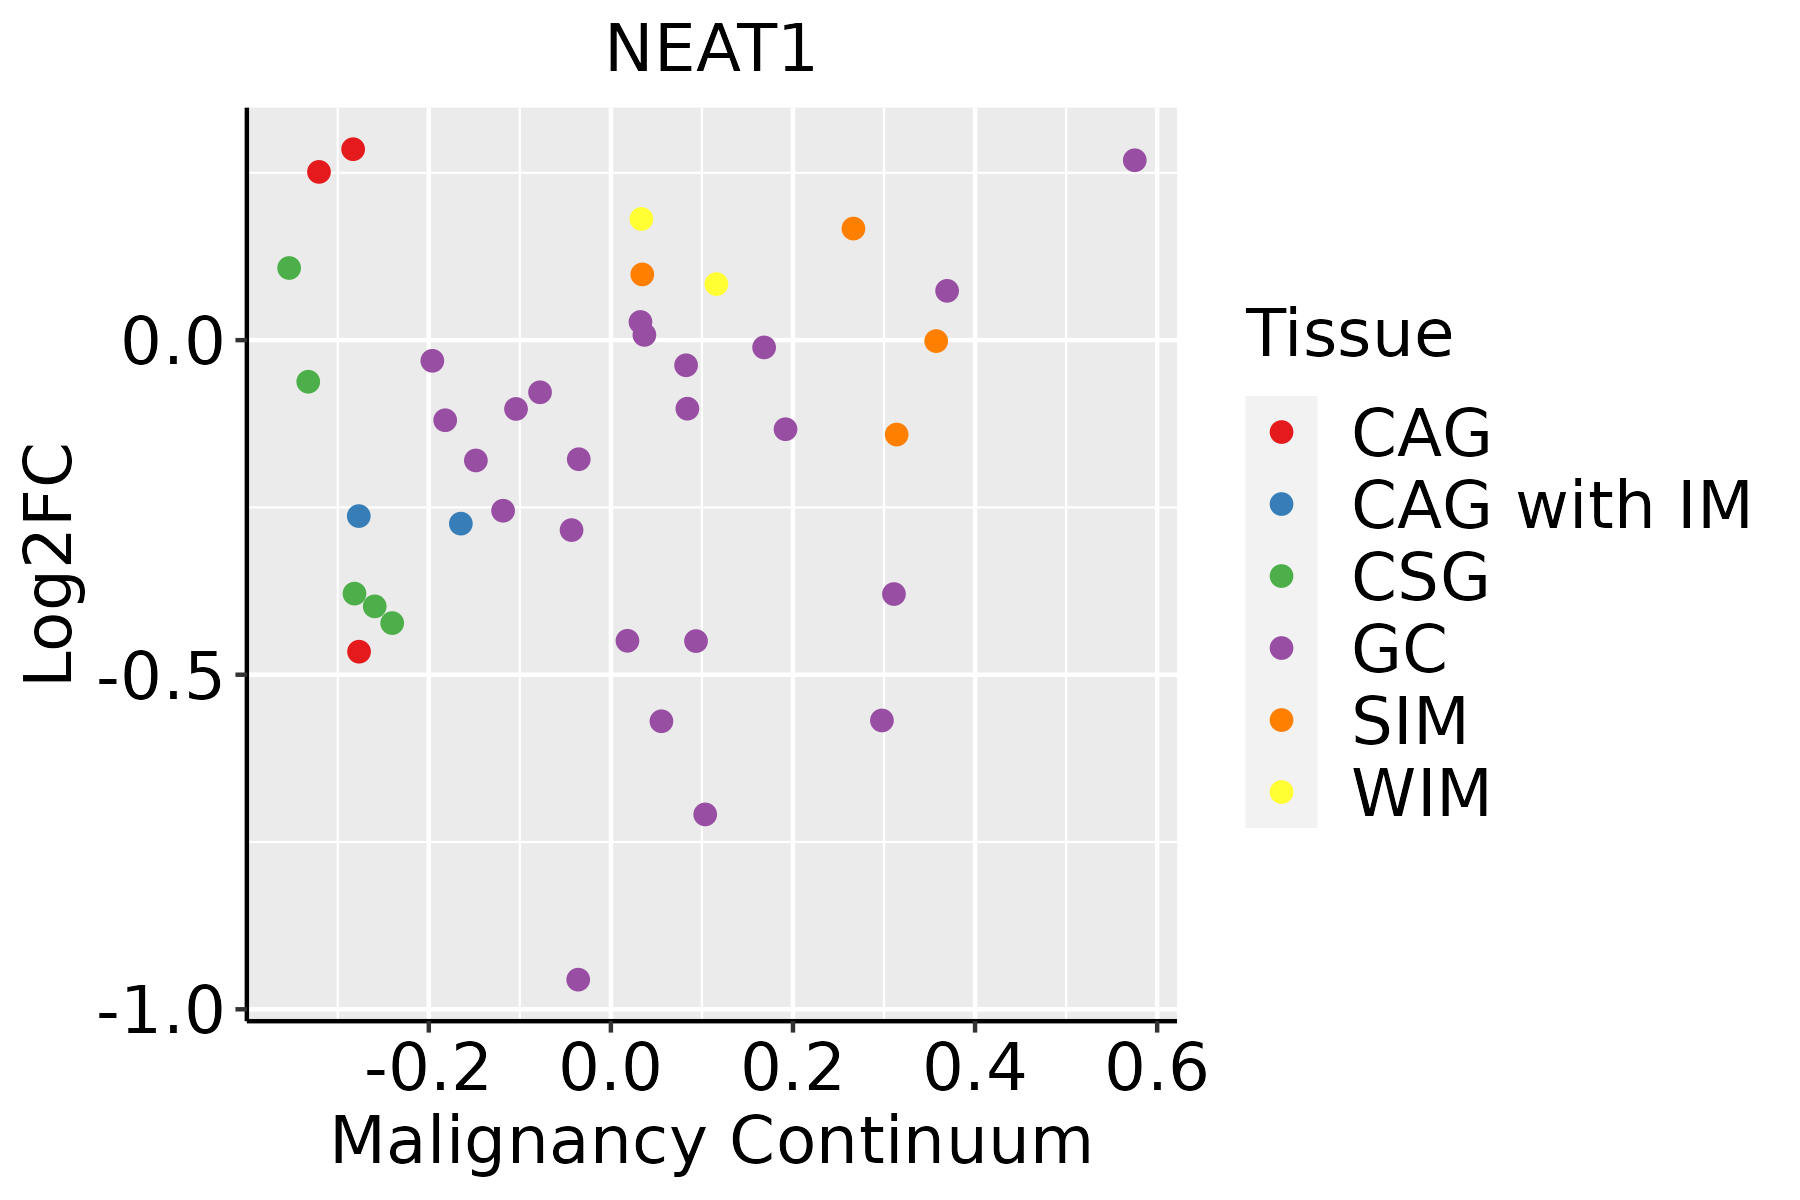 | CAG: Chronic atrophic gastritis |
| CAG with IM: Chronic atrophic gastritis with intestinal metaplasia | ||
| CSG: Chronic superficial gastritis | ||
| GC: Gastric cancer | ||
| SIM: Severe intestinal metaplasia | ||
| WIM: Wild intestinal metaplasia | ||
| Liver |  | HCC: Hepatocellular carcinoma |
| NAFLD: Non-alcoholic fatty liver disease | ||
| Lung | 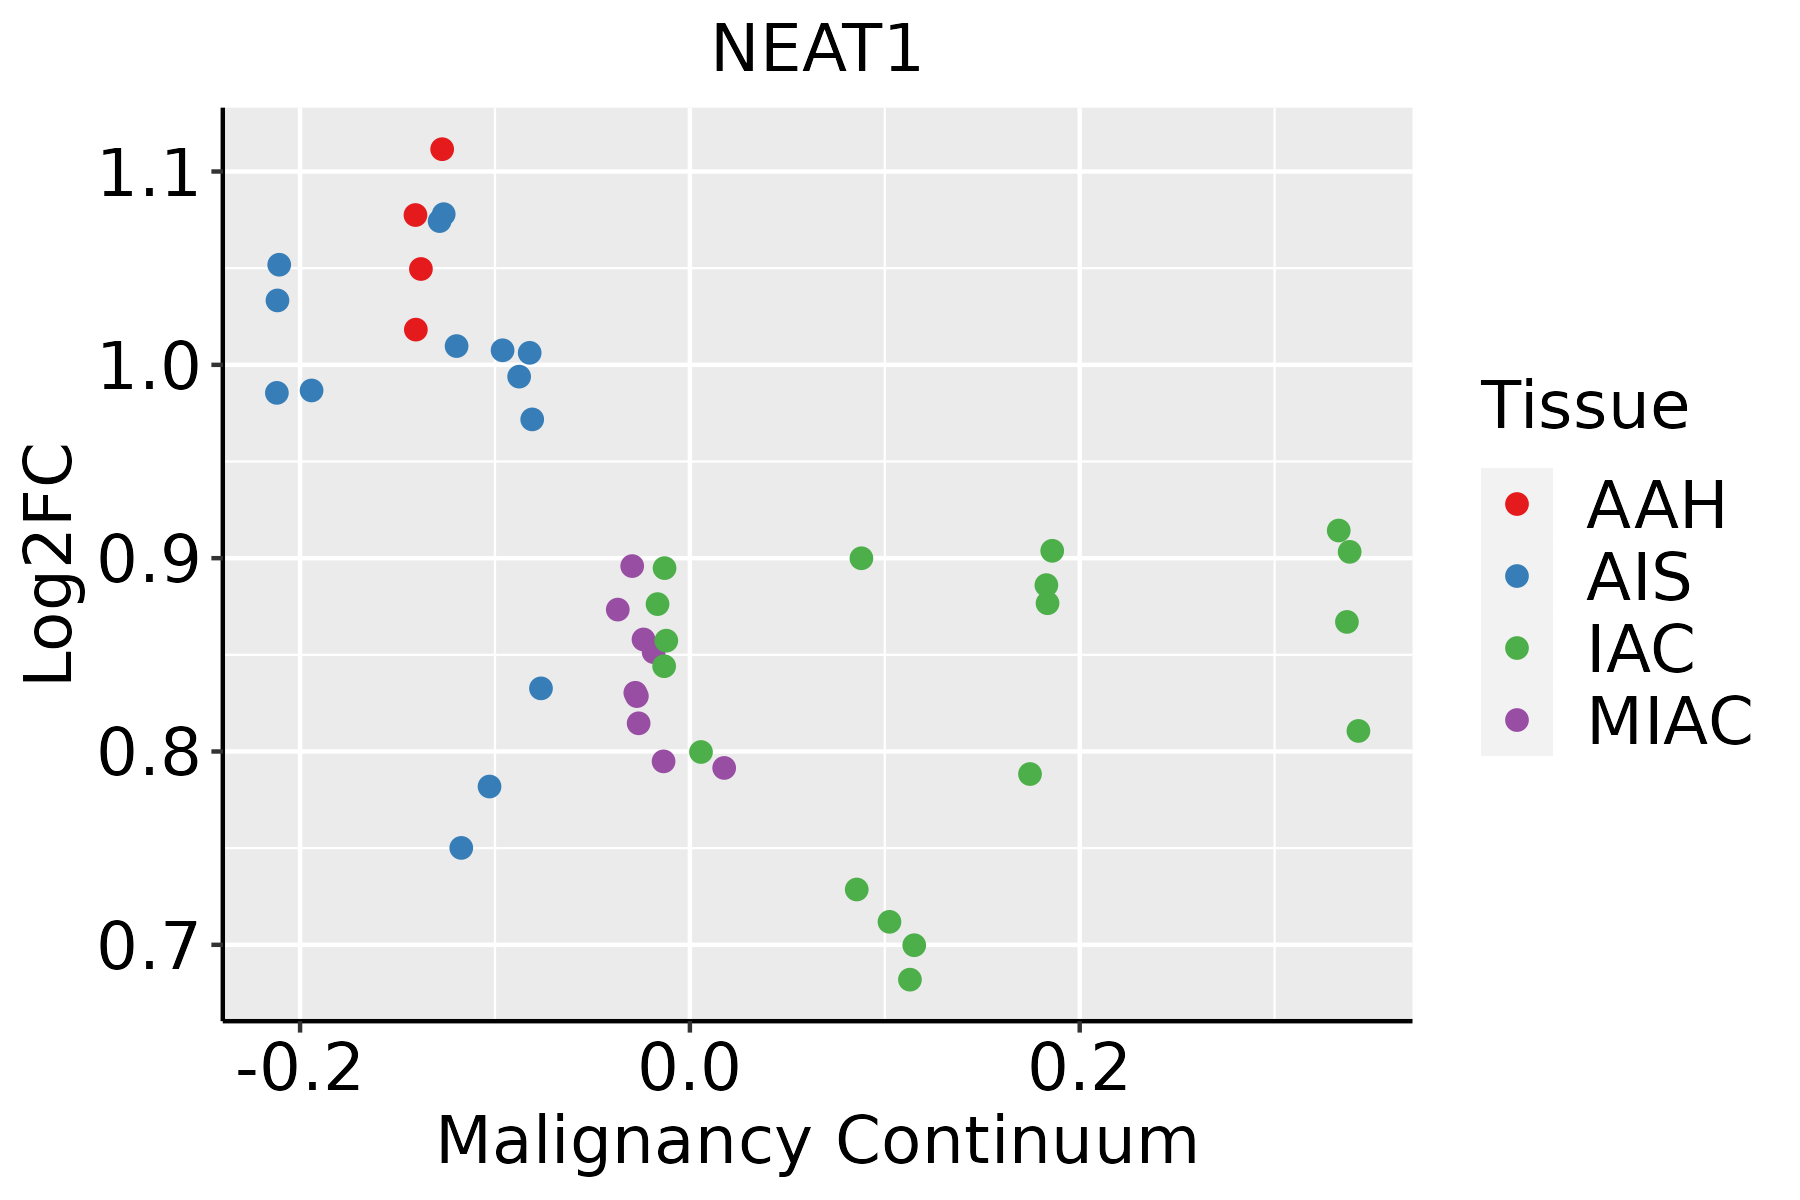 | AAH: Atypical adenomatous hyperplasia |
| AIS: Adenocarcinoma in situ | ||
| IAC: Invasive lung adenocarcinoma | ||
| MIA: Minimally invasive adenocarcinoma | ||
| Oral Cavity | 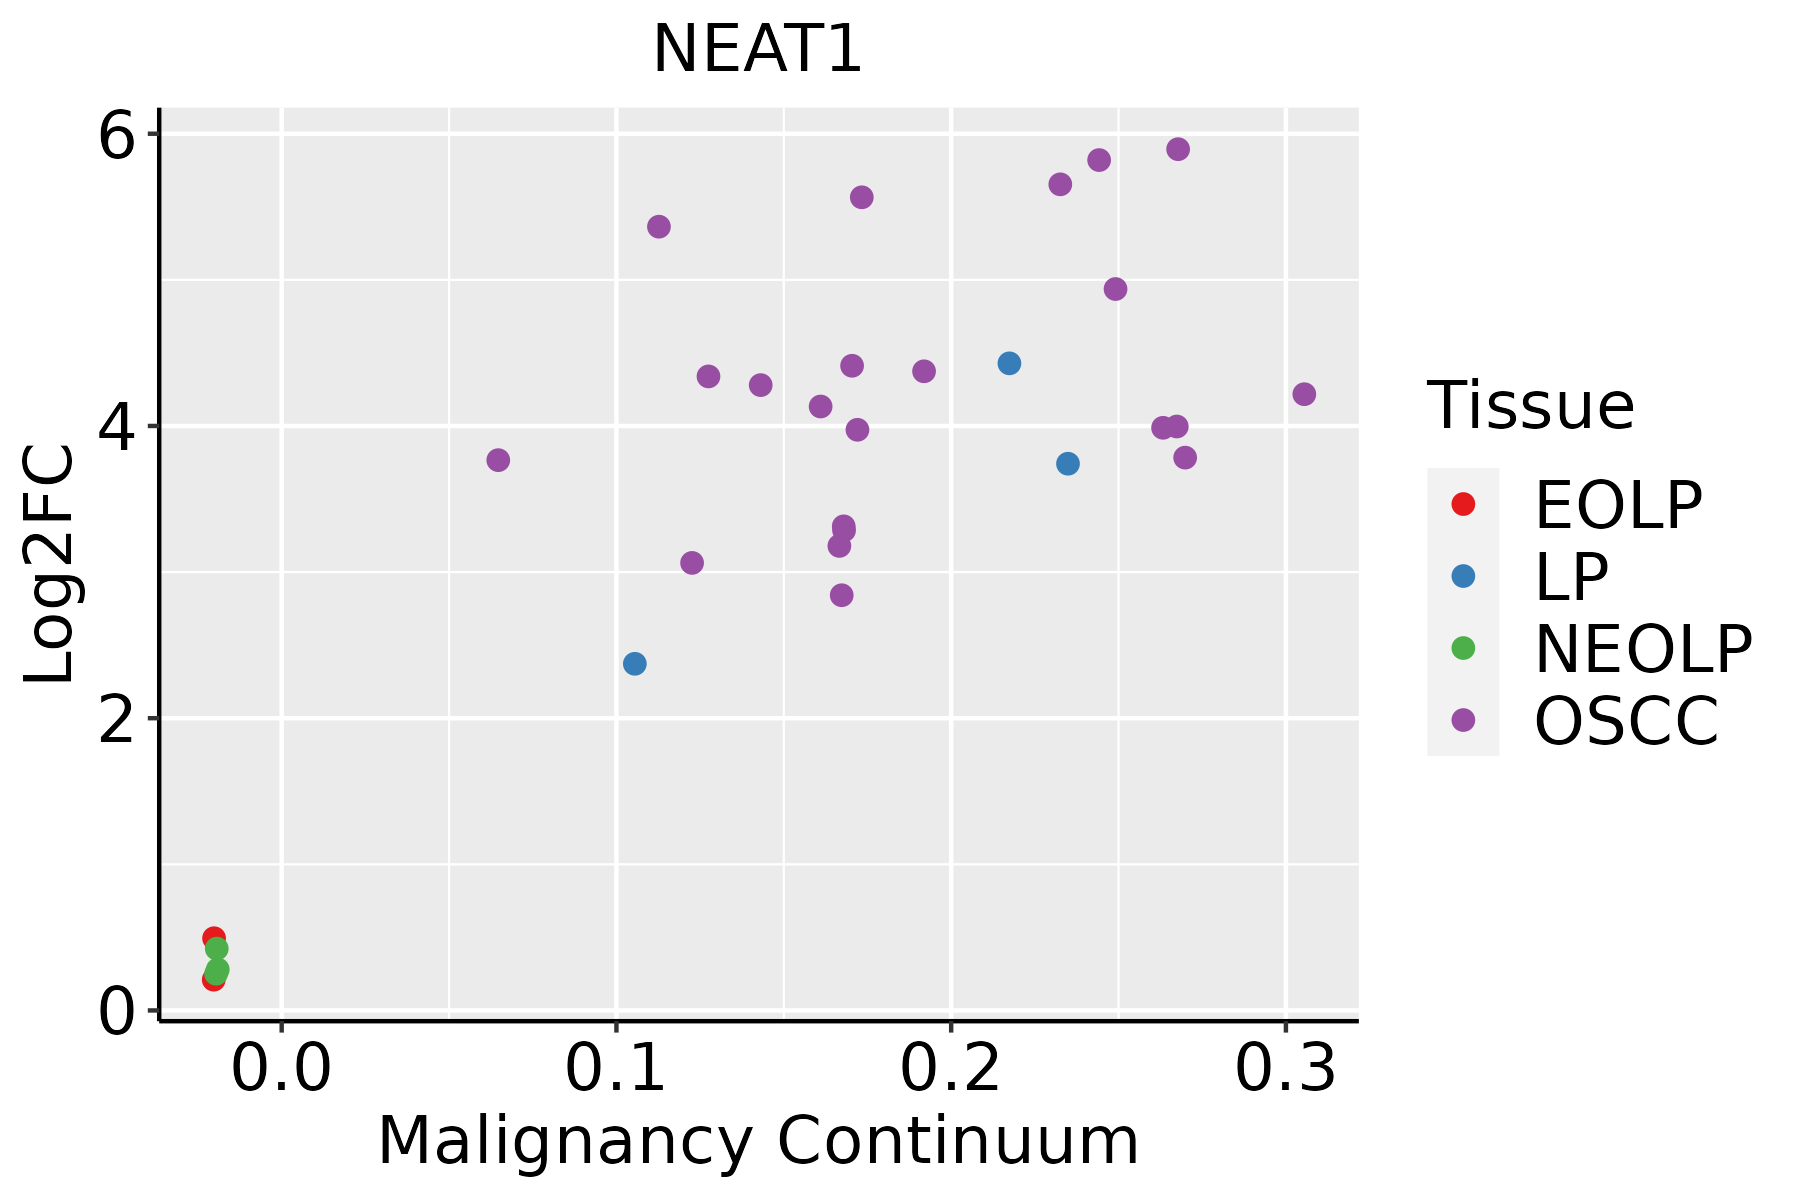 | EOLP: Erosive Oral lichen planus |
| LP: leukoplakia | ||
| NEOLP: Non-erosive oral lichen planus | ||
| OSCC: Oral squamous cell carcinoma | ||
| Prostate | 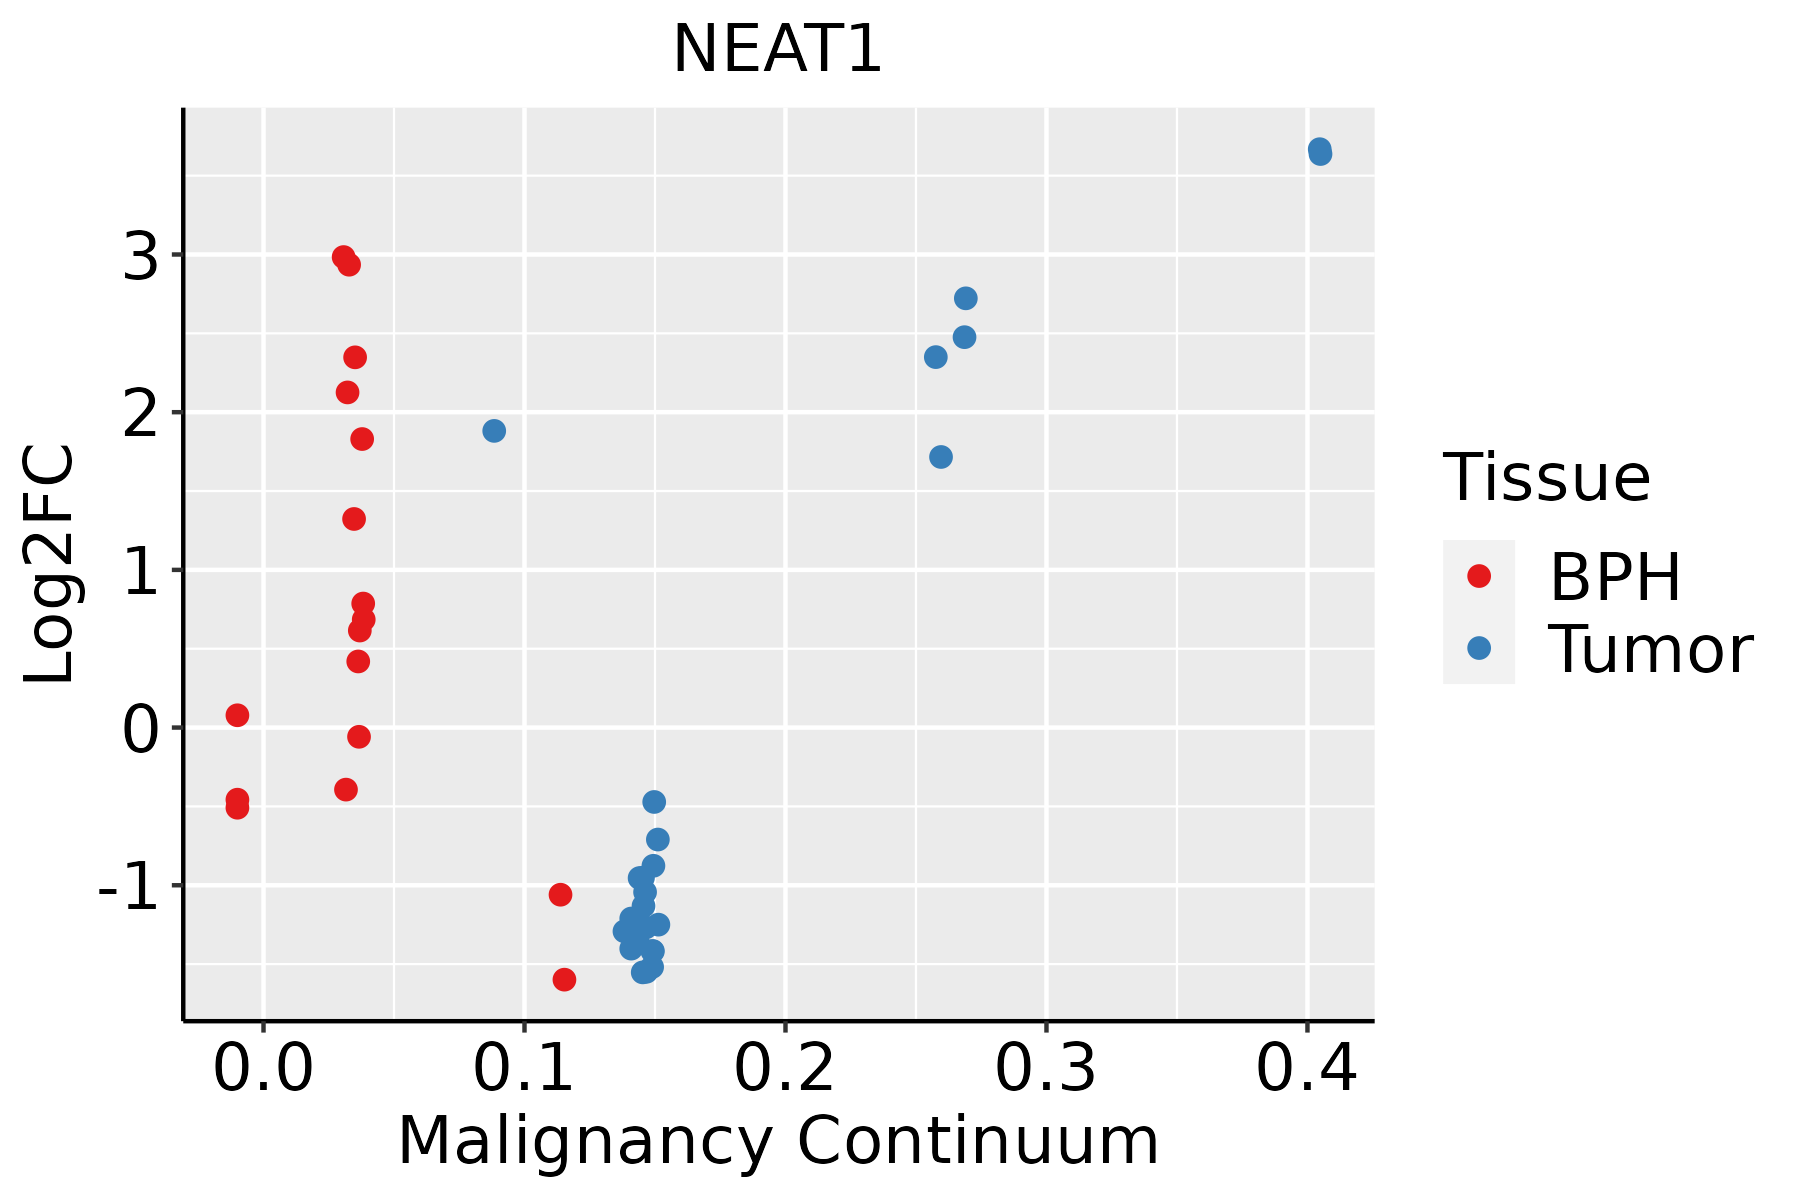 | BPH: Benign Prostatic Hyperplasia |
| Skin | 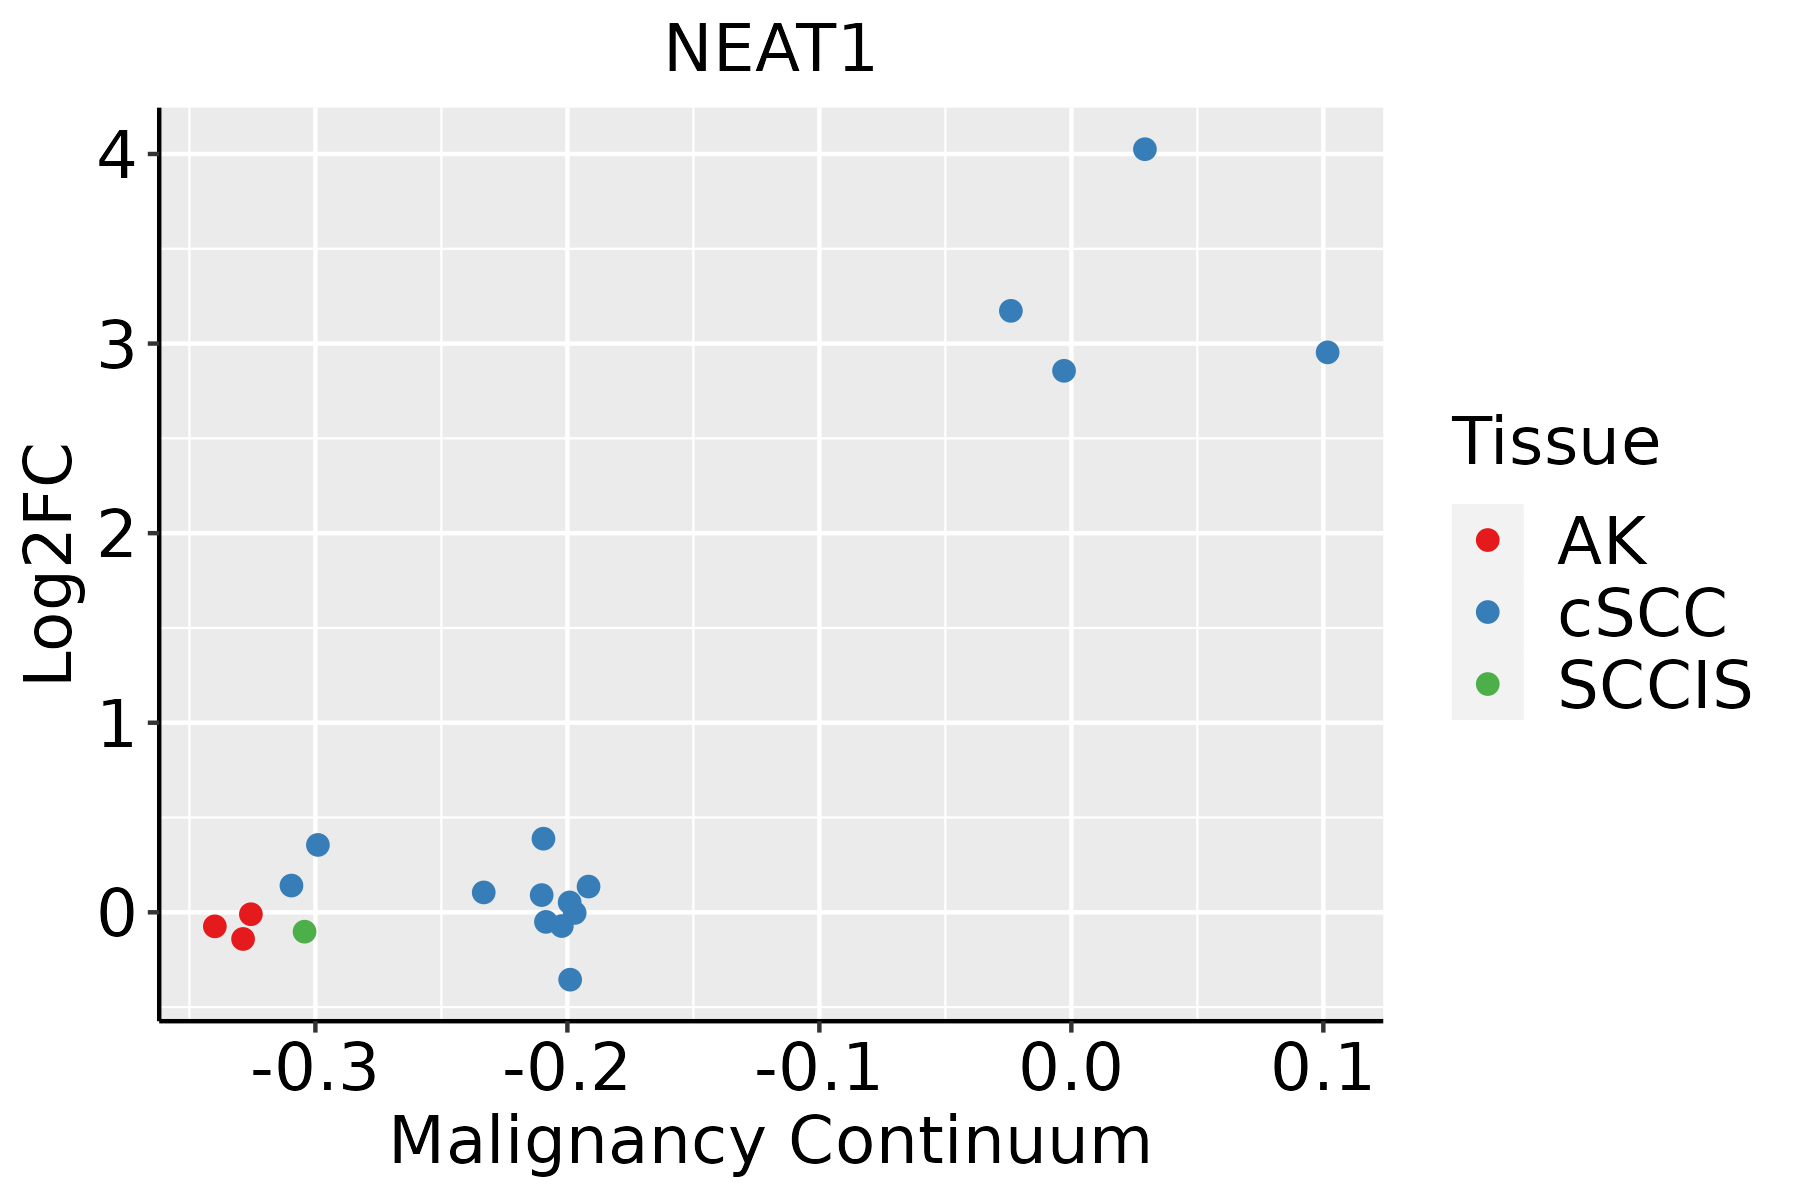 | AK: Actinic keratosis |
| cSCC: Cutaneous squamous cell carcinoma | ||
| SCCIS:squamous cell carcinoma in situ | ||
| Thyroid | 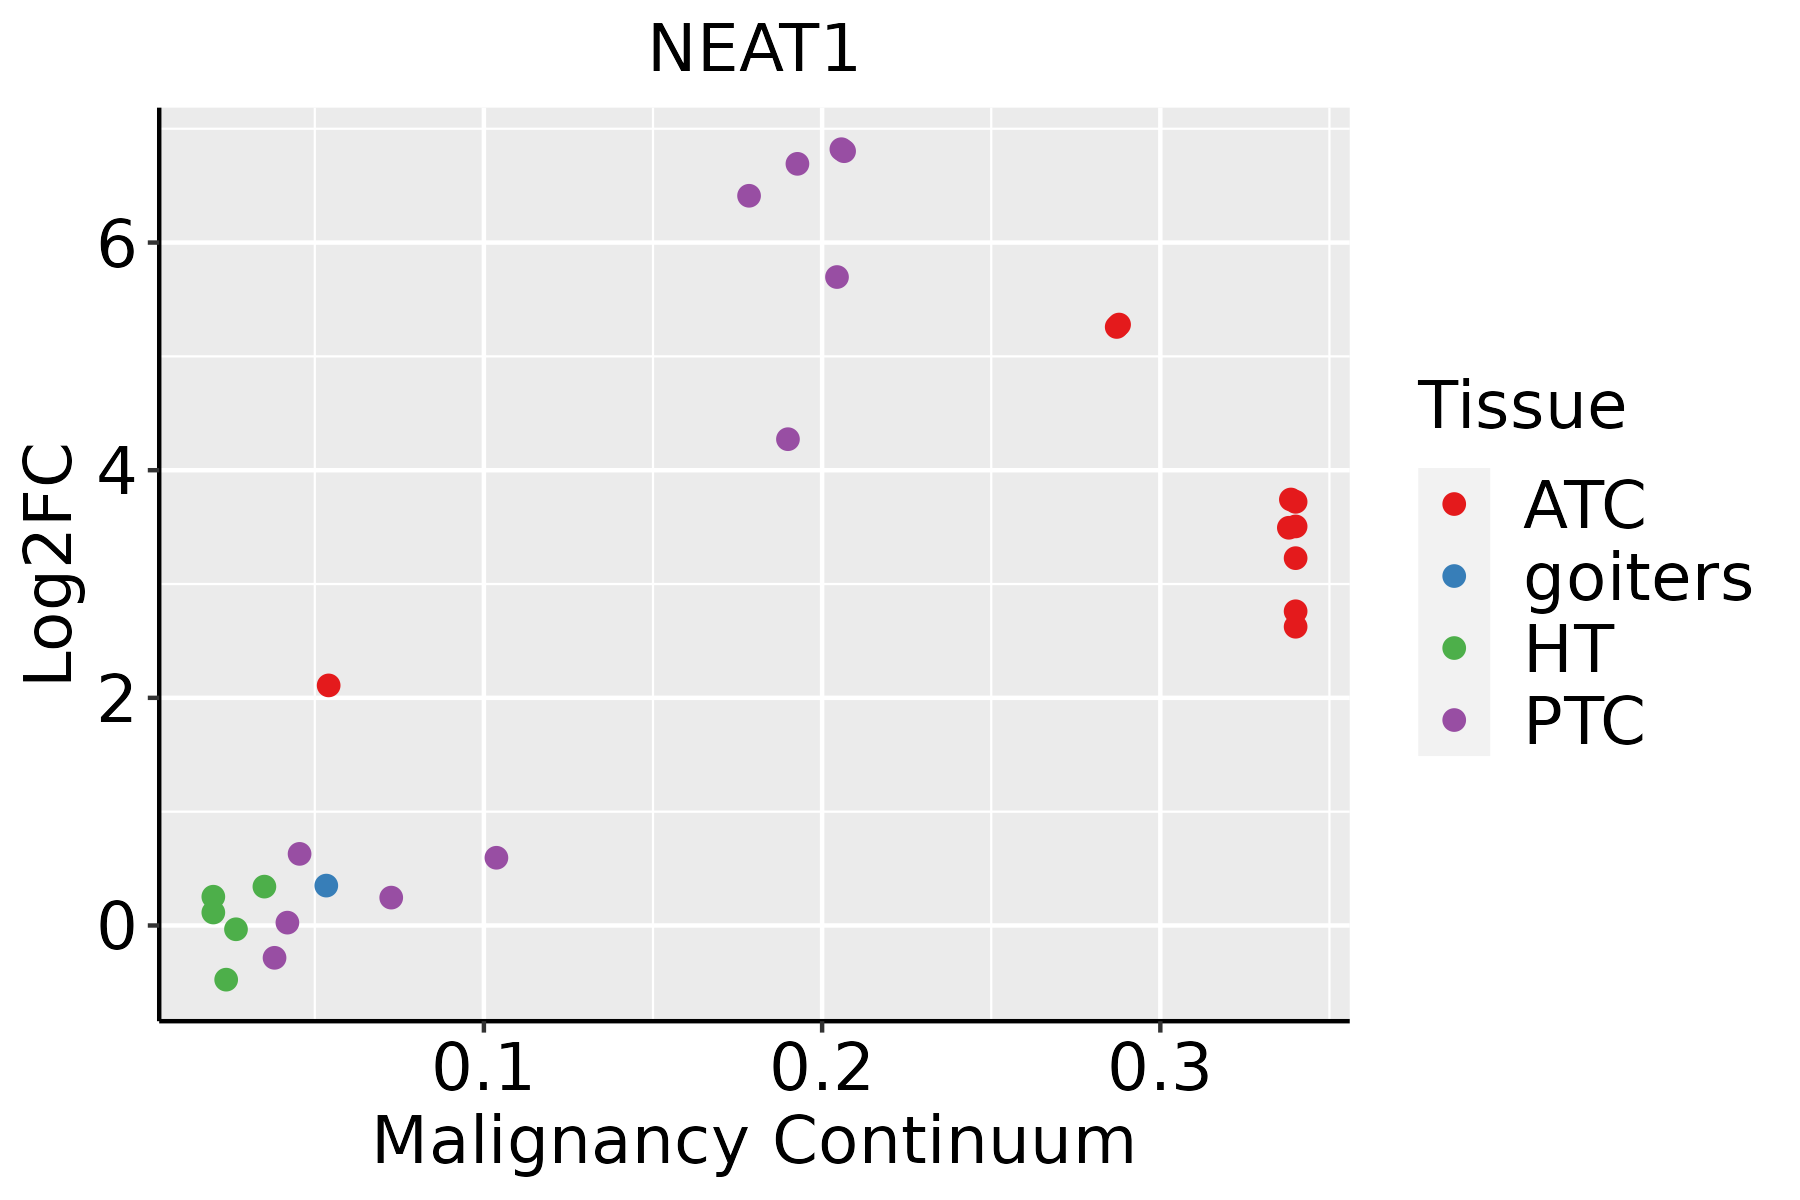 | ATC: Anaplastic thyroid cancer |
| HT: Hashimoto's thyroiditis | ||
| PTC: Papillary thyroid cancer |
| ∗log2FC in expression of this searched gene in stem-like cells from each diseased tissue sample relative to stem-like cells in normal samples in each tissue plotted against the malignancy continuum. Samples are colored based on if they are from different disease stage. |
Top |
Malignant transformation related pathway analysis |
| Find out the enriched GO biological processes and KEGG pathways involved in transition from healthy to precancer to cancer |
| Tissue | Disease Stage | Enriched GO biological Processes |
| Colorectum | CRC |  |
| Stomach | GC |  |
| Stomach | CAG with IM |  |
| Stomach | CSG |  |
| Stomach | CAG |  |
| ∗Top 15 enriched GO BP terms are showed in the bar plot of each disease state in each tissue. Each row represents a significant GO biological process which is colored according to the -log10(p.adjust). |
| Page: 1 2 3 4 5 6 7 8 9 |
| GO ID | Tissue | Disease Stage | Description | Gene Ratio | Bg Ratio | pvalue | p.adjust | Count |
| GO:00507293 | Breast | Precancer | positive regulation of inflammatory response | 23/1080 | 142/18723 | 6.51e-06 | 1.81e-04 | 23 |
| GO:0050727 | Breast | Precancer | regulation of inflammatory response | 44/1080 | 386/18723 | 1.26e-05 | 3.22e-04 | 44 |
| GO:00321034 | Breast | Precancer | positive regulation of response to external stimulus | 46/1080 | 427/18723 | 3.41e-05 | 7.40e-04 | 46 |
| GO:00313493 | Breast | Precancer | positive regulation of defense response | 33/1080 | 278/18723 | 6.79e-05 | 1.36e-03 | 33 |
| GO:00313491 | Breast | IDC | positive regulation of defense response | 39/1434 | 278/18723 | 1.74e-04 | 2.95e-03 | 39 |
| GO:003210311 | Breast | IDC | positive regulation of response to external stimulus | 54/1434 | 427/18723 | 1.85e-04 | 3.07e-03 | 54 |
| GO:00507291 | Breast | IDC | positive regulation of inflammatory response | 23/1434 | 142/18723 | 4.87e-04 | 6.42e-03 | 23 |
| GO:00507271 | Breast | IDC | regulation of inflammatory response | 48/1434 | 386/18723 | 5.99e-04 | 7.54e-03 | 48 |
| GO:003210321 | Breast | DCIS | positive regulation of response to external stimulus | 54/1390 | 427/18723 | 8.34e-05 | 1.58e-03 | 54 |
| GO:00313492 | Breast | DCIS | positive regulation of defense response | 38/1390 | 278/18723 | 1.91e-04 | 3.08e-03 | 38 |
| GO:00507292 | Breast | DCIS | positive regulation of inflammatory response | 22/1390 | 142/18723 | 7.81e-04 | 9.09e-03 | 22 |
| GO:00507272 | Breast | DCIS | regulation of inflammatory response | 46/1390 | 386/18723 | 9.91e-04 | 1.10e-02 | 46 |
| GO:00321035 | Cervix | CC | positive regulation of response to external stimulus | 95/2311 | 427/18723 | 5.44e-09 | 5.03e-07 | 95 |
| GO:00313494 | Cervix | CC | positive regulation of defense response | 60/2311 | 278/18723 | 9.38e-06 | 2.11e-04 | 60 |
| GO:00507273 | Cervix | CC | regulation of inflammatory response | 75/2311 | 386/18723 | 3.95e-05 | 6.18e-04 | 75 |
| GO:00507294 | Cervix | CC | positive regulation of inflammatory response | 34/2311 | 142/18723 | 9.51e-05 | 1.25e-03 | 34 |
| GO:00609647 | Cervix | CC | regulation of gene silencing by miRNA | 13/2311 | 49/18723 | 5.34e-03 | 3.10e-02 | 13 |
| GO:00601476 | Cervix | CC | regulation of posttranscriptional gene silencing | 13/2311 | 52/18723 | 9.09e-03 | 4.60e-02 | 13 |
| GO:005072711 | Cervix | HSIL_HPV | regulation of inflammatory response | 41/737 | 386/18723 | 8.30e-09 | 1.03e-06 | 41 |
| GO:003210312 | Cervix | HSIL_HPV | positive regulation of response to external stimulus | 41/737 | 427/18723 | 1.40e-07 | 9.01e-06 | 41 |
| Page: 1 2 3 4 5 6 7 |
| Pathway ID | Tissue | Disease Stage | Description | Gene Ratio | Bg Ratio | pvalue | p.adjust | qvalue | Count |
| Page: 1 |
Top |
Cell-cell communication analysis |
| Identification of potential cell-cell interactions between two cell types and their ligand-receptor pairs for different disease states |
| Ligand | Receptor | LRpair | Pathway | Tissue | Disease Stage |
| Page: 1 |
Top |
Single-cell gene regulatory network inference analysis |
| Find out the significant the regulons (TFs) and the target genes of each regulon across cell types for different disease states |
| TF | Cell Type | Tissue | Disease Stage | Target Gene | RSS | Regulon Activity |
| ∗The dot plots of a searched regulon are shown for all cell subpopulations in each disease state of each tissue based on the regulon specific score inferred using pySCENIC and by calculating the average expression. |
| Page: 1 |
Top |
Somatic mutation of malignant transformation related genes |
| Annotation of somatic variants for genes involved in malignant transformation |
| Hugo Symbol | Variant Class | Variant Classification | dbSNP RS | HGVSc | HGVSp | HGVSp Short | SWISSPROT | BIOTYPE | SIFT | PolyPhen | Tumor Sample Barcode | Tissue | Histology | Sex | Age | Stage | Therapy Types | Drugs | Outcome |
| Page: 1 |
Top |
Related drugs of malignant transformation related genes |
| Identification of chemicals and drugs interact with genes involved in malignant transfromation |
| (DGIdb 4.0) |
| Entrez ID | Symbol | Category | Interaction Types | Drug Claim Name | Drug Name | PMIDs |
| Page: 1 |

Copyright 2023-Present -The University of Texas Health Science Center at Houston |