
|
|||||
|
 | |
| |
| |
| |
| |
| |
|
Gene: MTO1 |
Gene summary for MTO1 |
| Gene information | Species | Human | Gene symbol | MTO1 | Gene ID | 25821 |
| Gene name | mitochondrial tRNA translation optimization 1 | |
| Gene Alias | CGI-02 | |
| Cytomap | 6q13 | |
| Gene Type | protein-coding | GO ID | GO:0000959 | UniProtAcc | Q9Y2Z2 |
Top |
Malignant transformation analysis |
| Identification of the aberrant gene expression in precancerous and cancerous lesions by comparing the gene expression of stem-like cells in diseased tissues with normal stem cells |
| Entrez ID | Symbol | Replicates | Species | Organ | Tissue | Adj P-value | Log2FC | Malignancy |
| 25821 | MTO1 | LZE4T | Human | Esophagus | ESCC | 1.78e-08 | 2.16e-01 | 0.0811 |
| 25821 | MTO1 | LZE7T | Human | Esophagus | ESCC | 3.31e-02 | 1.32e-01 | 0.0667 |
| 25821 | MTO1 | LZE24T | Human | Esophagus | ESCC | 1.88e-12 | 2.27e-01 | 0.0596 |
| 25821 | MTO1 | P1T-E | Human | Esophagus | ESCC | 2.06e-04 | 2.15e-01 | 0.0875 |
| 25821 | MTO1 | P2T-E | Human | Esophagus | ESCC | 3.56e-09 | 2.47e-01 | 0.1177 |
| 25821 | MTO1 | P4T-E | Human | Esophagus | ESCC | 2.55e-11 | 1.90e-01 | 0.1323 |
| 25821 | MTO1 | P5T-E | Human | Esophagus | ESCC | 2.34e-14 | 1.71e-01 | 0.1327 |
| 25821 | MTO1 | P8T-E | Human | Esophagus | ESCC | 4.66e-06 | 1.28e-01 | 0.0889 |
| 25821 | MTO1 | P9T-E | Human | Esophagus | ESCC | 1.97e-05 | 1.70e-01 | 0.1131 |
| 25821 | MTO1 | P10T-E | Human | Esophagus | ESCC | 7.49e-08 | 1.28e-01 | 0.116 |
| 25821 | MTO1 | P11T-E | Human | Esophagus | ESCC | 1.58e-06 | 3.18e-01 | 0.1426 |
| 25821 | MTO1 | P12T-E | Human | Esophagus | ESCC | 6.36e-18 | 2.73e-01 | 0.1122 |
| 25821 | MTO1 | P15T-E | Human | Esophagus | ESCC | 2.52e-09 | 2.02e-01 | 0.1149 |
| 25821 | MTO1 | P16T-E | Human | Esophagus | ESCC | 3.53e-16 | 2.23e-01 | 0.1153 |
| 25821 | MTO1 | P19T-E | Human | Esophagus | ESCC | 8.10e-10 | 5.01e-01 | 0.1662 |
| 25821 | MTO1 | P20T-E | Human | Esophagus | ESCC | 5.76e-05 | 9.53e-02 | 0.1124 |
| 25821 | MTO1 | P21T-E | Human | Esophagus | ESCC | 1.81e-18 | 2.81e-01 | 0.1617 |
| 25821 | MTO1 | P22T-E | Human | Esophagus | ESCC | 3.05e-11 | 1.37e-01 | 0.1236 |
| 25821 | MTO1 | P23T-E | Human | Esophagus | ESCC | 1.72e-15 | 3.05e-01 | 0.108 |
| 25821 | MTO1 | P24T-E | Human | Esophagus | ESCC | 1.93e-14 | 1.50e-01 | 0.1287 |
| Page: 1 2 3 |
| Tissue | Expression Dynamics | Abbreviation |
| Esophagus | 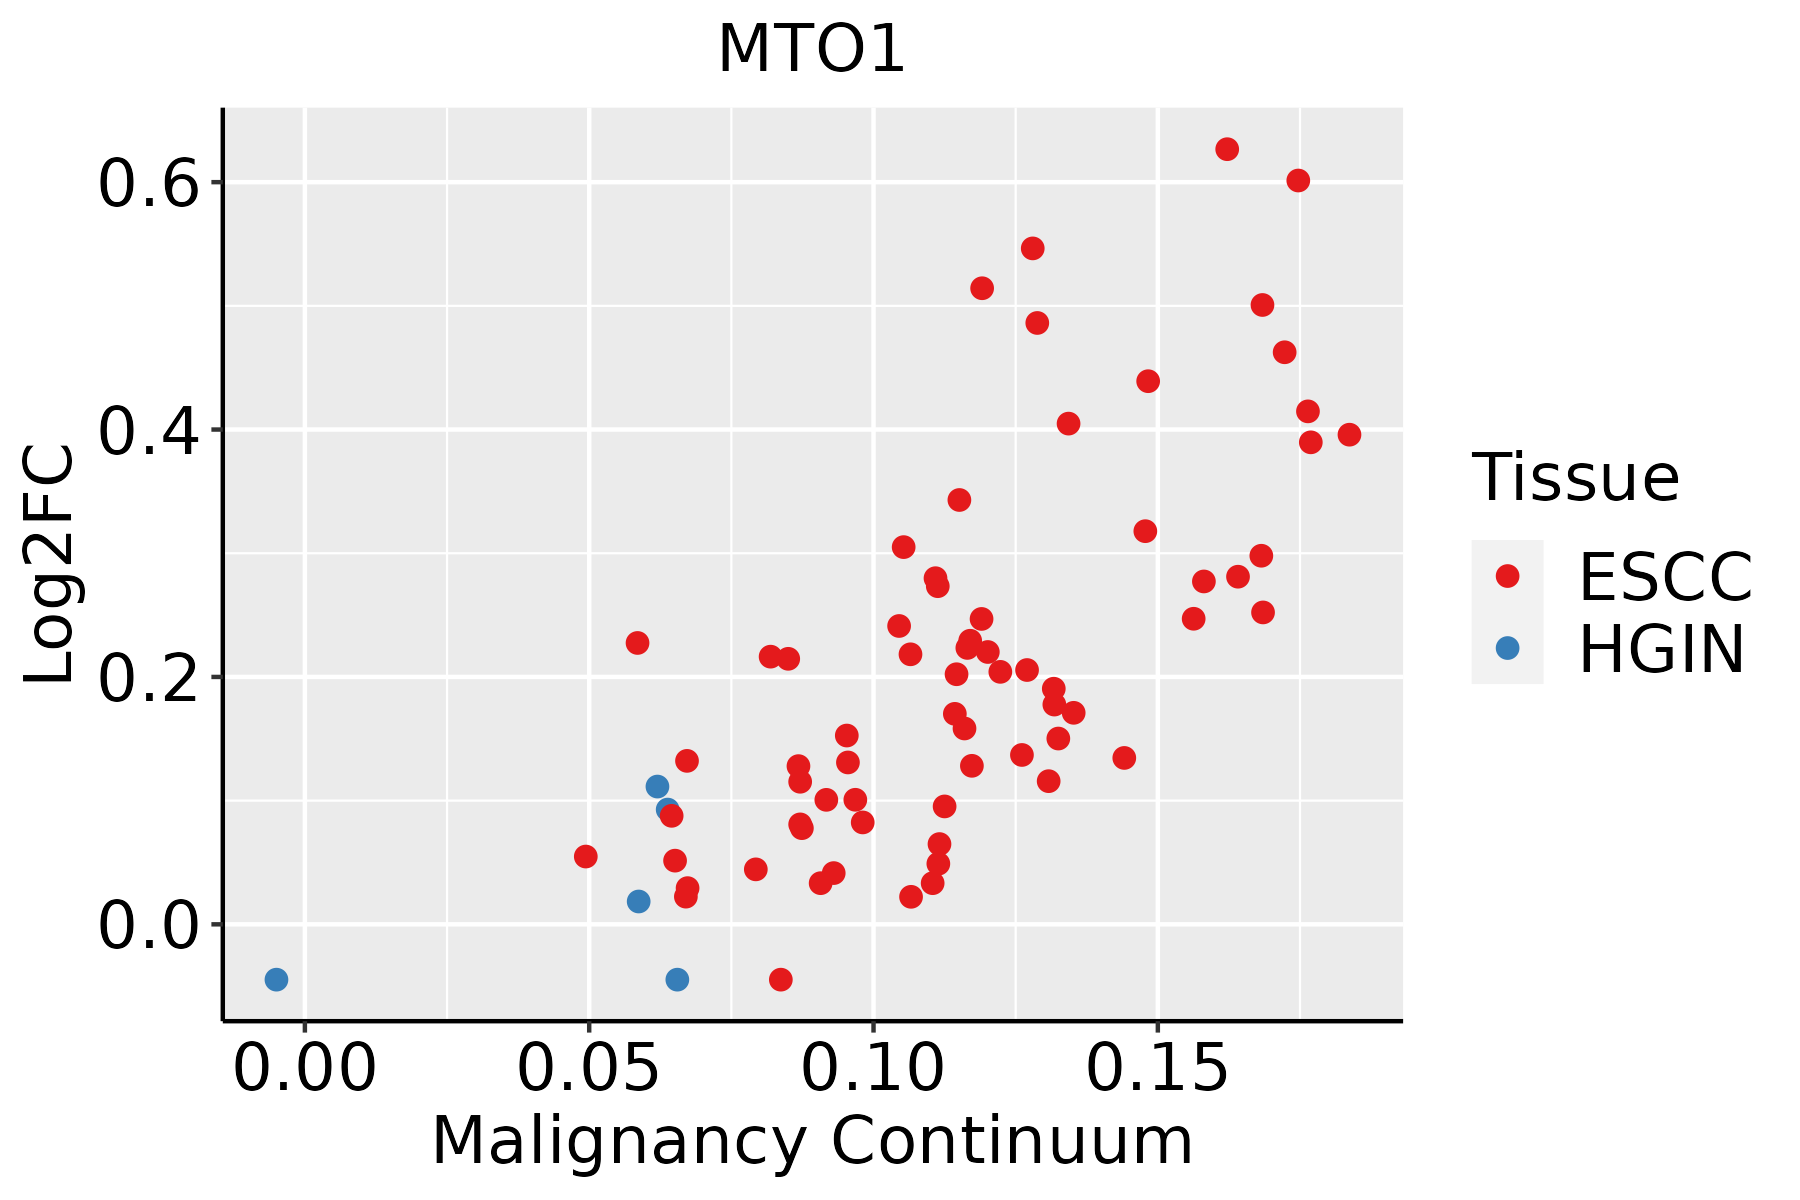 | ESCC: Esophageal squamous cell carcinoma |
| HGIN: High-grade intraepithelial neoplasias | ||
| LGIN: Low-grade intraepithelial neoplasias |
| ∗log2FC in expression of this searched gene in stem-like cells from each diseased tissue sample relative to stem-like cells in normal samples in each tissue plotted against the malignancy continuum. Samples are colored based on if they are from different disease stage. |
Top |
Malignant transformation related pathway analysis |
| Find out the enriched GO biological processes and KEGG pathways involved in transition from healthy to precancer to cancer |
| Tissue | Disease Stage | Enriched GO biological Processes |
| Colorectum | CRC |  |
| Stomach | GC |  |
| Stomach | CAG with IM |  |
| Stomach | CSG |  |
| Stomach | CAG |  |
| ∗Top 15 enriched GO BP terms are showed in the bar plot of each disease state in each tissue. Each row represents a significant GO biological process which is colored according to the -log10(p.adjust). |
| Page: 1 2 3 4 5 6 7 8 9 |
| GO ID | Tissue | Disease Stage | Description | Gene Ratio | Bg Ratio | pvalue | p.adjust | Count |
| GO:003447015 | Esophagus | ESCC | ncRNA processing | 300/8552 | 395/18723 | 3.09e-35 | 3.26e-32 | 300 |
| GO:003466012 | Esophagus | ESCC | ncRNA metabolic process | 346/8552 | 485/18723 | 4.35e-31 | 2.51e-28 | 346 |
| GO:014005313 | Esophagus | ESCC | mitochondrial gene expression | 93/8552 | 108/18723 | 1.96e-18 | 2.03e-16 | 93 |
| GO:00434143 | Esophagus | ESCC | macromolecule methylation | 199/8552 | 316/18723 | 3.44e-10 | 9.57e-09 | 199 |
| GO:00080333 | Esophagus | ESCC | tRNA processing | 92/8552 | 127/18723 | 7.83e-10 | 1.93e-08 | 92 |
| GO:00063992 | Esophagus | ESCC | tRNA metabolic process | 122/8552 | 179/18723 | 9.03e-10 | 2.19e-08 | 122 |
| GO:00322592 | Esophagus | ESCC | methylation | 222/8552 | 364/18723 | 2.26e-09 | 5.09e-08 | 222 |
| GO:00094512 | Esophagus | ESCC | RNA modification | 114/8552 | 167/18723 | 2.76e-09 | 6.04e-08 | 114 |
| GO:00009592 | Esophagus | ESCC | mitochondrial RNA metabolic process | 39/8552 | 49/18723 | 1.20e-06 | 1.49e-05 | 39 |
| GO:00009631 | Esophagus | ESCC | mitochondrial RNA processing | 19/8552 | 20/18723 | 3.83e-06 | 4.14e-05 | 19 |
| GO:00015101 | Esophagus | ESCC | RNA methylation | 58/8552 | 83/18723 | 6.87e-06 | 6.94e-05 | 58 |
| GO:00064002 | Esophagus | ESCC | tRNA modification | 62/8552 | 90/18723 | 7.02e-06 | 7.04e-05 | 62 |
| GO:00304881 | Esophagus | ESCC | tRNA methylation | 30/8552 | 41/18723 | 3.27e-04 | 1.93e-03 | 30 |
| GO:0090646 | Esophagus | ESCC | mitochondrial tRNA processing | 11/8552 | 12/18723 | 1.26e-03 | 6.06e-03 | 11 |
| Page: 1 |
| Pathway ID | Tissue | Disease Stage | Description | Gene Ratio | Bg Ratio | pvalue | p.adjust | qvalue | Count |
| Page: 1 |
Top |
Cell-cell communication analysis |
| Identification of potential cell-cell interactions between two cell types and their ligand-receptor pairs for different disease states |
| Ligand | Receptor | LRpair | Pathway | Tissue | Disease Stage |
| Page: 1 |
Top |
Single-cell gene regulatory network inference analysis |
| Find out the significant the regulons (TFs) and the target genes of each regulon across cell types for different disease states |
| TF | Cell Type | Tissue | Disease Stage | Target Gene | RSS | Regulon Activity |
| ∗The dot plots of a searched regulon are shown for all cell subpopulations in each disease state of each tissue based on the regulon specific score inferred using pySCENIC and by calculating the average expression. |
| Page: 1 |
Top |
Somatic mutation of malignant transformation related genes |
| Annotation of somatic variants for genes involved in malignant transformation |
| Hugo Symbol | Variant Class | Variant Classification | dbSNP RS | HGVSc | HGVSp | HGVSp Short | SWISSPROT | BIOTYPE | SIFT | PolyPhen | Tumor Sample Barcode | Tissue | Histology | Sex | Age | Stage | Therapy Types | Drugs | Outcome |
| MTO1 | SNV | Missense_Mutation | c.14N>A | p.Arg5Gln | p.R5Q | Q9Y2Z2 | protein_coding | tolerated_low_confidence(0.21) | benign(0.015) | TCGA-A2-A0CX-01 | Breast | breast invasive carcinoma | Female | <65 | I/II | Chemotherapy | adriamycin | SD | |
| MTO1 | SNV | Missense_Mutation | c.1556N>T | p.Asp519Val | p.D519V | Q9Y2Z2 | protein_coding | deleterious(0) | probably_damaging(0.995) | TCGA-A8-A076-01 | Breast | breast invasive carcinoma | Female | >=65 | I/II | Hormone Therapy | anastrozole | SD | |
| MTO1 | SNV | Missense_Mutation | rs769091140 | c.1795G>T | p.Asp599Tyr | p.D599Y | Q9Y2Z2 | protein_coding | deleterious(0) | possibly_damaging(0.642) | TCGA-AC-A23H-01 | Breast | breast invasive carcinoma | Female | >=65 | I/II | Unknown | Unknown | PD |
| MTO1 | SNV | Missense_Mutation | rs753873871 | c.61C>T | p.Pro21Ser | p.P21S | Q9Y2Z2 | protein_coding | tolerated(0.26) | benign(0) | TCGA-AN-A046-01 | Breast | breast invasive carcinoma | Female | >=65 | I/II | Unknown | Unknown | SD |
| MTO1 | SNV | Missense_Mutation | novel | c.476T>C | p.Ile159Thr | p.I159T | Q9Y2Z2 | protein_coding | deleterious(0.01) | benign(0.087) | TCGA-AN-A046-01 | Breast | breast invasive carcinoma | Female | >=65 | I/II | Unknown | Unknown | SD |
| MTO1 | SNV | Missense_Mutation | c.1217N>A | p.Gly406Glu | p.G406E | Q9Y2Z2 | protein_coding | deleterious(0) | probably_damaging(1) | TCGA-E2-A15C-01 | Breast | breast invasive carcinoma | Female | <65 | I/II | Hormone Therapy | arimidex | SD | |
| MTO1 | SNV | Missense_Mutation | novel | c.1879A>G | p.Thr627Ala | p.T627A | Q9Y2Z2 | protein_coding | tolerated(0.48) | benign(0.005) | TCGA-GI-A2C9-01 | Breast | breast invasive carcinoma | Female | <65 | I/II | Unspecific | SD | |
| MTO1 | insertion | In_Frame_Ins | novel | c.1155_1156insTTGTTTGTTTTGAGACGGAGTTTTGCTCTTGTT | p.Leu385_Asp386insLeuPheValLeuArgArgSerPheAlaLeuVal | p.L385_D386insLFVLRRSFALV | Q9Y2Z2 | protein_coding | TCGA-B6-A0IA-01 | Breast | breast invasive carcinoma | Female | <65 | I/II | Unknown | Unknown | SD | ||
| MTO1 | deletion | In_Frame_Del | novel | c.330_353delTTATAAAGTATTAAACCGGCGTAA | p.His110_Lys118delinsGln | p.H110_K118delinsQ | Q9Y2Z2 | protein_coding | TCGA-GM-A3XL-01 | Breast | breast invasive carcinoma | Female | <65 | I/II | Chemotherapy | fluorouracil | CR | ||
| MTO1 | SNV | Missense_Mutation | c.1742G>T | p.Arg581Ile | p.R581I | Q9Y2Z2 | protein_coding | deleterious(0.01) | benign(0.062) | TCGA-IR-A3LA-01 | Cervix | cervical & endocervical cancer | Female | <65 | I/II | Chemotherapy | cisplatin | CR |
| Page: 1 2 3 4 5 6 |
Top |
Related drugs of malignant transformation related genes |
| Identification of chemicals and drugs interact with genes involved in malignant transfromation |
| (DGIdb 4.0) |
| Entrez ID | Symbol | Category | Interaction Types | Drug Claim Name | Drug Name | PMIDs |
| Page: 1 |

Copyright 2023-Present -The University of Texas Health Science Center at Houston |