
|
|||||
|
 | |
| |
| |
| |
| |
| |
|
Gene: MEF2C |
Gene summary for MEF2C |
| Gene information | Species | Human | Gene symbol | MEF2C | Gene ID | 4208 |
| Gene name | myocyte enhancer factor 2C | |
| Gene Alias | C5DELq14.3 | |
| Cytomap | 5q14.3 | |
| Gene Type | protein-coding | GO ID | GO:0000122 | UniProtAcc | Q06413 |
Top |
Malignant transformation analysis |
| Identification of the aberrant gene expression in precancerous and cancerous lesions by comparing the gene expression of stem-like cells in diseased tissues with normal stem cells |
| Entrez ID | Symbol | Replicates | Species | Organ | Tissue | Adj P-value | Log2FC | Malignancy |
| 4208 | MEF2C | HTA11_347_2000001011 | Human | Colorectum | AD | 2.34e-10 | 5.02e-01 | -0.1954 |
| 4208 | MEF2C | A015-C-202 | Human | Colorectum | FAP | 3.65e-02 | 2.37e-01 | -0.0849 |
| 4208 | MEF2C | P8T-E | Human | Esophagus | ESCC | 2.42e-05 | 1.99e-01 | 0.0889 |
| 4208 | MEF2C | P11T-E | Human | Esophagus | ESCC | 5.93e-05 | 5.08e-01 | 0.1426 |
| 4208 | MEF2C | P19T-E | Human | Esophagus | ESCC | 1.85e-08 | 8.16e-01 | 0.1662 |
| 4208 | MEF2C | P32T-E | Human | Esophagus | ESCC | 6.30e-03 | 2.32e-01 | 0.1666 |
| 4208 | MEF2C | P37T-E | Human | Esophagus | ESCC | 1.77e-02 | 7.89e-02 | 0.1371 |
| 4208 | MEF2C | P42T-E | Human | Esophagus | ESCC | 1.37e-04 | 3.46e-01 | 0.1175 |
| 4208 | MEF2C | P76T-E | Human | Esophagus | ESCC | 4.29e-02 | 2.30e-02 | 0.1207 |
| 4208 | MEF2C | HCC1_Meng | Human | Liver | HCC | 5.19e-08 | -8.65e-03 | 0.0246 |
| 4208 | MEF2C | Pt13.a | Human | Liver | HCC | 1.12e-15 | 4.80e-01 | 0.021 |
| 4208 | MEF2C | Pt13.b | Human | Liver | HCC | 2.41e-23 | 7.06e-01 | 0.0251 |
| 4208 | MEF2C | Pt13.c | Human | Liver | HCC | 6.71e-07 | 6.15e-01 | 0.0076 |
| 4208 | MEF2C | Pt14.d | Human | Liver | HCC | 3.46e-12 | 5.02e-01 | 0.0143 |
| 4208 | MEF2C | TD9 | Human | Lung | IAC | 9.35e-04 | 5.67e-01 | 0.088 |
| 4208 | MEF2C | RNA-P10T2-P10T2-2 | Human | Lung | AAH | 5.32e-04 | 8.58e-01 | -0.1406 |
| 4208 | MEF2C | RNA-P10T2-P10T2-4 | Human | Lung | AAH | 2.12e-03 | 6.99e-01 | -0.138 |
| 4208 | MEF2C | RNA-P17T-P17T-8 | Human | Lung | IAC | 3.66e-03 | 1.52e-01 | 0.3329 |
| 4208 | MEF2C | RNA-P25T1-P25T1-1 | Human | Lung | AIS | 8.30e-10 | 6.44e-01 | -0.2116 |
| 4208 | MEF2C | RNA-P25T1-P25T1-2 | Human | Lung | AIS | 8.61e-03 | 4.74e-01 | -0.1941 |
| Page: 1 2 |
| Tissue | Expression Dynamics | Abbreviation |
| Colorectum (GSE201348) |  | FAP: Familial adenomatous polyposis |
| CRC: Colorectal cancer | ||
| Colorectum (HTA11) |  | AD: Adenomas |
| SER: Sessile serrated lesions | ||
| MSI-H: Microsatellite-high colorectal cancer | ||
| MSS: Microsatellite stable colorectal cancer | ||
| Esophagus | 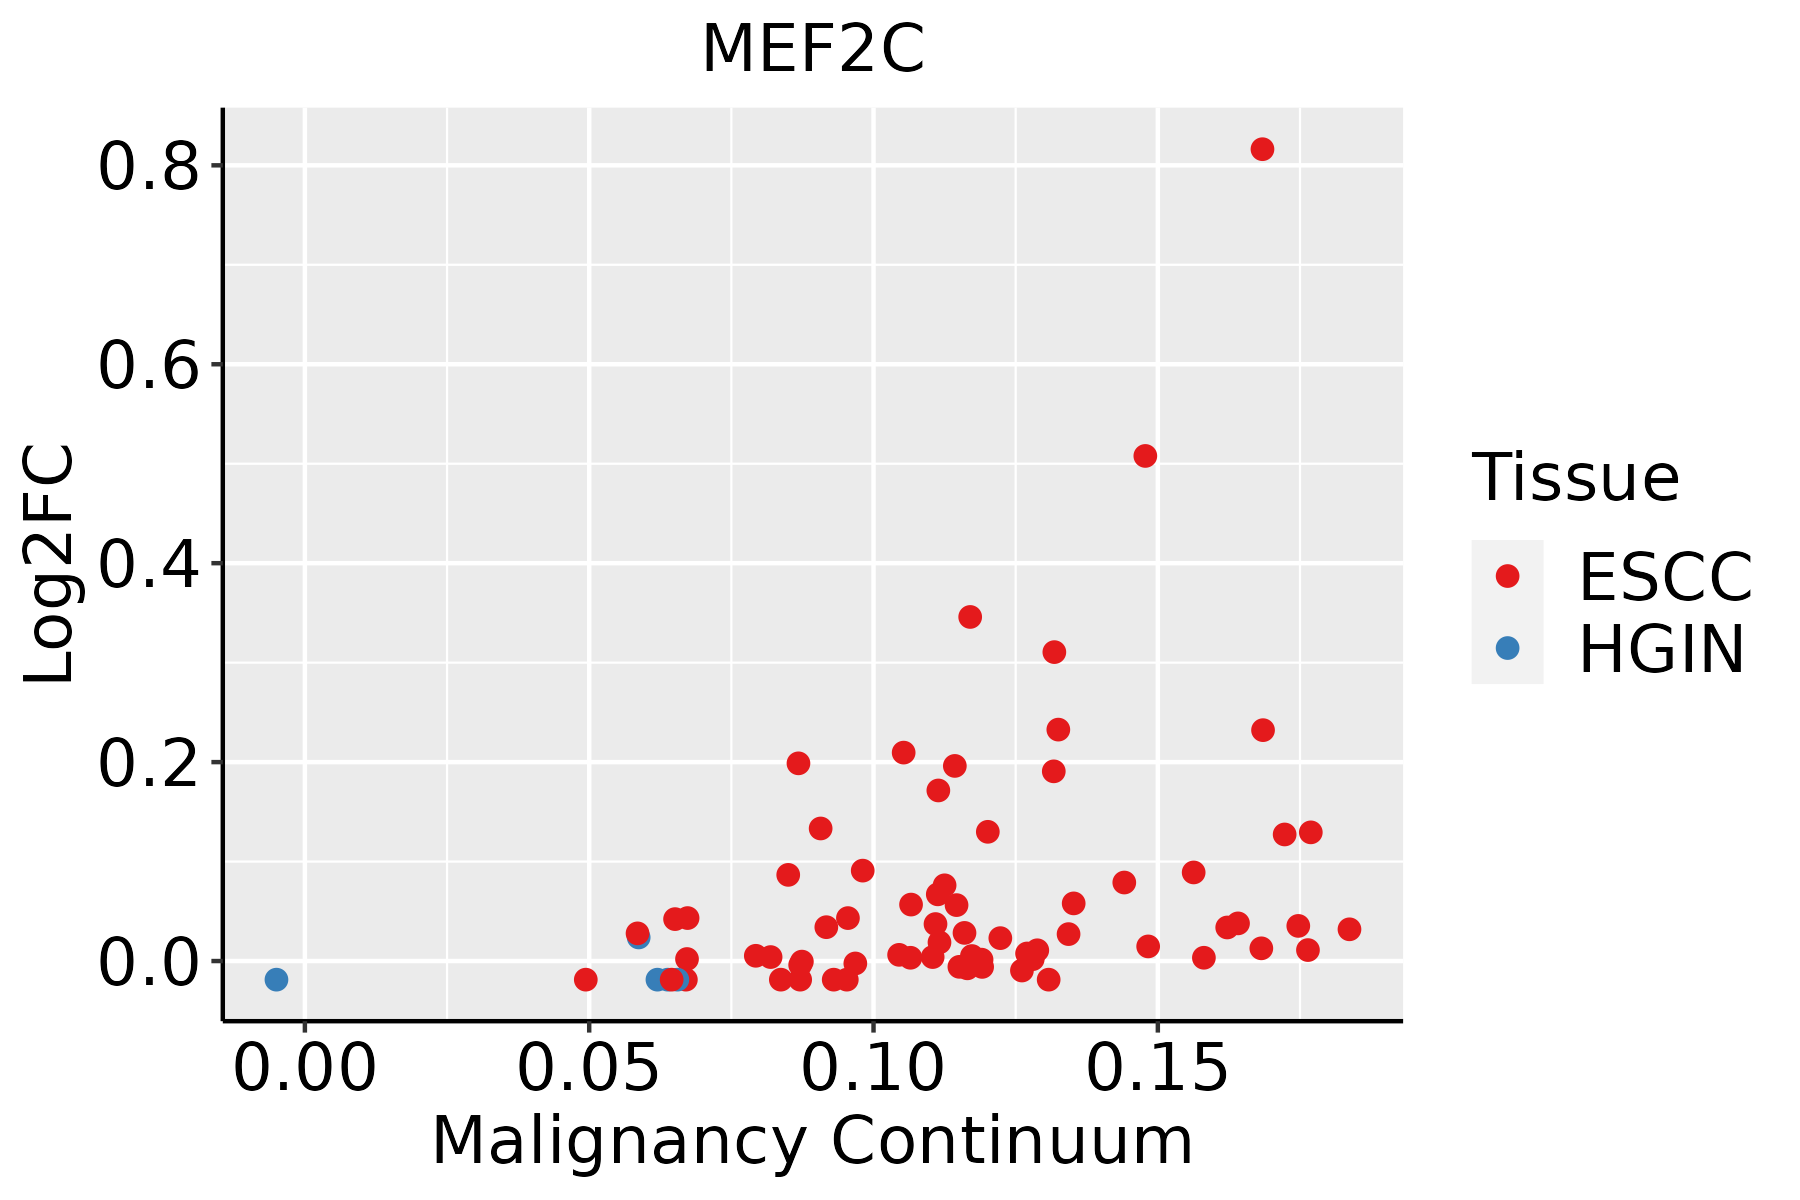 | ESCC: Esophageal squamous cell carcinoma |
| HGIN: High-grade intraepithelial neoplasias | ||
| LGIN: Low-grade intraepithelial neoplasias | ||
| Liver |  | HCC: Hepatocellular carcinoma |
| NAFLD: Non-alcoholic fatty liver disease | ||
| Lung |  | AAH: Atypical adenomatous hyperplasia |
| AIS: Adenocarcinoma in situ | ||
| IAC: Invasive lung adenocarcinoma | ||
| MIA: Minimally invasive adenocarcinoma | ||
| Thyroid | 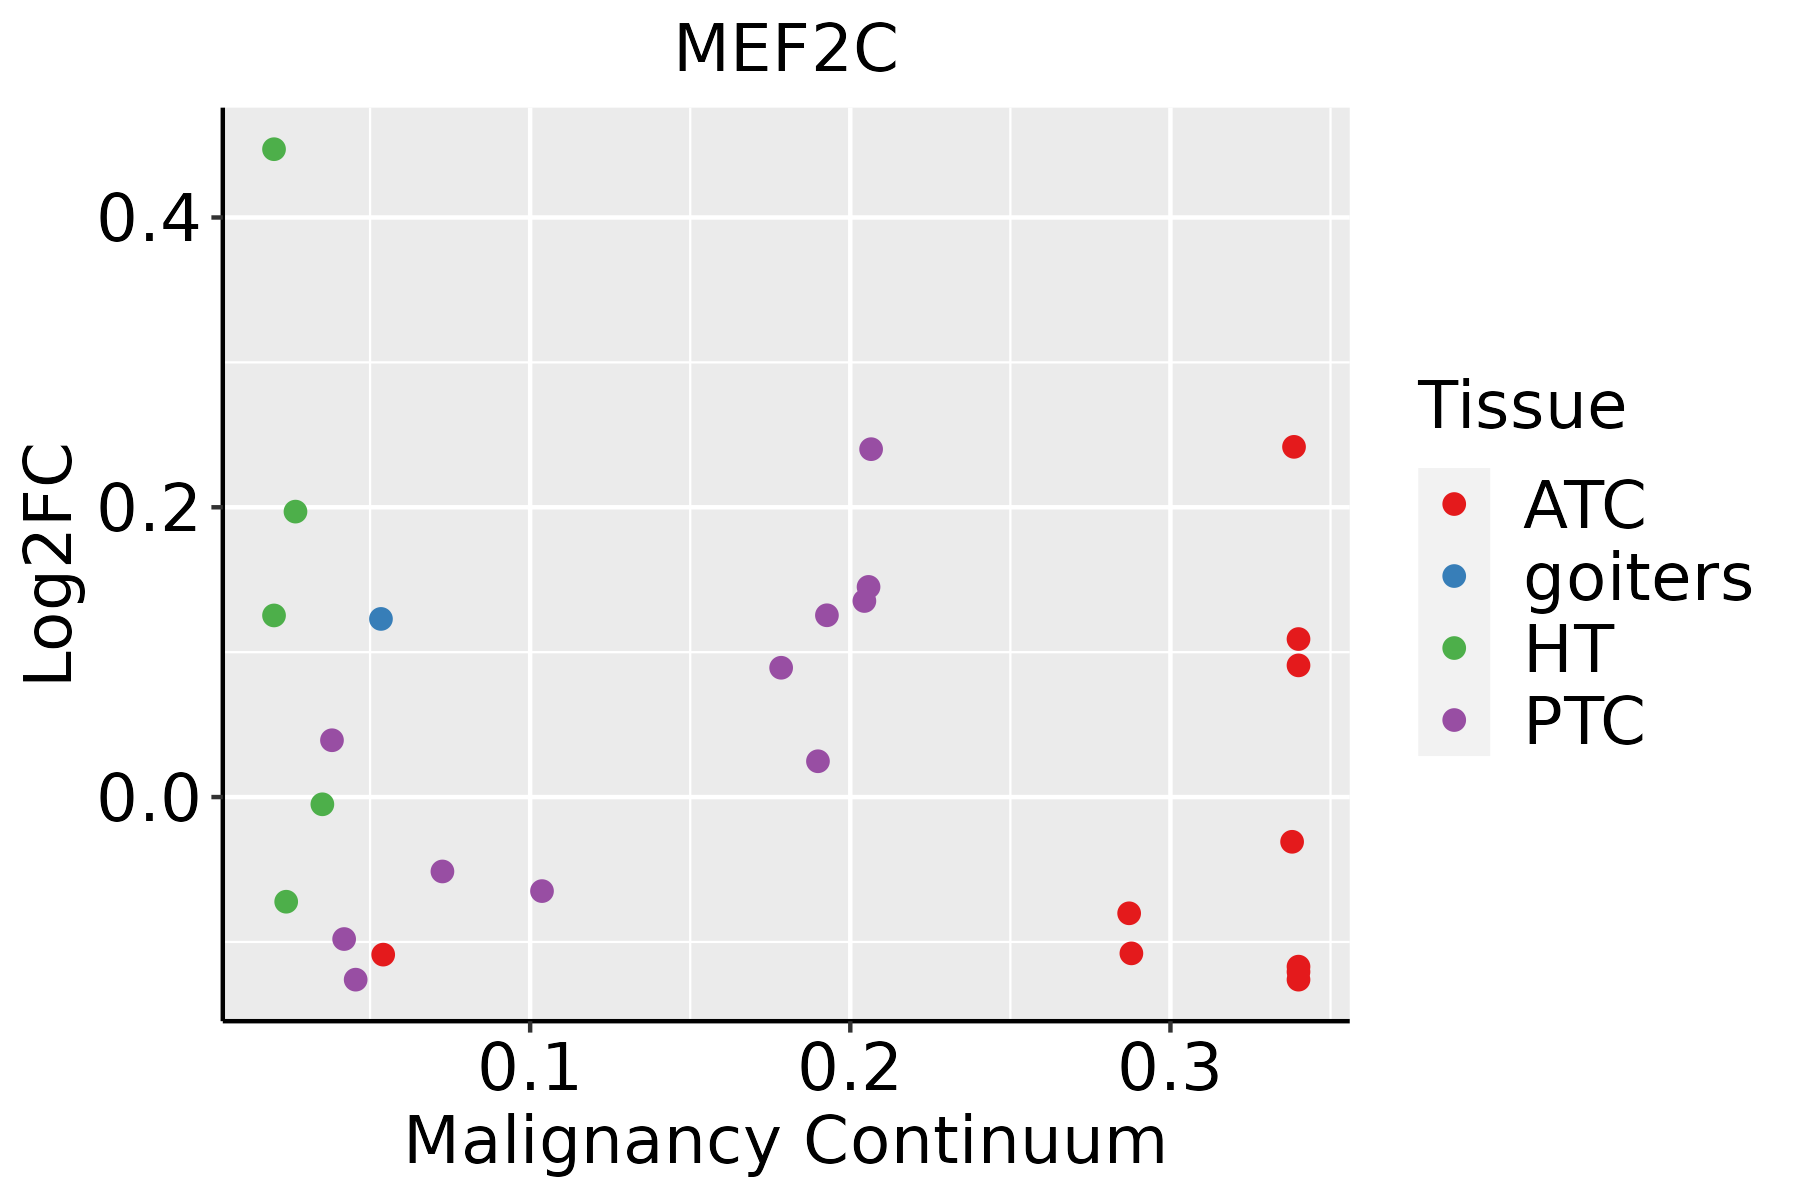 | ATC: Anaplastic thyroid cancer |
| HT: Hashimoto's thyroiditis | ||
| PTC: Papillary thyroid cancer |
| ∗log2FC in expression of this searched gene in stem-like cells from each diseased tissue sample relative to stem-like cells in normal samples in each tissue plotted against the malignancy continuum. Samples are colored based on if they are from different disease stage. |
Top |
Malignant transformation related pathway analysis |
| Find out the enriched GO biological processes and KEGG pathways involved in transition from healthy to precancer to cancer |
| Tissue | Disease Stage | Enriched GO biological Processes |
| Colorectum | CRC |  |
| Stomach | GC |  |
| Stomach | CAG with IM |  |
| Stomach | CSG |  |
| Stomach | CAG |  |
| ∗Top 15 enriched GO BP terms are showed in the bar plot of each disease state in each tissue. Each row represents a significant GO biological process which is colored according to the -log10(p.adjust). |
| Page: 1 2 3 4 5 6 7 8 9 |
| GO ID | Tissue | Disease Stage | Description | Gene Ratio | Bg Ratio | pvalue | p.adjust | Count |
| GO:0034329 | Colorectum | AD | cell junction assembly | 136/3918 | 420/18723 | 2.02e-08 | 1.15e-06 | 136 |
| GO:0070997 | Colorectum | AD | neuron death | 114/3918 | 361/18723 | 1.13e-06 | 3.72e-05 | 114 |
| GO:0030099 | Colorectum | AD | myeloid cell differentiation | 119/3918 | 381/18723 | 1.24e-06 | 4.01e-05 | 119 |
| GO:0048872 | Colorectum | AD | homeostasis of number of cells | 87/3918 | 272/18723 | 1.16e-05 | 2.61e-04 | 87 |
| GO:1901214 | Colorectum | AD | regulation of neuron death | 99/3918 | 319/18723 | 1.26e-05 | 2.76e-04 | 99 |
| GO:0016311 | Colorectum | AD | dephosphorylation | 123/3918 | 417/18723 | 1.84e-05 | 3.82e-04 | 123 |
| GO:0001667 | Colorectum | AD | ameboidal-type cell migration | 137/3918 | 475/18723 | 2.17e-05 | 4.33e-04 | 137 |
| GO:0035303 | Colorectum | AD | regulation of dephosphorylation | 46/3918 | 128/18723 | 6.20e-05 | 1.04e-03 | 46 |
| GO:0051402 | Colorectum | AD | neuron apoptotic process | 77/3918 | 246/18723 | 8.07e-05 | 1.28e-03 | 77 |
| GO:1901215 | Colorectum | AD | negative regulation of neuron death | 67/3918 | 208/18723 | 8.81e-05 | 1.35e-03 | 67 |
| GO:0090132 | Colorectum | AD | epithelium migration | 105/3918 | 360/18723 | 1.18e-04 | 1.73e-03 | 105 |
| GO:0010632 | Colorectum | AD | regulation of epithelial cell migration | 88/3918 | 292/18723 | 1.19e-04 | 1.75e-03 | 88 |
| GO:0010631 | Colorectum | AD | epithelial cell migration | 104/3918 | 357/18723 | 1.33e-04 | 1.90e-03 | 104 |
| GO:0090130 | Colorectum | AD | tissue migration | 105/3918 | 365/18723 | 2.10e-04 | 2.77e-03 | 105 |
| GO:0009410 | Colorectum | AD | response to xenobiotic stimulus | 128/3918 | 462/18723 | 2.69e-04 | 3.31e-03 | 128 |
| GO:0010038 | Colorectum | AD | response to metal ion | 106/3918 | 373/18723 | 3.22e-04 | 3.83e-03 | 106 |
| GO:0001649 | Colorectum | AD | osteoblast differentiation | 70/3918 | 229/18723 | 3.59e-04 | 4.18e-03 | 70 |
| GO:0045927 | Colorectum | AD | positive regulation of growth | 77/3918 | 259/18723 | 4.82e-04 | 5.27e-03 | 77 |
| GO:0060562 | Colorectum | AD | epithelial tube morphogenesis | 93/3918 | 325/18723 | 5.65e-04 | 6.00e-03 | 93 |
| GO:0071248 | Colorectum | AD | cellular response to metal ion | 61/3918 | 197/18723 | 5.74e-04 | 6.09e-03 | 61 |
| Page: 1 2 3 4 5 6 7 8 9 10 11 12 13 14 15 16 17 18 19 20 21 22 23 24 25 26 27 |
| Pathway ID | Tissue | Disease Stage | Description | Gene Ratio | Bg Ratio | pvalue | p.adjust | qvalue | Count |
| hsa05418 | Colorectum | AD | Fluid shear stress and atherosclerosis | 54/2092 | 139/8465 | 1.41e-04 | 1.16e-03 | 7.37e-04 | 54 |
| hsa04928 | Colorectum | AD | Parathyroid hormone synthesis, secretion and action | 38/2092 | 106/8465 | 6.60e-03 | 2.77e-02 | 1.76e-02 | 38 |
| hsa054181 | Colorectum | AD | Fluid shear stress and atherosclerosis | 54/2092 | 139/8465 | 1.41e-04 | 1.16e-03 | 7.37e-04 | 54 |
| hsa049281 | Colorectum | AD | Parathyroid hormone synthesis, secretion and action | 38/2092 | 106/8465 | 6.60e-03 | 2.77e-02 | 1.76e-02 | 38 |
| hsa054188 | Colorectum | FAP | Fluid shear stress and atherosclerosis | 45/1404 | 139/8465 | 3.05e-06 | 4.63e-05 | 2.81e-05 | 45 |
| hsa040222 | Colorectum | FAP | cGMP-PKG signaling pathway | 42/1404 | 167/8465 | 2.84e-03 | 1.27e-02 | 7.70e-03 | 42 |
| hsa049286 | Colorectum | FAP | Parathyroid hormone synthesis, secretion and action | 29/1404 | 106/8465 | 3.37e-03 | 1.44e-02 | 8.77e-03 | 29 |
| hsa04010 | Colorectum | FAP | MAPK signaling pathway | 68/1404 | 302/8465 | 4.00e-03 | 1.67e-02 | 1.02e-02 | 68 |
| hsa054189 | Colorectum | FAP | Fluid shear stress and atherosclerosis | 45/1404 | 139/8465 | 3.05e-06 | 4.63e-05 | 2.81e-05 | 45 |
| hsa040223 | Colorectum | FAP | cGMP-PKG signaling pathway | 42/1404 | 167/8465 | 2.84e-03 | 1.27e-02 | 7.70e-03 | 42 |
| hsa049287 | Colorectum | FAP | Parathyroid hormone synthesis, secretion and action | 29/1404 | 106/8465 | 3.37e-03 | 1.44e-02 | 8.77e-03 | 29 |
| hsa040101 | Colorectum | FAP | MAPK signaling pathway | 68/1404 | 302/8465 | 4.00e-03 | 1.67e-02 | 1.02e-02 | 68 |
| hsa05418211 | Esophagus | ESCC | Fluid shear stress and atherosclerosis | 109/4205 | 139/8465 | 2.00e-12 | 3.72e-11 | 1.90e-11 | 109 |
| hsa052028 | Esophagus | ESCC | Transcriptional misregulation in cancer | 116/4205 | 193/8465 | 2.08e-03 | 5.95e-03 | 3.05e-03 | 116 |
| hsa0492816 | Esophagus | ESCC | Parathyroid hormone synthesis, secretion and action | 66/4205 | 106/8465 | 5.86e-03 | 1.47e-02 | 7.51e-03 | 66 |
| hsa05418310 | Esophagus | ESCC | Fluid shear stress and atherosclerosis | 109/4205 | 139/8465 | 2.00e-12 | 3.72e-11 | 1.90e-11 | 109 |
| hsa0520213 | Esophagus | ESCC | Transcriptional misregulation in cancer | 116/4205 | 193/8465 | 2.08e-03 | 5.95e-03 | 3.05e-03 | 116 |
| hsa0492817 | Esophagus | ESCC | Parathyroid hormone synthesis, secretion and action | 66/4205 | 106/8465 | 5.86e-03 | 1.47e-02 | 7.51e-03 | 66 |
| hsa0541842 | Liver | HCC | Fluid shear stress and atherosclerosis | 89/4020 | 139/8465 | 5.58e-05 | 2.88e-04 | 1.60e-04 | 89 |
| hsa0541852 | Liver | HCC | Fluid shear stress and atherosclerosis | 89/4020 | 139/8465 | 5.58e-05 | 2.88e-04 | 1.60e-04 | 89 |
| Page: 1 2 3 |
Top |
Cell-cell communication analysis |
| Identification of potential cell-cell interactions between two cell types and their ligand-receptor pairs for different disease states |
| Ligand | Receptor | LRpair | Pathway | Tissue | Disease Stage |
| Page: 1 |
Top |
Single-cell gene regulatory network inference analysis |
| Find out the significant the regulons (TFs) and the target genes of each regulon across cell types for different disease states |
| TF | Cell Type | Tissue | Disease Stage | Target Gene | RSS | Regulon Activity |
| MEF2C | MYOEPI | Breast | ADJ | HLA-DPA1,HLA-DPB1,C1QB, etc. | 6.19e-01 |  |
| MEF2C | STM | Breast | DCIS | HLA-DPA1,HLA-DPB1,C1QB, etc. | 2.21e-01 |  |
| MEF2C | MYOEPI | Breast | Precancer | HLA-DPA1,HLA-DPB1,C1QB, etc. | 5.91e-01 |  |
| MEF2C | CD8TCM | Breast | ADJ | CD74,HLA-DRA,IL32, etc. | 4.64e-01 | |
| MEF2C | KER | Cervix | Healthy | CYBA,AIF1,MZB1, etc. | 2.70e-01 |  |
| MEF2C | STM | Cervix | N_HPV | HLA-DPA1,SAMHD1,CD74, etc. | 4.38e-01 |  |
| MEF2C | BN | Cervix | CC | POU2F2,BLNK,PLCG2, etc. | 1.08e-01 |  |
| MEF2C | BN | Cervix | HSIL_HPV | POU2F2,BLNK,PLCG2, etc. | 1.11e-01 |  |
| MEF2C | BN | Cervix | N_HPV | POU2F2,BLNK,PLCG2, etc. | 1.13e-01 | |
| MEF2C | ABS | Colorectum | ADJ | SELENBP1,SLC26A2,LINC01687, etc. | 3.28e-01 |  |
| ∗The dot plots of a searched regulon are shown for all cell subpopulations in each disease state of each tissue based on the regulon specific score inferred using pySCENIC and by calculating the average expression. |
| Page: 1 2 3 4 5 6 7 8 9 10 |
Top |
Somatic mutation of malignant transformation related genes |
| Annotation of somatic variants for genes involved in malignant transformation |
| Hugo Symbol | Variant Class | Variant Classification | dbSNP RS | HGVSc | HGVSp | HGVSp Short | SWISSPROT | BIOTYPE | SIFT | PolyPhen | Tumor Sample Barcode | Tissue | Histology | Sex | Age | Stage | Therapy Types | Drugs | Outcome |
| MEF2C | SNV | Missense_Mutation | novel | c.464N>T | p.Pro155Leu | p.P155L | Q06413 | protein_coding | deleterious(0.05) | probably_damaging(0.948) | TCGA-BH-A0HF-01 | Breast | breast invasive carcinoma | Female | >=65 | I/II | Hormone Therapy | arimidex | SD |
| MEF2C | SNV | Missense_Mutation | c.221N>T | p.Glu74Val | p.E74V | Q06413 | protein_coding | deleterious(0) | probably_damaging(0.996) | TCGA-E9-A22E-01 | Breast | breast invasive carcinoma | Female | <65 | III/IV | Chemotherapy | cyclophosphane | SD | |
| MEF2C | insertion | Nonsense_Mutation | novel | c.1183_1184insTCCATGGAACATGAAAGAATAACATTTATG | p.Thr395delinsIleHisGlyThrTerLysAsnAsnIleTyrAla | p.T395delinsIHGT*KNNIYA | Q06413 | protein_coding | TCGA-BH-A0B1-01 | Breast | breast invasive carcinoma | Female | >=65 | I/II | Chemotherapy | adriamycin | SD | ||
| MEF2C | SNV | Missense_Mutation | novel | c.527G>T | p.Ser176Ile | p.S176I | Q06413 | protein_coding | deleterious(0) | possibly_damaging(0.872) | TCGA-2W-A8YY-01 | Cervix | cervical & endocervical cancer | Female | <65 | I/II | Chemotherapy | cisplatin | CR |
| MEF2C | SNV | Missense_Mutation | c.188N>G | p.Asp63Gly | p.D63G | Q06413 | protein_coding | deleterious(0) | probably_damaging(1) | TCGA-FU-A3HZ-01 | Cervix | cervical & endocervical cancer | Female | <65 | I/II | Chemotherapy | cisplatin | CR | |
| MEF2C | SNV | Missense_Mutation | c.806N>A | p.Arg269His | p.R269H | Q06413 | protein_coding | tolerated(0.06) | possibly_damaging(0.479) | TCGA-VS-A9V4-01 | Cervix | cervical & endocervical cancer | Female | <65 | I/II | Chemotherapy | cisplatin | PD | |
| MEF2C | SNV | Missense_Mutation | novel | c.1348C>T | p.Arg450Trp | p.R450W | Q06413 | protein_coding | deleterious(0.02) | probably_damaging(0.972) | TCGA-AA-3845-01 | Colorectum | colon adenocarcinoma | Female | >=65 | I/II | Unknown | Unknown | PD |
| MEF2C | SNV | Missense_Mutation | c.209C>T | p.Thr70Met | p.T70M | Q06413 | protein_coding | deleterious(0) | probably_damaging(0.998) | TCGA-AA-3864-01 | Colorectum | colon adenocarcinoma | Male | >=65 | I/II | Unknown | Unknown | SD | |
| MEF2C | SNV | Missense_Mutation | c.713G>A | p.Arg238Gln | p.R238Q | Q06413 | protein_coding | tolerated(0.06) | probably_damaging(0.95) | TCGA-AA-3977-01 | Colorectum | colon adenocarcinoma | Male | >=65 | I/II | Unknown | Unknown | SD | |
| MEF2C | SNV | Missense_Mutation | novel | c.473N>G | p.Asn158Ser | p.N158S | Q06413 | protein_coding | tolerated(0.17) | benign(0.005) | TCGA-AA-3984-01 | Colorectum | colon adenocarcinoma | Female | <65 | I/II | Unknown | Unknown | SD |
| Page: 1 2 3 4 5 6 7 8 9 |
Top |
Related drugs of malignant transformation related genes |
| Identification of chemicals and drugs interact with genes involved in malignant transfromation |
| (DGIdb 4.0) |
| Entrez ID | Symbol | Category | Interaction Types | Drug Claim Name | Drug Name | PMIDs |
| Page: 1 |

Copyright 2023-Present -The University of Texas Health Science Center at Houston |