
|
|||||
|
 | |
| |
| |
| |
| |
| |
|
Gene: MAN2B2 |
Gene summary for MAN2B2 |
| Gene information | Species | Human | Gene symbol | MAN2B2 | Gene ID | 23324 |
| Gene name | mannosidase alpha class 2B member 2 | |
| Gene Alias | MAN2B2 | |
| Cytomap | 4p16.1 | |
| Gene Type | protein-coding | GO ID | GO:0005975 | UniProtAcc | B7Z754 |
Top |
Malignant transformation analysis |
| Identification of the aberrant gene expression in precancerous and cancerous lesions by comparing the gene expression of stem-like cells in diseased tissues with normal stem cells |
| Entrez ID | Symbol | Replicates | Species | Organ | Tissue | Adj P-value | Log2FC | Malignancy |
| 23324 | MAN2B2 | HTA11_3410_2000001011 | Human | Colorectum | AD | 5.38e-43 | 8.95e-01 | 0.0155 |
| 23324 | MAN2B2 | HTA11_2487_2000001011 | Human | Colorectum | SER | 1.91e-29 | 9.31e-01 | -0.1808 |
| 23324 | MAN2B2 | HTA11_2951_2000001011 | Human | Colorectum | AD | 2.80e-10 | 9.09e-01 | 0.0216 |
| 23324 | MAN2B2 | HTA11_1938_2000001011 | Human | Colorectum | AD | 1.86e-39 | 1.56e+00 | -0.0811 |
| 23324 | MAN2B2 | HTA11_78_2000001011 | Human | Colorectum | AD | 1.79e-07 | 4.05e-01 | -0.1088 |
| 23324 | MAN2B2 | HTA11_347_2000001011 | Human | Colorectum | AD | 1.07e-34 | 8.50e-01 | -0.1954 |
| 23324 | MAN2B2 | HTA11_411_2000001011 | Human | Colorectum | SER | 3.97e-16 | 1.35e+00 | -0.2602 |
| 23324 | MAN2B2 | HTA11_2112_2000001011 | Human | Colorectum | SER | 2.41e-17 | 1.47e+00 | -0.2196 |
| 23324 | MAN2B2 | HTA11_3361_2000001011 | Human | Colorectum | AD | 3.77e-27 | 9.58e-01 | -0.1207 |
| 23324 | MAN2B2 | HTA11_83_2000001011 | Human | Colorectum | SER | 8.63e-35 | 1.36e+00 | -0.1526 |
| 23324 | MAN2B2 | HTA11_696_2000001011 | Human | Colorectum | AD | 3.51e-94 | 1.66e+00 | -0.1464 |
| 23324 | MAN2B2 | HTA11_866_2000001011 | Human | Colorectum | AD | 9.19e-42 | 9.01e-01 | -0.1001 |
| 23324 | MAN2B2 | HTA11_1391_2000001011 | Human | Colorectum | AD | 1.76e-54 | 1.40e+00 | -0.059 |
| 23324 | MAN2B2 | HTA11_2992_2000001011 | Human | Colorectum | SER | 8.04e-23 | 1.13e+00 | -0.1706 |
| 23324 | MAN2B2 | HTA11_5212_2000001011 | Human | Colorectum | AD | 3.44e-25 | 1.30e+00 | -0.2061 |
| 23324 | MAN2B2 | HTA11_5216_2000001011 | Human | Colorectum | SER | 3.59e-25 | 1.44e+00 | -0.1462 |
| 23324 | MAN2B2 | HTA11_546_2000001011 | Human | Colorectum | AD | 1.41e-15 | 7.96e-01 | -0.0842 |
| 23324 | MAN2B2 | HTA11_9341_2000001011 | Human | Colorectum | SER | 6.47e-03 | 6.44e-01 | -0.00410000000000005 |
| 23324 | MAN2B2 | HTA11_7862_2000001011 | Human | Colorectum | AD | 1.24e-07 | 4.82e-01 | -0.0179 |
| 23324 | MAN2B2 | HTA11_866_3004761011 | Human | Colorectum | AD | 2.25e-15 | 5.37e-01 | 0.096 |
| Page: 1 2 3 4 5 6 |
| Tissue | Expression Dynamics | Abbreviation |
| Colorectum (GSE201348) |  | FAP: Familial adenomatous polyposis |
| CRC: Colorectal cancer | ||
| Colorectum (HTA11) |  | AD: Adenomas |
| SER: Sessile serrated lesions | ||
| MSI-H: Microsatellite-high colorectal cancer | ||
| MSS: Microsatellite stable colorectal cancer | ||
| Esophagus | 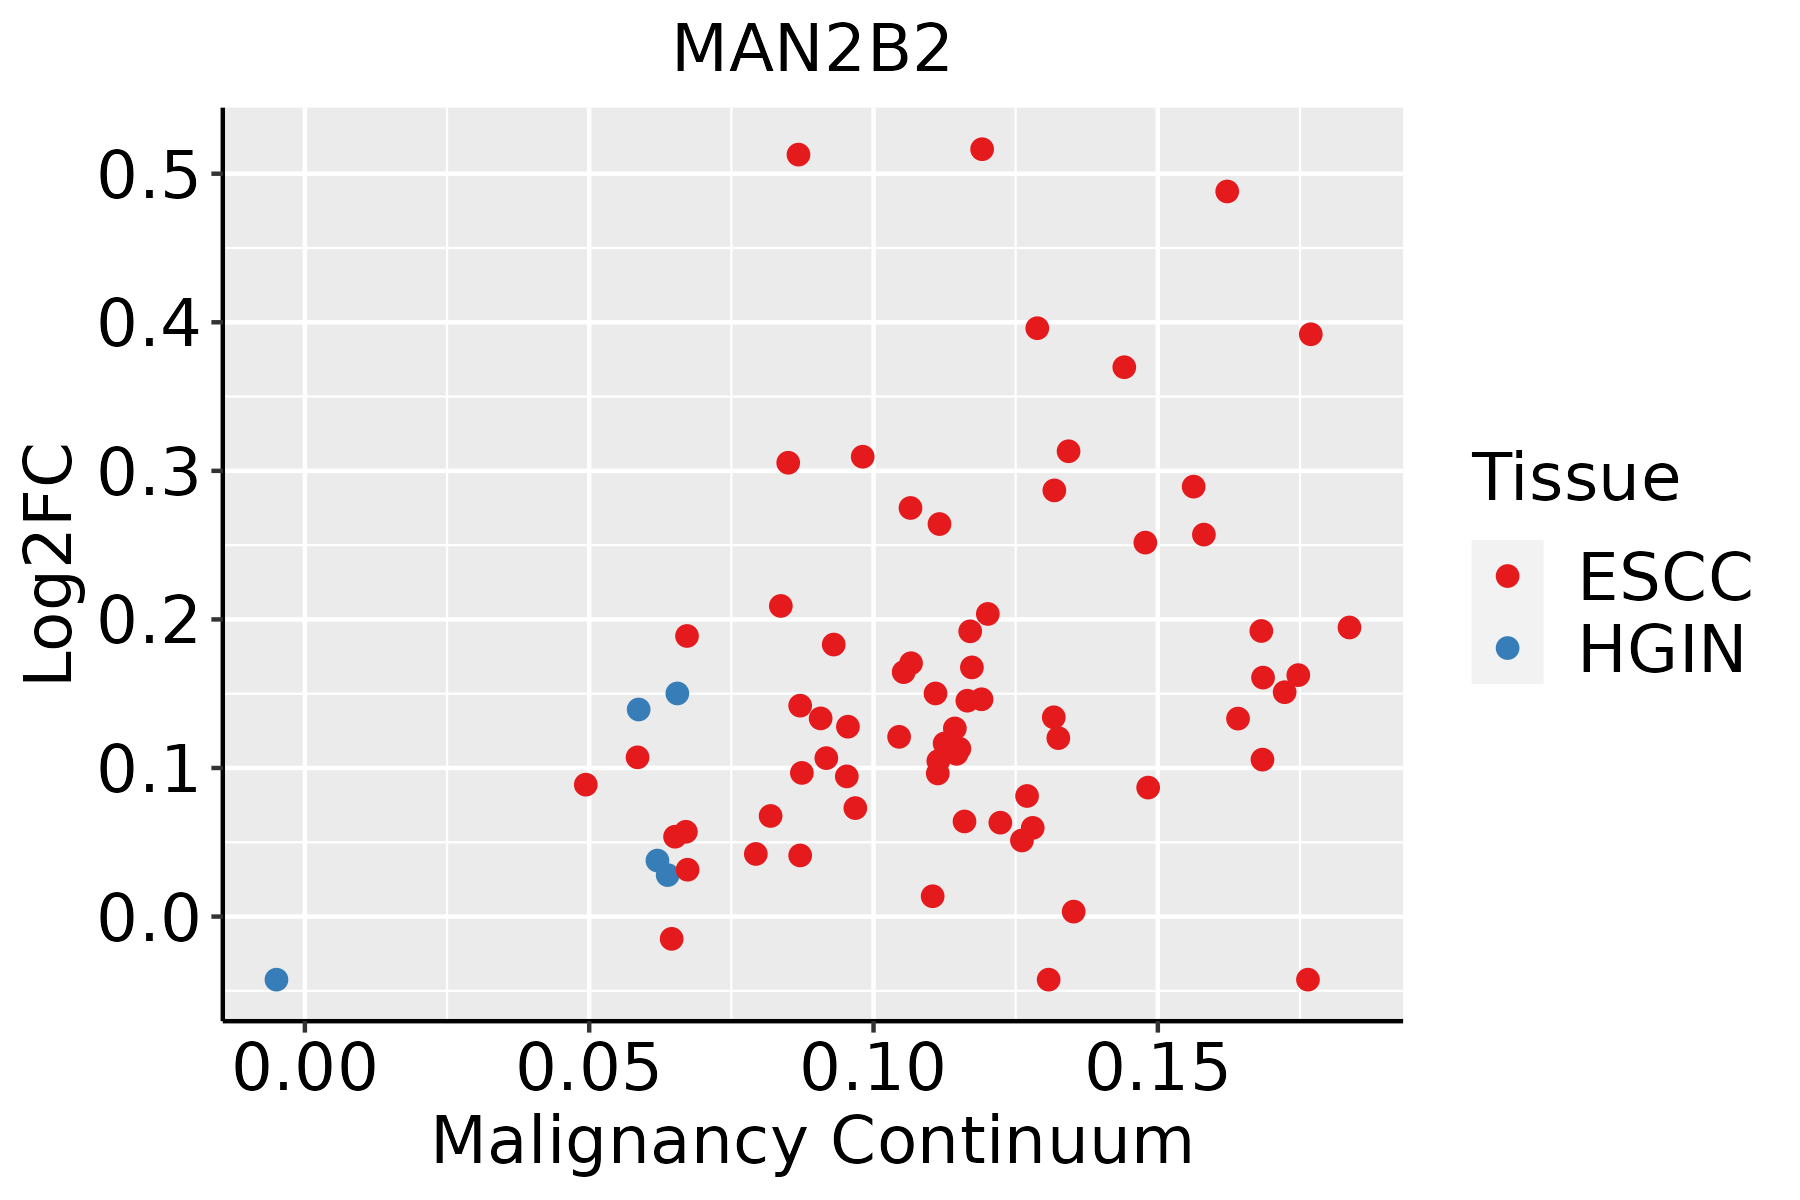 | ESCC: Esophageal squamous cell carcinoma |
| HGIN: High-grade intraepithelial neoplasias | ||
| LGIN: Low-grade intraepithelial neoplasias | ||
| Liver | 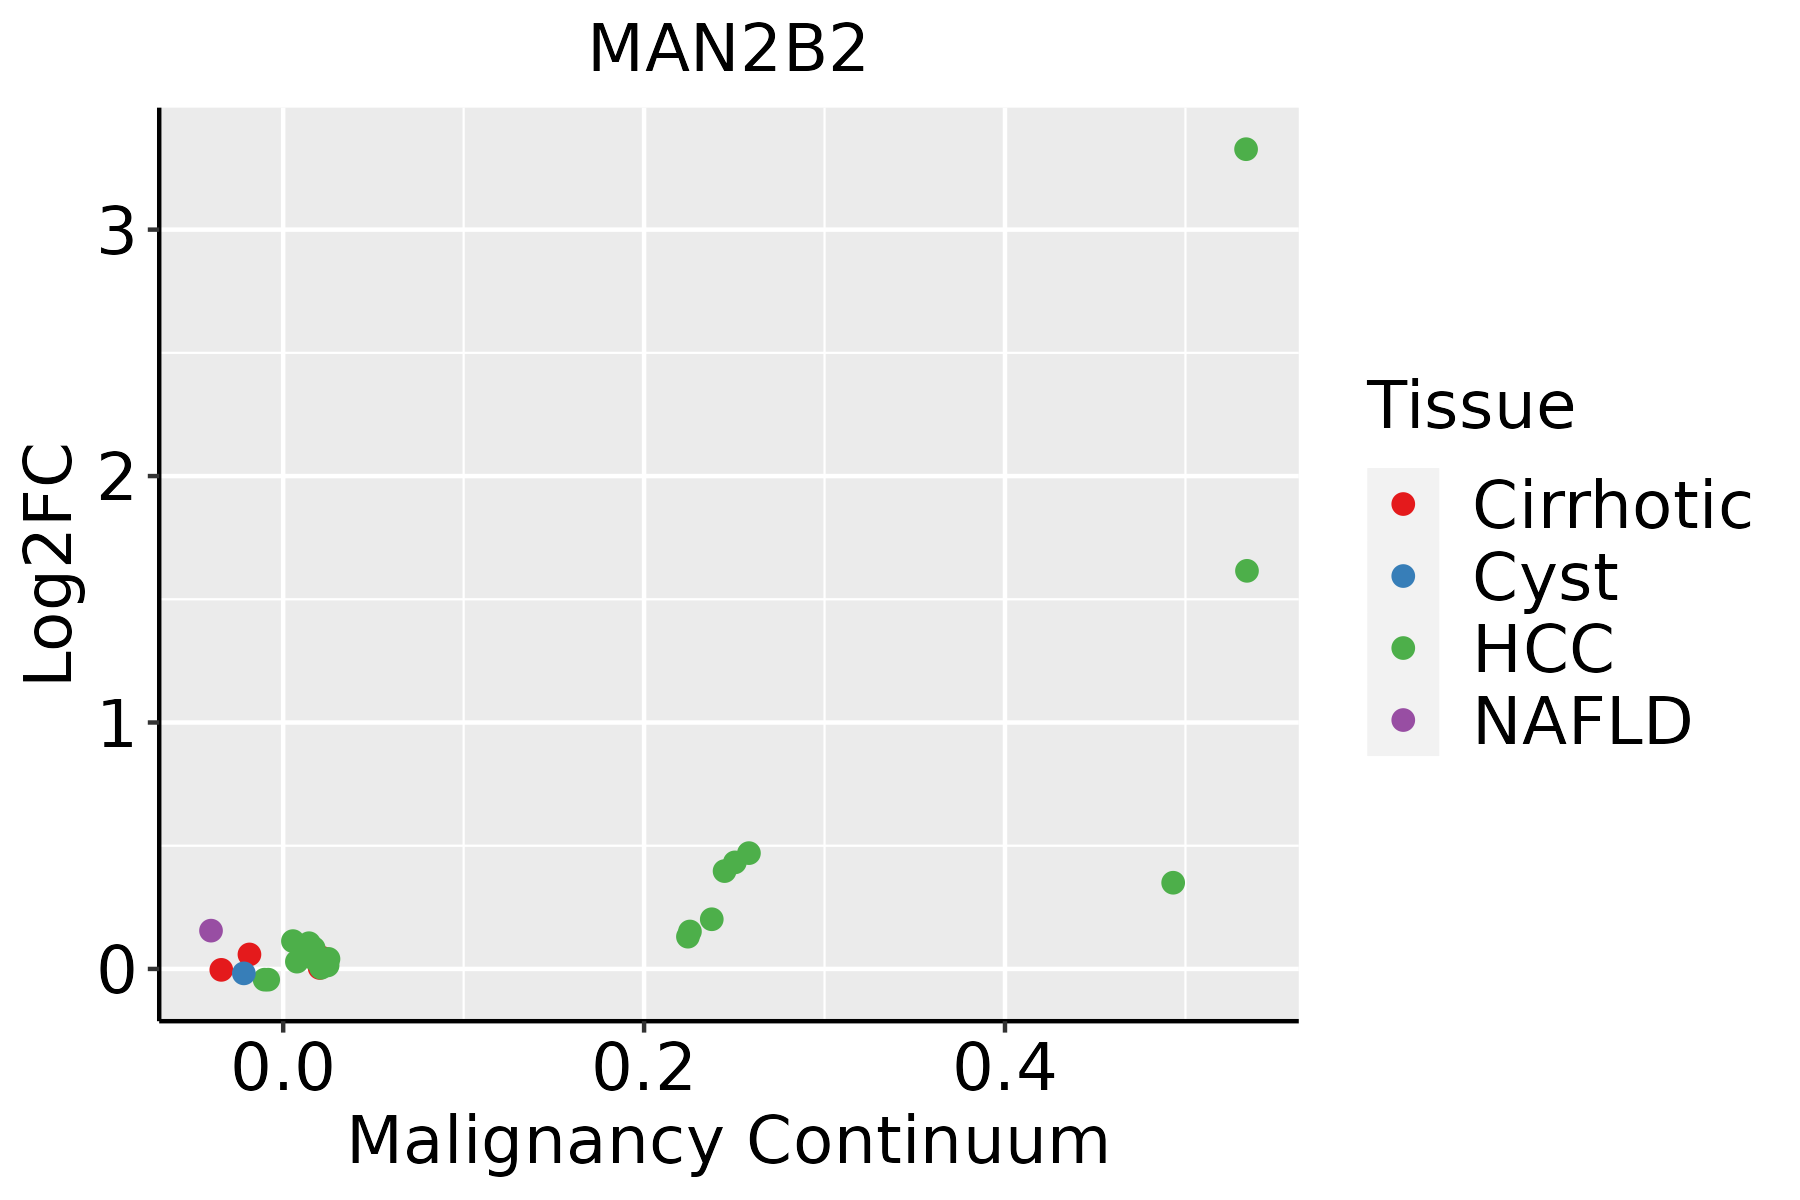 | HCC: Hepatocellular carcinoma |
| NAFLD: Non-alcoholic fatty liver disease | ||
| Thyroid | 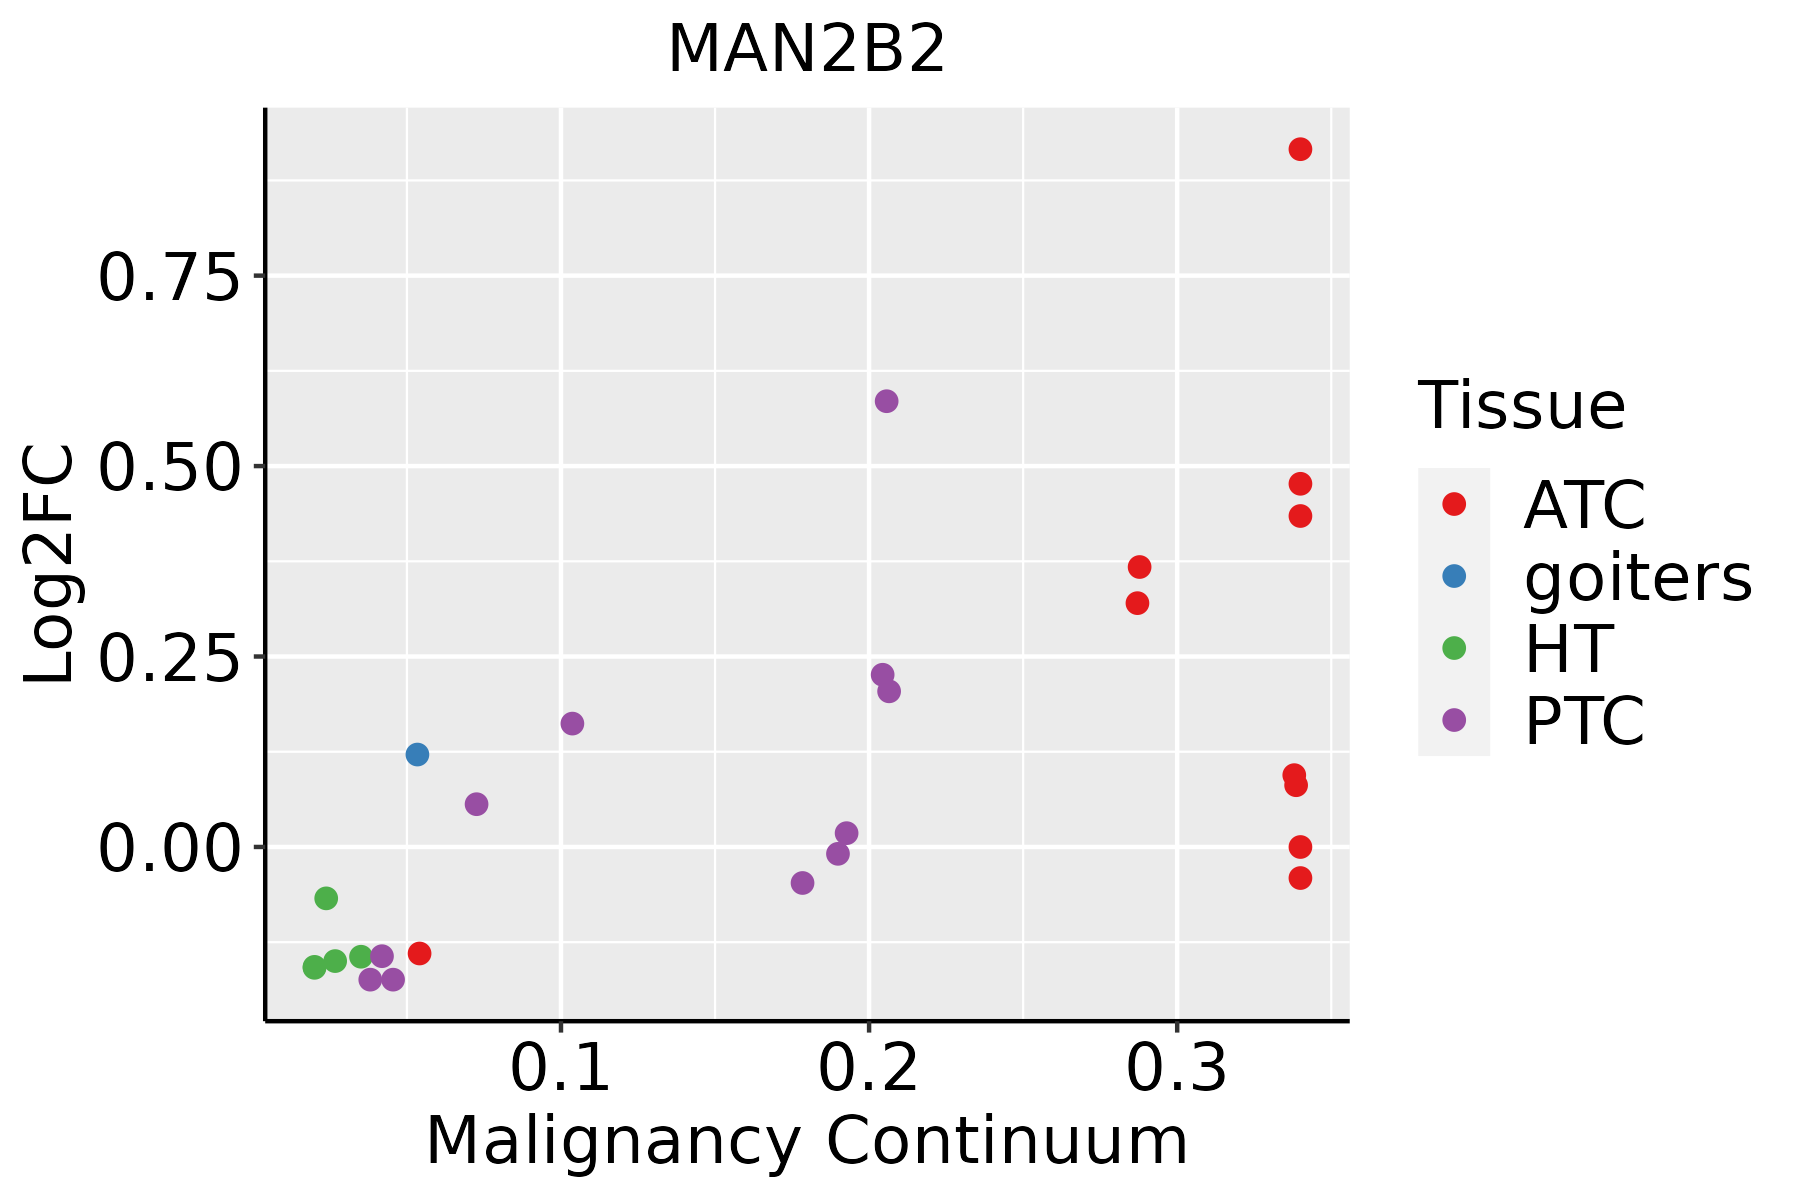 | ATC: Anaplastic thyroid cancer |
| HT: Hashimoto's thyroiditis | ||
| PTC: Papillary thyroid cancer |
| ∗log2FC in expression of this searched gene in stem-like cells from each diseased tissue sample relative to stem-like cells in normal samples in each tissue plotted against the malignancy continuum. Samples are colored based on if they are from different disease stage. |
Top |
Malignant transformation related pathway analysis |
| Find out the enriched GO biological processes and KEGG pathways involved in transition from healthy to precancer to cancer |
| Tissue | Disease Stage | Enriched GO biological Processes |
| Colorectum | CRC |  |
| Stomach | GC |  |
| Stomach | CAG with IM |  |
| Stomach | CSG |  |
| Stomach | CAG |  |
| ∗Top 15 enriched GO BP terms are showed in the bar plot of each disease state in each tissue. Each row represents a significant GO biological process which is colored according to the -log10(p.adjust). |
| Page: 1 2 3 4 5 6 7 8 9 |
| GO ID | Tissue | Disease Stage | Description | Gene Ratio | Bg Ratio | pvalue | p.adjust | Count |
| GO:0019318 | Colorectum | AD | hexose metabolic process | 77/3918 | 237/18723 | 1.96e-05 | 4.01e-04 | 77 |
| GO:0005996 | Colorectum | AD | monosaccharide metabolic process | 80/3918 | 257/18723 | 7.31e-05 | 1.17e-03 | 80 |
| GO:00193181 | Colorectum | SER | hexose metabolic process | 56/2897 | 237/18723 | 6.19e-04 | 8.42e-03 | 56 |
| GO:00059961 | Colorectum | SER | monosaccharide metabolic process | 59/2897 | 257/18723 | 9.65e-04 | 1.15e-02 | 59 |
| GO:00193182 | Colorectum | MSS | hexose metabolic process | 63/3467 | 237/18723 | 1.32e-03 | 1.25e-02 | 63 |
| GO:00059962 | Colorectum | MSS | monosaccharide metabolic process | 66/3467 | 257/18723 | 2.61e-03 | 2.06e-02 | 66 |
| GO:00059969 | Esophagus | ESCC | monosaccharide metabolic process | 159/8552 | 257/18723 | 1.11e-07 | 1.81e-06 | 159 |
| GO:00193189 | Esophagus | ESCC | hexose metabolic process | 147/8552 | 237/18723 | 2.63e-07 | 3.94e-06 | 147 |
| GO:000599621 | Liver | HCC | monosaccharide metabolic process | 167/7958 | 257/18723 | 2.31e-13 | 1.25e-11 | 167 |
| GO:001931821 | Liver | HCC | hexose metabolic process | 155/7958 | 237/18723 | 7.63e-13 | 3.90e-11 | 155 |
| GO:001931810 | Thyroid | PTC | hexose metabolic process | 108/5968 | 237/18723 | 6.42e-06 | 7.65e-05 | 108 |
| GO:000599614 | Thyroid | PTC | monosaccharide metabolic process | 115/5968 | 257/18723 | 9.36e-06 | 1.05e-04 | 115 |
| GO:001931814 | Thyroid | ATC | hexose metabolic process | 111/6293 | 237/18723 | 1.51e-05 | 1.41e-04 | 111 |
| GO:000599615 | Thyroid | ATC | monosaccharide metabolic process | 118/6293 | 257/18723 | 2.56e-05 | 2.20e-04 | 118 |
| Page: 1 |
| Pathway ID | Tissue | Disease Stage | Description | Gene Ratio | Bg Ratio | pvalue | p.adjust | qvalue | Count |
| hsa00511 | Liver | HCC | Other glycan degradation | 15/4020 | 18/8465 | 1.96e-03 | 6.91e-03 | 3.84e-03 | 15 |
| hsa005111 | Liver | HCC | Other glycan degradation | 15/4020 | 18/8465 | 1.96e-03 | 6.91e-03 | 3.84e-03 | 15 |
| Page: 1 |
Top |
Cell-cell communication analysis |
| Identification of potential cell-cell interactions between two cell types and their ligand-receptor pairs for different disease states |
| Ligand | Receptor | LRpair | Pathway | Tissue | Disease Stage |
| Page: 1 |
Top |
Single-cell gene regulatory network inference analysis |
| Find out the significant the regulons (TFs) and the target genes of each regulon across cell types for different disease states |
| TF | Cell Type | Tissue | Disease Stage | Target Gene | RSS | Regulon Activity |
| ∗The dot plots of a searched regulon are shown for all cell subpopulations in each disease state of each tissue based on the regulon specific score inferred using pySCENIC and by calculating the average expression. |
| Page: 1 |
Top |
Somatic mutation of malignant transformation related genes |
| Annotation of somatic variants for genes involved in malignant transformation |
| Hugo Symbol | Variant Class | Variant Classification | dbSNP RS | HGVSc | HGVSp | HGVSp Short | SWISSPROT | BIOTYPE | SIFT | PolyPhen | Tumor Sample Barcode | Tissue | Histology | Sex | Age | Stage | Therapy Types | Drugs | Outcome |
| MAN2B2 | SNV | Missense_Mutation | c.2077N>T | p.Gly693Trp | p.G693W | Q9Y2E5 | protein_coding | deleterious(0) | probably_damaging(0.988) | TCGA-A7-A0DB-01 | Breast | breast invasive carcinoma | Female | <65 | I/II | Hormone Therapy | arimidex | SD | |
| MAN2B2 | SNV | Missense_Mutation | novel | c.2410N>A | p.Asp804Asn | p.D804N | Q9Y2E5 | protein_coding | tolerated(0.73) | benign(0.034) | TCGA-AC-A3W6-01 | Breast | breast invasive carcinoma | Female | >=65 | III/IV | Unknown | Unknown | SD |
| MAN2B2 | SNV | Missense_Mutation | novel | c.1660N>C | p.Glu554Gln | p.E554Q | Q9Y2E5 | protein_coding | tolerated(0.12) | benign(0.033) | TCGA-AC-A5XS-01 | Breast | breast invasive carcinoma | Female | >=65 | I/II | Hormone Therapy | femara | SD |
| MAN2B2 | SNV | Missense_Mutation | rs200356754 | c.2731N>T | p.Arg911Cys | p.R911C | Q9Y2E5 | protein_coding | tolerated(0.22) | benign(0.011) | TCGA-AO-A128-01 | Breast | breast invasive carcinoma | Female | <65 | I/II | Chemotherapy | doxorubicin | SD |
| MAN2B2 | SNV | Missense_Mutation | c.2446G>C | p.Val816Leu | p.V816L | Q9Y2E5 | protein_coding | deleterious(0.05) | benign(0.211) | TCGA-BH-A1FN-01 | Breast | breast invasive carcinoma | Female | <65 | I/II | Unknown | Unknown | PD | |
| MAN2B2 | SNV | Missense_Mutation | c.1650N>T | p.Glu550Asp | p.E550D | Q9Y2E5 | protein_coding | tolerated(0.5) | benign(0.007) | TCGA-BH-A5IZ-01 | Breast | breast invasive carcinoma | Female | <65 | I/II | Chemotherapy | adriamycin | CR | |
| MAN2B2 | SNV | Missense_Mutation | c.740N>G | p.Tyr247Cys | p.Y247C | Q9Y2E5 | protein_coding | deleterious(0) | probably_damaging(0.999) | TCGA-D8-A1XK-01 | Breast | breast invasive carcinoma | Female | <65 | I/II | Chemotherapy | doxorubicine+cyclophosphamide | SD | |
| MAN2B2 | SNV | Missense_Mutation | novel | c.2411A>G | p.Asp804Gly | p.D804G | Q9Y2E5 | protein_coding | tolerated(0.41) | benign(0.438) | TCGA-E2-A150-01 | Breast | breast invasive carcinoma | Female | <65 | I/II | Chemotherapy | doxorubicin | SD |
| MAN2B2 | SNV | Missense_Mutation | novel | c.485N>G | p.Leu162Arg | p.L162R | Q9Y2E5 | protein_coding | tolerated(0.06) | probably_damaging(1) | TCGA-LL-A7SZ-01 | Breast | breast invasive carcinoma | Female | <65 | I/II | Chemotherapy | adriamycin | CR |
| MAN2B2 | SNV | Missense_Mutation | novel | c.1388C>T | p.Pro463Leu | p.P463L | Q9Y2E5 | protein_coding | tolerated(0.07) | benign(0.01) | TCGA-C5-A8YR-01 | Cervix | cervical & endocervical cancer | Female | <65 | I/II | Unknown | Unknown | PD |
| Page: 1 2 3 4 5 6 7 8 9 |
Top |
Related drugs of malignant transformation related genes |
| Identification of chemicals and drugs interact with genes involved in malignant transfromation |
| (DGIdb 4.0) |
| Entrez ID | Symbol | Category | Interaction Types | Drug Claim Name | Drug Name | PMIDs |
| Page: 1 |

Copyright 2023-Present -The University of Texas Health Science Center at Houston |