
|
|||||
|
 | |
| |
| |
| |
| |
| |
|
Gene: LPAR3 |
Gene summary for LPAR3 |
| Gene information | Species | Human | Gene symbol | LPAR3 | Gene ID | 23566 |
| Gene name | lysophosphatidic acid receptor 3 | |
| Gene Alias | EDG7 | |
| Cytomap | 1p22.3 | |
| Gene Type | protein-coding | GO ID | GO:0000165 | UniProtAcc | Q9UBY5 |
Top |
Malignant transformation analysis |
| Identification of the aberrant gene expression in precancerous and cancerous lesions by comparing the gene expression of stem-like cells in diseased tissues with normal stem cells |
| Entrez ID | Symbol | Replicates | Species | Organ | Tissue | Adj P-value | Log2FC | Malignancy |
| 23566 | LPAR3 | P2T-E | Human | Esophagus | ESCC | 5.41e-12 | 1.30e-01 | 0.1177 |
| 23566 | LPAR3 | P5T-E | Human | Esophagus | ESCC | 2.52e-06 | 1.91e-01 | 0.1327 |
| 23566 | LPAR3 | P8T-E | Human | Esophagus | ESCC | 8.40e-03 | 9.43e-02 | 0.0889 |
| 23566 | LPAR3 | P9T-E | Human | Esophagus | ESCC | 9.08e-05 | 1.21e-01 | 0.1131 |
| 23566 | LPAR3 | P15T-E | Human | Esophagus | ESCC | 4.01e-04 | 1.18e-01 | 0.1149 |
| 23566 | LPAR3 | P16T-E | Human | Esophagus | ESCC | 1.28e-10 | 1.95e-01 | 0.1153 |
| 23566 | LPAR3 | P20T-E | Human | Esophagus | ESCC | 3.74e-04 | 8.02e-02 | 0.1124 |
| 23566 | LPAR3 | P21T-E | Human | Esophagus | ESCC | 1.81e-15 | 3.85e-01 | 0.1617 |
| 23566 | LPAR3 | P22T-E | Human | Esophagus | ESCC | 2.78e-03 | 5.08e-02 | 0.1236 |
| 23566 | LPAR3 | P23T-E | Human | Esophagus | ESCC | 2.13e-06 | 1.94e-01 | 0.108 |
| 23566 | LPAR3 | P26T-E | Human | Esophagus | ESCC | 1.17e-03 | 1.08e-01 | 0.1276 |
| 23566 | LPAR3 | P27T-E | Human | Esophagus | ESCC | 8.82e-04 | 1.18e-01 | 0.1055 |
| 23566 | LPAR3 | P28T-E | Human | Esophagus | ESCC | 9.76e-03 | 1.02e-01 | 0.1149 |
| 23566 | LPAR3 | P30T-E | Human | Esophagus | ESCC | 3.50e-03 | 1.81e-01 | 0.137 |
| 23566 | LPAR3 | P32T-E | Human | Esophagus | ESCC | 2.84e-10 | 3.27e-01 | 0.1666 |
| 23566 | LPAR3 | P37T-E | Human | Esophagus | ESCC | 1.30e-28 | 6.08e-01 | 0.1371 |
| 23566 | LPAR3 | P38T-E | Human | Esophagus | ESCC | 1.60e-04 | 2.00e-01 | 0.127 |
| 23566 | LPAR3 | P39T-E | Human | Esophagus | ESCC | 1.26e-04 | 6.89e-02 | 0.0894 |
| 23566 | LPAR3 | P44T-E | Human | Esophagus | ESCC | 3.09e-03 | 1.22e-01 | 0.1096 |
| 23566 | LPAR3 | P48T-E | Human | Esophagus | ESCC | 4.70e-07 | 8.70e-02 | 0.0959 |
| Page: 1 2 3 |
| Tissue | Expression Dynamics | Abbreviation |
| Esophagus | 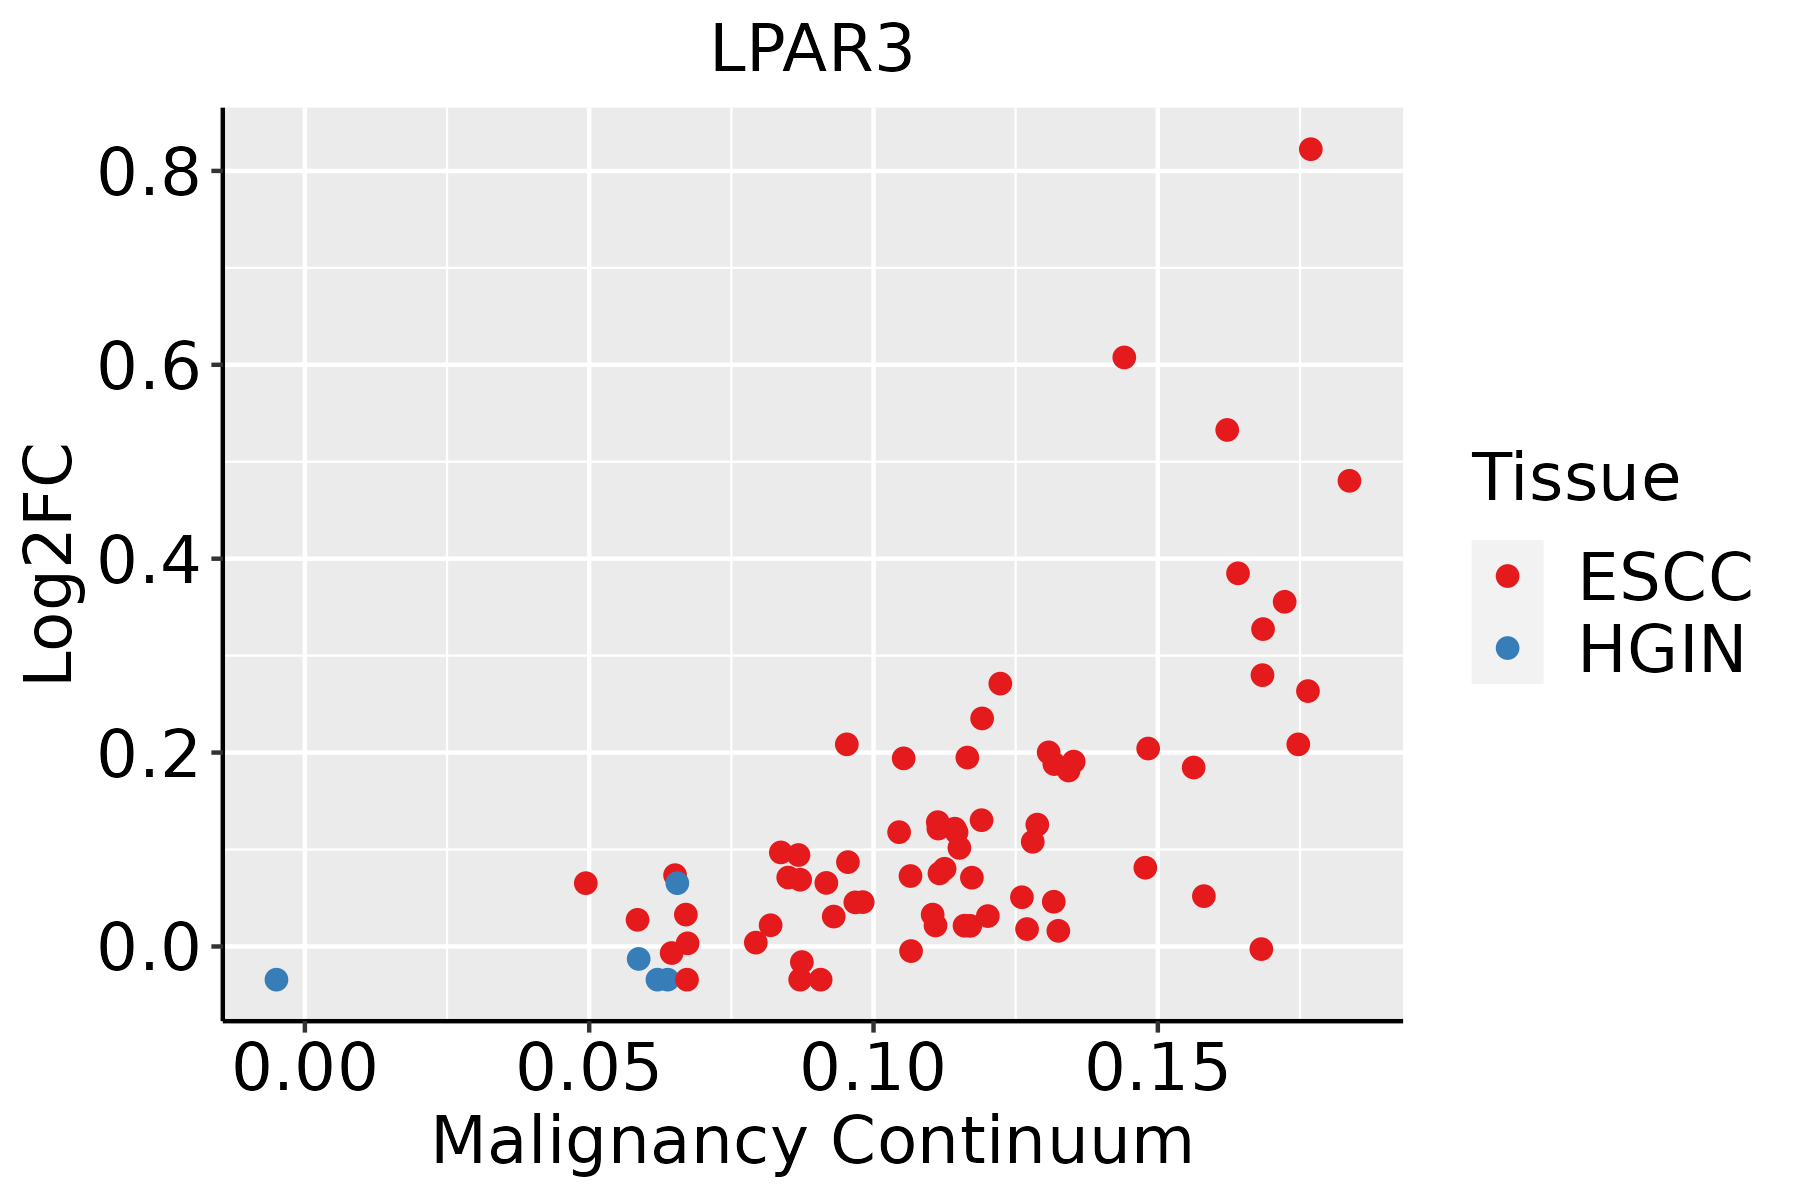 | ESCC: Esophageal squamous cell carcinoma |
| HGIN: High-grade intraepithelial neoplasias | ||
| LGIN: Low-grade intraepithelial neoplasias | ||
| Oral Cavity | 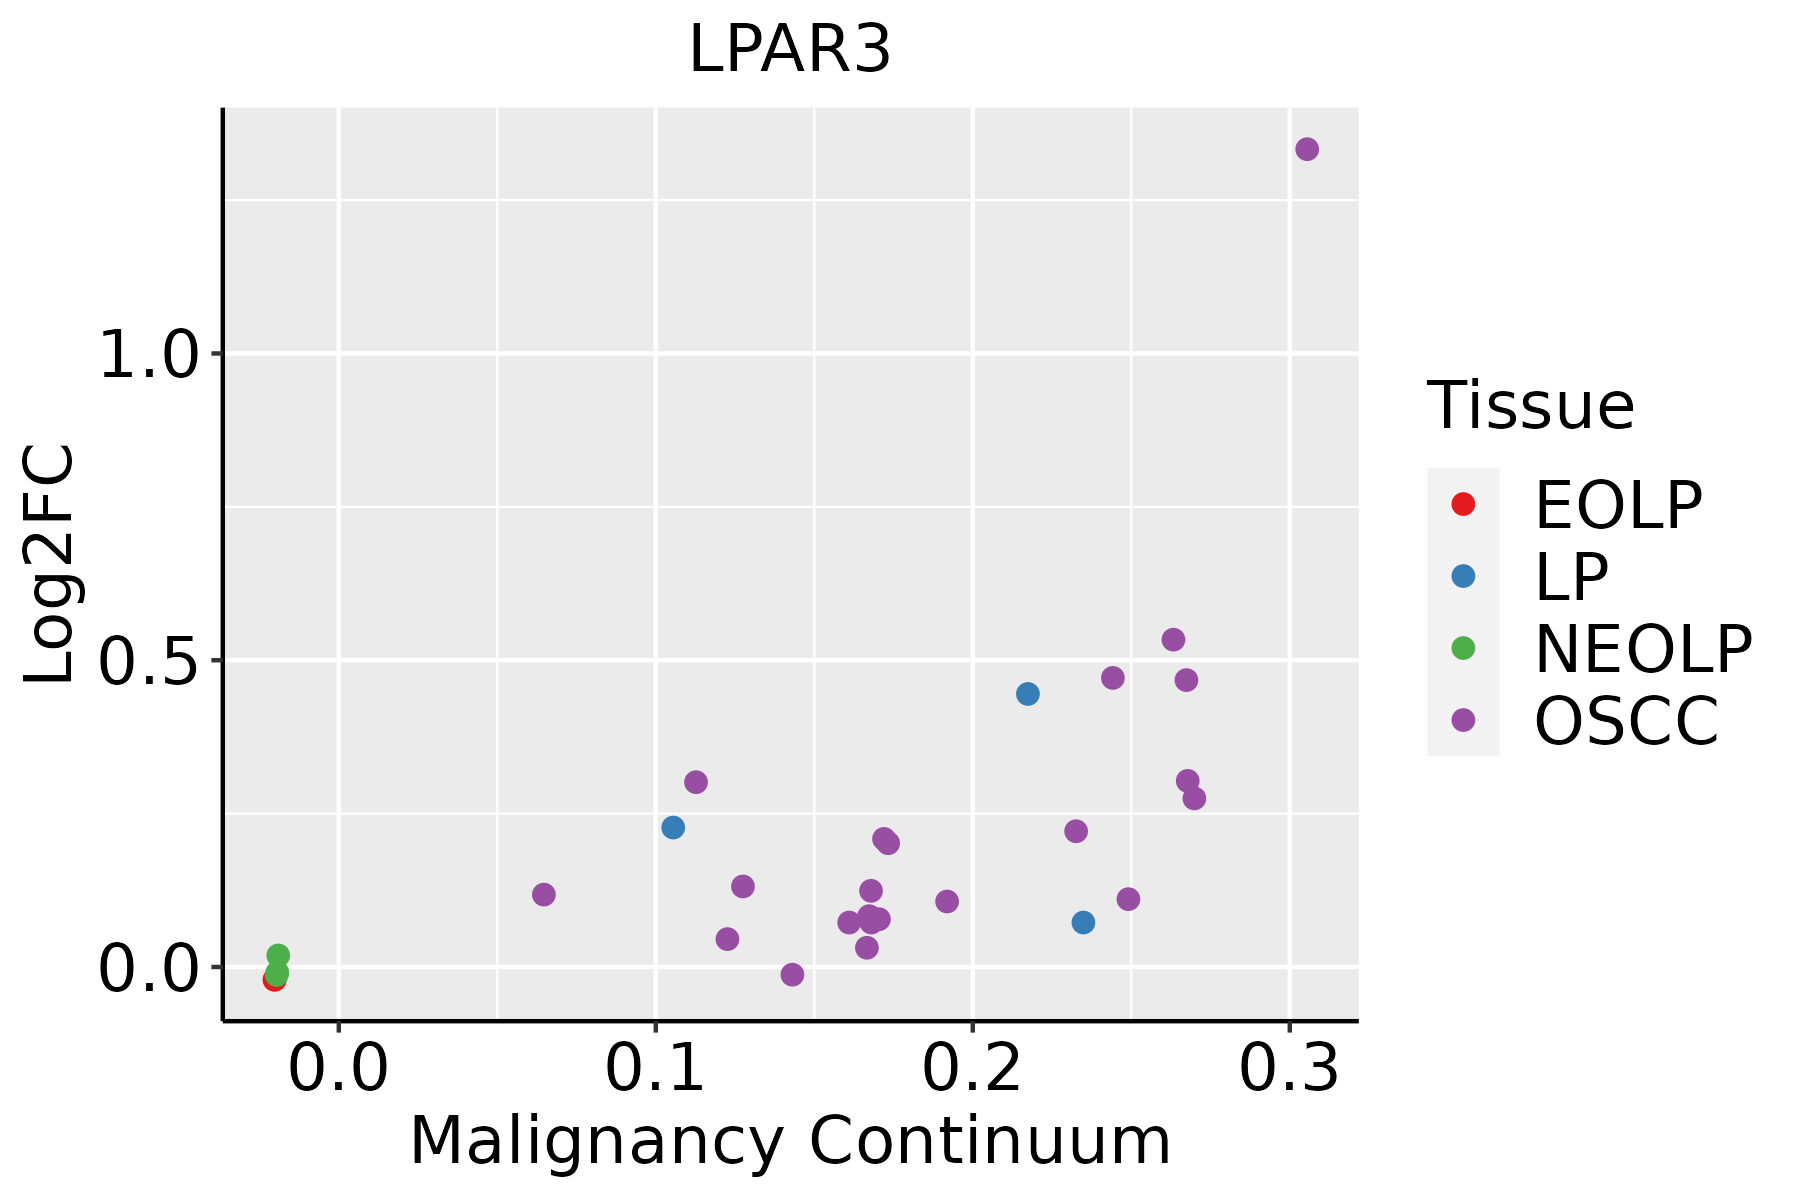 | EOLP: Erosive Oral lichen planus |
| LP: leukoplakia | ||
| NEOLP: Non-erosive oral lichen planus | ||
| OSCC: Oral squamous cell carcinoma | ||
| Prostate | 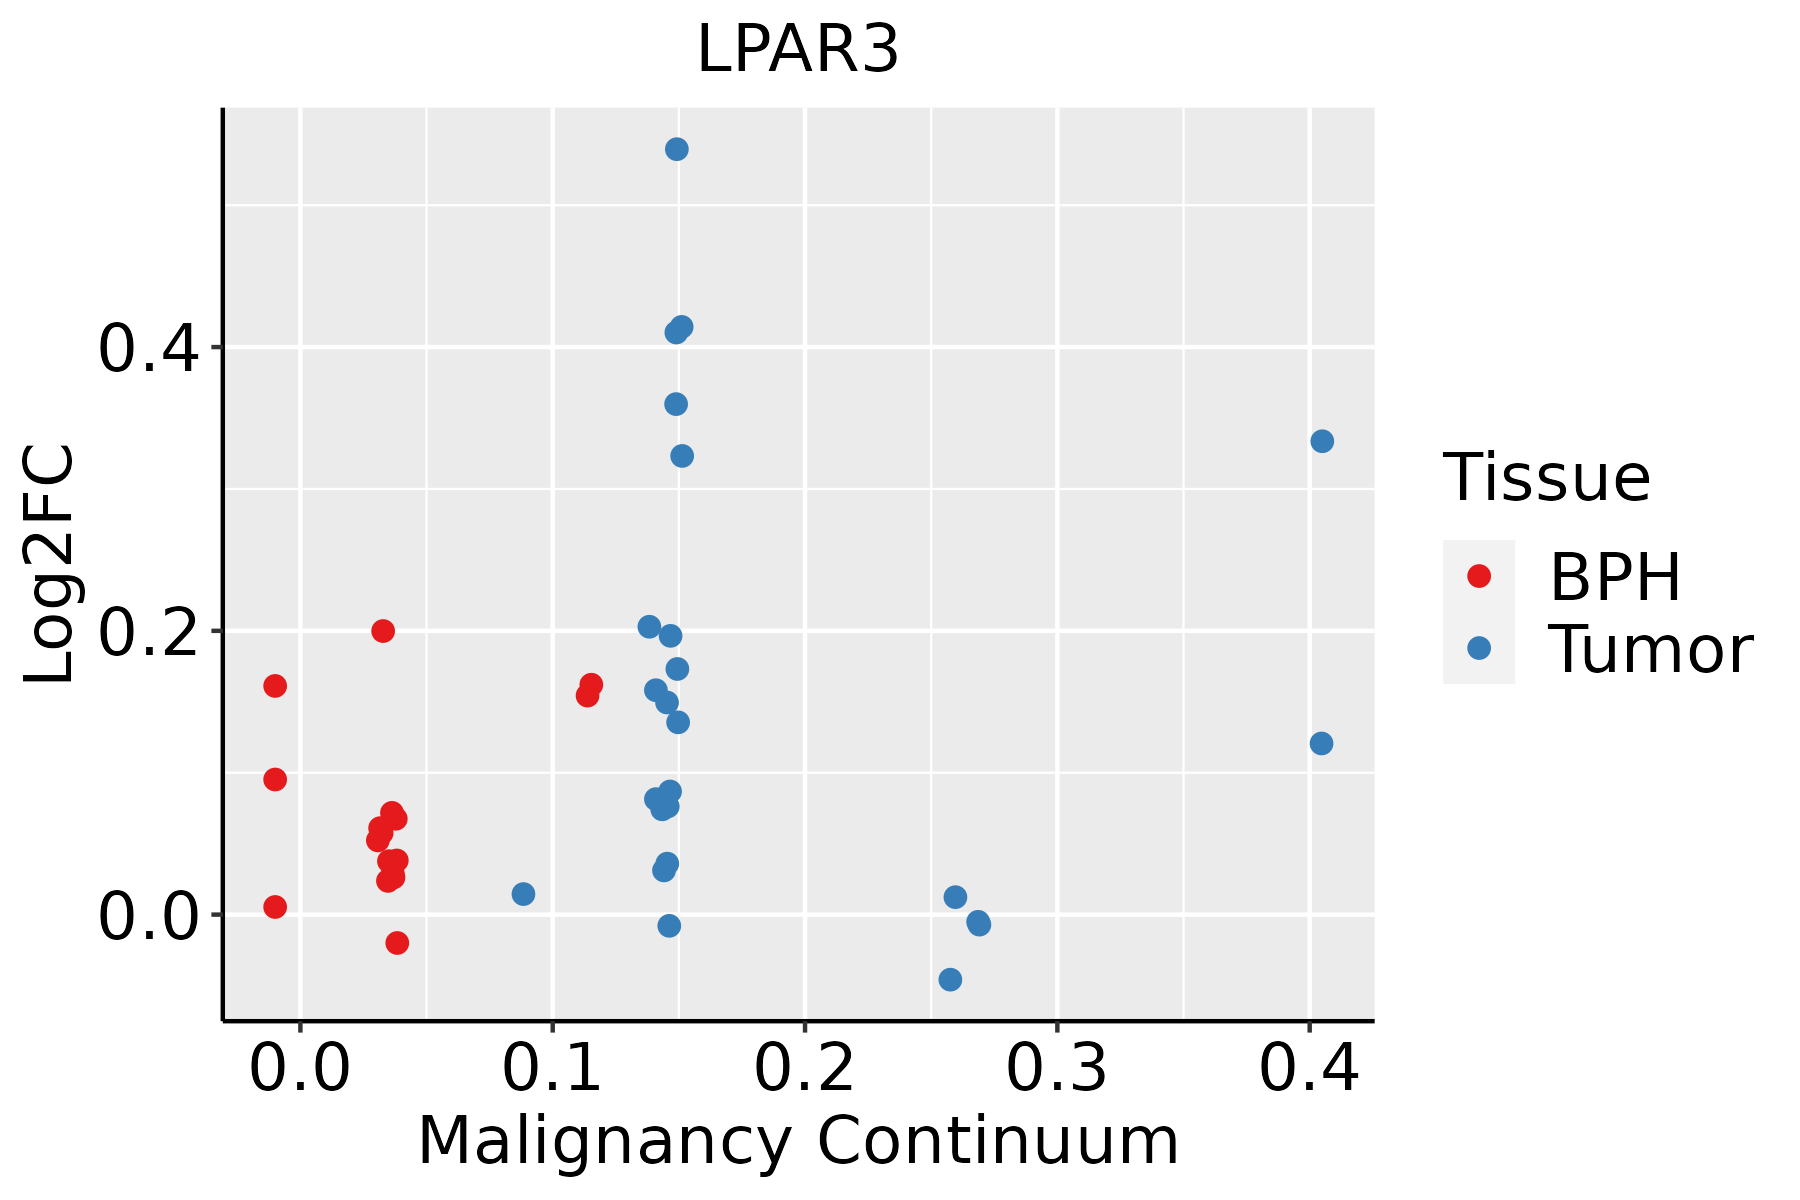 | BPH: Benign Prostatic Hyperplasia |
| ∗log2FC in expression of this searched gene in stem-like cells from each diseased tissue sample relative to stem-like cells in normal samples in each tissue plotted against the malignancy continuum. Samples are colored based on if they are from different disease stage. |
Top |
Malignant transformation related pathway analysis |
| Find out the enriched GO biological processes and KEGG pathways involved in transition from healthy to precancer to cancer |
| Tissue | Disease Stage | Enriched GO biological Processes |
| Colorectum | CRC |  |
| Stomach | GC |  |
| Stomach | CAG with IM |  |
| Stomach | CSG |  |
| Stomach | CAG |  |
| ∗Top 15 enriched GO BP terms are showed in the bar plot of each disease state in each tissue. Each row represents a significant GO biological process which is colored according to the -log10(p.adjust). |
| Page: 1 2 3 4 5 6 7 8 9 |
| GO ID | Tissue | Disease Stage | Description | Gene Ratio | Bg Ratio | pvalue | p.adjust | Count |
| GO:0016049110 | Esophagus | ESCC | cell growth | 289/8552 | 482/18723 | 1.29e-10 | 3.77e-09 | 289 |
| GO:000155819 | Esophagus | ESCC | regulation of cell growth | 248/8552 | 414/18723 | 2.97e-09 | 6.45e-08 | 248 |
| GO:003253520 | Esophagus | ESCC | regulation of cellular component size | 227/8552 | 383/18723 | 4.77e-08 | 8.60e-07 | 227 |
| GO:003134616 | Esophagus | ESCC | positive regulation of cell projection organization | 201/8552 | 353/18723 | 1.19e-05 | 1.11e-04 | 201 |
| GO:001072010 | Esophagus | ESCC | positive regulation of cell development | 172/8552 | 298/18723 | 1.74e-05 | 1.55e-04 | 172 |
| GO:005076710 | Esophagus | ESCC | regulation of neurogenesis | 203/8552 | 364/18723 | 6.10e-05 | 4.68e-04 | 203 |
| GO:00507697 | Esophagus | ESCC | positive regulation of neurogenesis | 131/8552 | 225/18723 | 9.71e-05 | 6.90e-04 | 131 |
| GO:003030710 | Esophagus | ESCC | positive regulation of cell growth | 100/8552 | 166/18723 | 1.07e-04 | 7.55e-04 | 100 |
| GO:00083619 | Esophagus | ESCC | regulation of cell size | 107/8552 | 181/18723 | 1.81e-04 | 1.16e-03 | 107 |
| GO:006156415 | Esophagus | ESCC | axon development | 251/8552 | 467/18723 | 2.41e-04 | 1.49e-03 | 251 |
| GO:001097516 | Esophagus | ESCC | regulation of neuron projection development | 240/8552 | 445/18723 | 2.48e-04 | 1.53e-03 | 240 |
| GO:00519606 | Esophagus | ESCC | regulation of nervous system development | 237/8552 | 443/18723 | 5.02e-04 | 2.78e-03 | 237 |
| GO:006056010 | Esophagus | ESCC | developmental growth involved in morphogenesis | 131/8552 | 234/18723 | 9.28e-04 | 4.73e-03 | 131 |
| GO:00519625 | Esophagus | ESCC | positive regulation of nervous system development | 149/8552 | 272/18723 | 1.50e-03 | 7.06e-03 | 149 |
| GO:000740915 | Esophagus | ESCC | axonogenesis | 219/8552 | 418/18723 | 3.14e-03 | 1.31e-02 | 219 |
| GO:00507728 | Esophagus | ESCC | positive regulation of axonogenesis | 48/8552 | 79/18723 | 4.93e-03 | 1.89e-02 | 48 |
| GO:004858810 | Esophagus | ESCC | developmental cell growth | 125/8552 | 234/18723 | 1.01e-02 | 3.46e-02 | 125 |
| GO:004592717 | Esophagus | ESCC | positive regulation of growth | 137/8552 | 259/18723 | 1.13e-02 | 3.80e-02 | 137 |
| GO:001604917 | Oral cavity | OSCC | cell growth | 268/7305 | 482/18723 | 6.55e-14 | 3.51e-12 | 268 |
| GO:000155816 | Oral cavity | OSCC | regulation of cell growth | 228/7305 | 414/18723 | 1.74e-11 | 6.09e-10 | 228 |
| Page: 1 2 3 |
| Pathway ID | Tissue | Disease Stage | Description | Gene Ratio | Bg Ratio | pvalue | p.adjust | qvalue | Count |
| hsa041517 | Esophagus | ESCC | PI3K-Akt signaling pathway | 197/4205 | 354/8465 | 1.24e-02 | 2.83e-02 | 1.45e-02 | 197 |
| hsa0415114 | Esophagus | ESCC | PI3K-Akt signaling pathway | 197/4205 | 354/8465 | 1.24e-02 | 2.83e-02 | 1.45e-02 | 197 |
| hsa041516 | Oral cavity | OSCC | PI3K-Akt signaling pathway | 185/3704 | 354/8465 | 6.26e-04 | 1.86e-03 | 9.49e-04 | 185 |
| hsa0401518 | Oral cavity | OSCC | Rap1 signaling pathway | 107/3704 | 210/8465 | 2.01e-02 | 4.34e-02 | 2.21e-02 | 107 |
| hsa0415113 | Oral cavity | OSCC | PI3K-Akt signaling pathway | 185/3704 | 354/8465 | 6.26e-04 | 1.86e-03 | 9.49e-04 | 185 |
| hsa0401519 | Oral cavity | OSCC | Rap1 signaling pathway | 107/3704 | 210/8465 | 2.01e-02 | 4.34e-02 | 2.21e-02 | 107 |
| hsa0415122 | Prostate | Tumor | PI3K-Akt signaling pathway | 105/1791 | 354/8465 | 7.42e-05 | 5.30e-04 | 3.28e-04 | 105 |
| hsa0401523 | Prostate | Tumor | Rap1 signaling pathway | 60/1791 | 210/8465 | 6.16e-03 | 2.12e-02 | 1.32e-02 | 60 |
| hsa0415132 | Prostate | Tumor | PI3K-Akt signaling pathway | 105/1791 | 354/8465 | 7.42e-05 | 5.30e-04 | 3.28e-04 | 105 |
| hsa0401533 | Prostate | Tumor | Rap1 signaling pathway | 60/1791 | 210/8465 | 6.16e-03 | 2.12e-02 | 1.32e-02 | 60 |
| Page: 1 |
Top |
Cell-cell communication analysis |
| Identification of potential cell-cell interactions between two cell types and their ligand-receptor pairs for different disease states |
| Ligand | Receptor | LRpair | Pathway | Tissue | Disease Stage |
| Page: 1 |
Top |
Single-cell gene regulatory network inference analysis |
| Find out the significant the regulons (TFs) and the target genes of each regulon across cell types for different disease states |
| TF | Cell Type | Tissue | Disease Stage | Target Gene | RSS | Regulon Activity |
| ∗The dot plots of a searched regulon are shown for all cell subpopulations in each disease state of each tissue based on the regulon specific score inferred using pySCENIC and by calculating the average expression. |
| Page: 1 |
Top |
Somatic mutation of malignant transformation related genes |
| Annotation of somatic variants for genes involved in malignant transformation |
| Hugo Symbol | Variant Class | Variant Classification | dbSNP RS | HGVSc | HGVSp | HGVSp Short | SWISSPROT | BIOTYPE | SIFT | PolyPhen | Tumor Sample Barcode | Tissue | Histology | Sex | Age | Stage | Therapy Types | Drugs | Outcome |
| LPAR3 | SNV | Missense_Mutation | novel | c.71A>T | p.Asp24Val | p.D24V | Q9UBY5 | protein_coding | tolerated(0.31) | benign(0.007) | TCGA-EA-A3HU-01 | Cervix | cervical & endocervical cancer | Female | <65 | I/II | Unknown | Unknown | SD |
| LPAR3 | SNV | Missense_Mutation | rs544005031 | c.482N>T | p.Ala161Val | p.A161V | Q9UBY5 | protein_coding | tolerated(0.7) | probably_damaging(0.996) | TCGA-AA-3811-01 | Colorectum | colon adenocarcinoma | Female | >=65 | III/IV | Unknown | Unknown | PD |
| LPAR3 | SNV | Missense_Mutation | c.637N>A | p.Val213Ile | p.V213I | Q9UBY5 | protein_coding | deleterious(0.01) | probably_damaging(0.993) | TCGA-AA-A01R-01 | Colorectum | colon adenocarcinoma | Male | <65 | III/IV | Chemotherapy | 5-fluorouracil | PD | |
| LPAR3 | SNV | Missense_Mutation | c.275C>T | p.Pro92Leu | p.P92L | Q9UBY5 | protein_coding | deleterious(0) | probably_damaging(0.939) | TCGA-G4-6317-01 | Colorectum | colon adenocarcinoma | Female | <65 | III/IV | Chemotherapy | fluorouracil | PD | |
| LPAR3 | SNV | Missense_Mutation | c.583N>G | p.Asn195Asp | p.N195D | Q9UBY5 | protein_coding | deleterious(0.02) | probably_damaging(0.995) | TCGA-G4-6588-01 | Colorectum | colon adenocarcinoma | Female | <65 | I/II | Unknown | Unknown | SD | |
| LPAR3 | SNV | Missense_Mutation | novel | c.896A>G | p.Asp299Gly | p.D299G | Q9UBY5 | protein_coding | deleterious(0) | benign(0.101) | TCGA-WS-AB45-01 | Colorectum | colon adenocarcinoma | Female | <65 | I/II | Unknown | Unknown | SD |
| LPAR3 | SNV | Missense_Mutation | rs751975084 | c.113C>T | p.Thr38Met | p.T38M | Q9UBY5 | protein_coding | tolerated(0.18) | benign(0.306) | TCGA-AG-A02N-01 | Colorectum | rectum adenocarcinoma | Male | >=65 | I/II | Chemotherapy | folinic | CR |
| LPAR3 | insertion | Frame_Shift_Ins | rs767032705 | c.40_41insT | p.Tyr14LeufsTer2 | p.Y14Lfs*2 | Q9UBY5 | protein_coding | TCGA-D5-6928-01 | Colorectum | colon adenocarcinoma | Male | >=65 | I/II | Unknown | Unknown | SD | ||
| LPAR3 | SNV | Missense_Mutation | rs375422448 | c.719N>T | p.Thr240Met | p.T240M | Q9UBY5 | protein_coding | deleterious(0) | probably_damaging(0.993) | TCGA-A5-A0G2-01 | Endometrium | uterine corpus endometrioid carcinoma | Female | <65 | III/IV | Unknown | Unknown | SD |
| LPAR3 | SNV | Missense_Mutation | rs763826121 | c.466N>A | p.Ala156Thr | p.A156T | Q9UBY5 | protein_coding | deleterious(0) | possibly_damaging(0.727) | TCGA-A5-A0G2-01 | Endometrium | uterine corpus endometrioid carcinoma | Female | <65 | III/IV | Unknown | Unknown | SD |
| Page: 1 2 3 4 5 |
Top |
Related drugs of malignant transformation related genes |
| Identification of chemicals and drugs interact with genes involved in malignant transfromation |
| (DGIdb 4.0) |
| Entrez ID | Symbol | Category | Interaction Types | Drug Claim Name | Drug Name | PMIDs |
| 23566 | LPAR3 | DRUGGABLE GENOME, G PROTEIN COUPLED RECEPTOR | antagonist | 178102101 | ||
| 23566 | LPAR3 | DRUGGABLE GENOME, G PROTEIN COUPLED RECEPTOR | SAR-100842 | 25593637 | ||
| 23566 | LPAR3 | DRUGGABLE GENOME, G PROTEIN COUPLED RECEPTOR | agonist | 135651509 | ||
| 23566 | LPAR3 | DRUGGABLE GENOME, G PROTEIN COUPLED RECEPTOR | antagonist | 135651488 | ||
| 23566 | LPAR3 | DRUGGABLE GENOME, G PROTEIN COUPLED RECEPTOR | agonist | 135649710 | ||
| 23566 | LPAR3 | DRUGGABLE GENOME, G PROTEIN COUPLED RECEPTOR | antagonist | 135649931 | ||
| 23566 | LPAR3 | DRUGGABLE GENOME, G PROTEIN COUPLED RECEPTOR | agonist | 135650759 | ||
| 23566 | LPAR3 | DRUGGABLE GENOME, G PROTEIN COUPLED RECEPTOR | antagonist | 135651308 | ||
| 23566 | LPAR3 | DRUGGABLE GENOME, G PROTEIN COUPLED RECEPTOR | NSC-255523 | CHEMBL519155 | 18467108 | |
| 23566 | LPAR3 | DRUGGABLE GENOME, G PROTEIN COUPLED RECEPTOR | antagonist | 135651309 |
| Page: 1 2 |

Copyright 2023-Present -The University of Texas Health Science Center at Houston |