
|
|||||
|
 | |
| |
| |
| |
| |
| |
|
Gene: HADHA |
Gene summary for HADHA |
| Gene information | Species | Human | Gene symbol | HADHA | Gene ID | 3030 |
| Gene name | hydroxyacyl-CoA dehydrogenase trifunctional multienzyme complex subunit alpha | |
| Gene Alias | ECHA | |
| Cytomap | 2p23.3 | |
| Gene Type | protein-coding | GO ID | GO:0006082 | UniProtAcc | E9KL44 |
Top |
Malignant transformation analysis |
| Identification of the aberrant gene expression in precancerous and cancerous lesions by comparing the gene expression of stem-like cells in diseased tissues with normal stem cells |
| Entrez ID | Symbol | Replicates | Species | Organ | Tissue | Adj P-value | Log2FC | Malignancy |
| 3030 | HADHA | HTA11_2487_2000001011 | Human | Colorectum | SER | 3.31e-06 | 5.31e-01 | -0.1808 |
| 3030 | HADHA | HTA11_1938_2000001011 | Human | Colorectum | AD | 7.15e-05 | 5.13e-01 | -0.0811 |
| 3030 | HADHA | HTA11_347_2000001011 | Human | Colorectum | AD | 1.36e-32 | 9.22e-01 | -0.1954 |
| 3030 | HADHA | HTA11_83_2000001011 | Human | Colorectum | SER | 2.22e-10 | 7.31e-01 | -0.1526 |
| 3030 | HADHA | HTA11_696_2000001011 | Human | Colorectum | AD | 1.46e-06 | 5.04e-01 | -0.1464 |
| 3030 | HADHA | HTA11_1391_2000001011 | Human | Colorectum | AD | 8.39e-13 | 6.86e-01 | -0.059 |
| 3030 | HADHA | HTA11_2992_2000001011 | Human | Colorectum | SER | 1.69e-04 | 6.43e-01 | -0.1706 |
| 3030 | HADHA | HTA11_546_2000001011 | Human | Colorectum | AD | 9.04e-05 | 4.94e-01 | -0.0842 |
| 3030 | HADHA | HTA11_7663_2000001011 | Human | Colorectum | SER | 1.35e-02 | 5.87e-01 | 0.0131 |
| 3030 | HADHA | HTA11_6801_2000001011 | Human | Colorectum | SER | 3.86e-05 | 8.25e-01 | 0.0171 |
| 3030 | HADHA | HTA11_7696_3000711011 | Human | Colorectum | AD | 2.80e-03 | 3.93e-01 | 0.0674 |
| 3030 | HADHA | HTA11_99999965104_69814 | Human | Colorectum | MSS | 3.88e-08 | 5.78e-01 | 0.281 |
| 3030 | HADHA | F007 | Human | Colorectum | FAP | 3.79e-03 | -4.28e-01 | 0.1176 |
| 3030 | HADHA | A002-C-010 | Human | Colorectum | FAP | 3.12e-03 | -2.43e-01 | 0.242 |
| 3030 | HADHA | A015-C-203 | Human | Colorectum | FAP | 7.29e-20 | -3.44e-01 | -0.1294 |
| 3030 | HADHA | A002-C-201 | Human | Colorectum | FAP | 7.98e-06 | -2.30e-01 | 0.0324 |
| 3030 | HADHA | A002-C-203 | Human | Colorectum | FAP | 9.13e-03 | -1.56e-01 | 0.2786 |
| 3030 | HADHA | A001-C-119 | Human | Colorectum | FAP | 1.13e-03 | -3.99e-01 | -0.1557 |
| 3030 | HADHA | A001-C-108 | Human | Colorectum | FAP | 9.53e-13 | -3.19e-01 | -0.0272 |
| 3030 | HADHA | A002-C-205 | Human | Colorectum | FAP | 6.54e-10 | -2.72e-01 | -0.1236 |
| Page: 1 2 3 4 5 6 7 8 9 10 11 12 |
| Tissue | Expression Dynamics | Abbreviation |
| Colorectum (GSE201348) |  | FAP: Familial adenomatous polyposis |
| CRC: Colorectal cancer | ||
| Colorectum (HTA11) |  | AD: Adenomas |
| SER: Sessile serrated lesions | ||
| MSI-H: Microsatellite-high colorectal cancer | ||
| MSS: Microsatellite stable colorectal cancer | ||
| Endometrium |  | AEH: Atypical endometrial hyperplasia |
| EEC: Endometrioid Cancer | ||
| Esophagus | 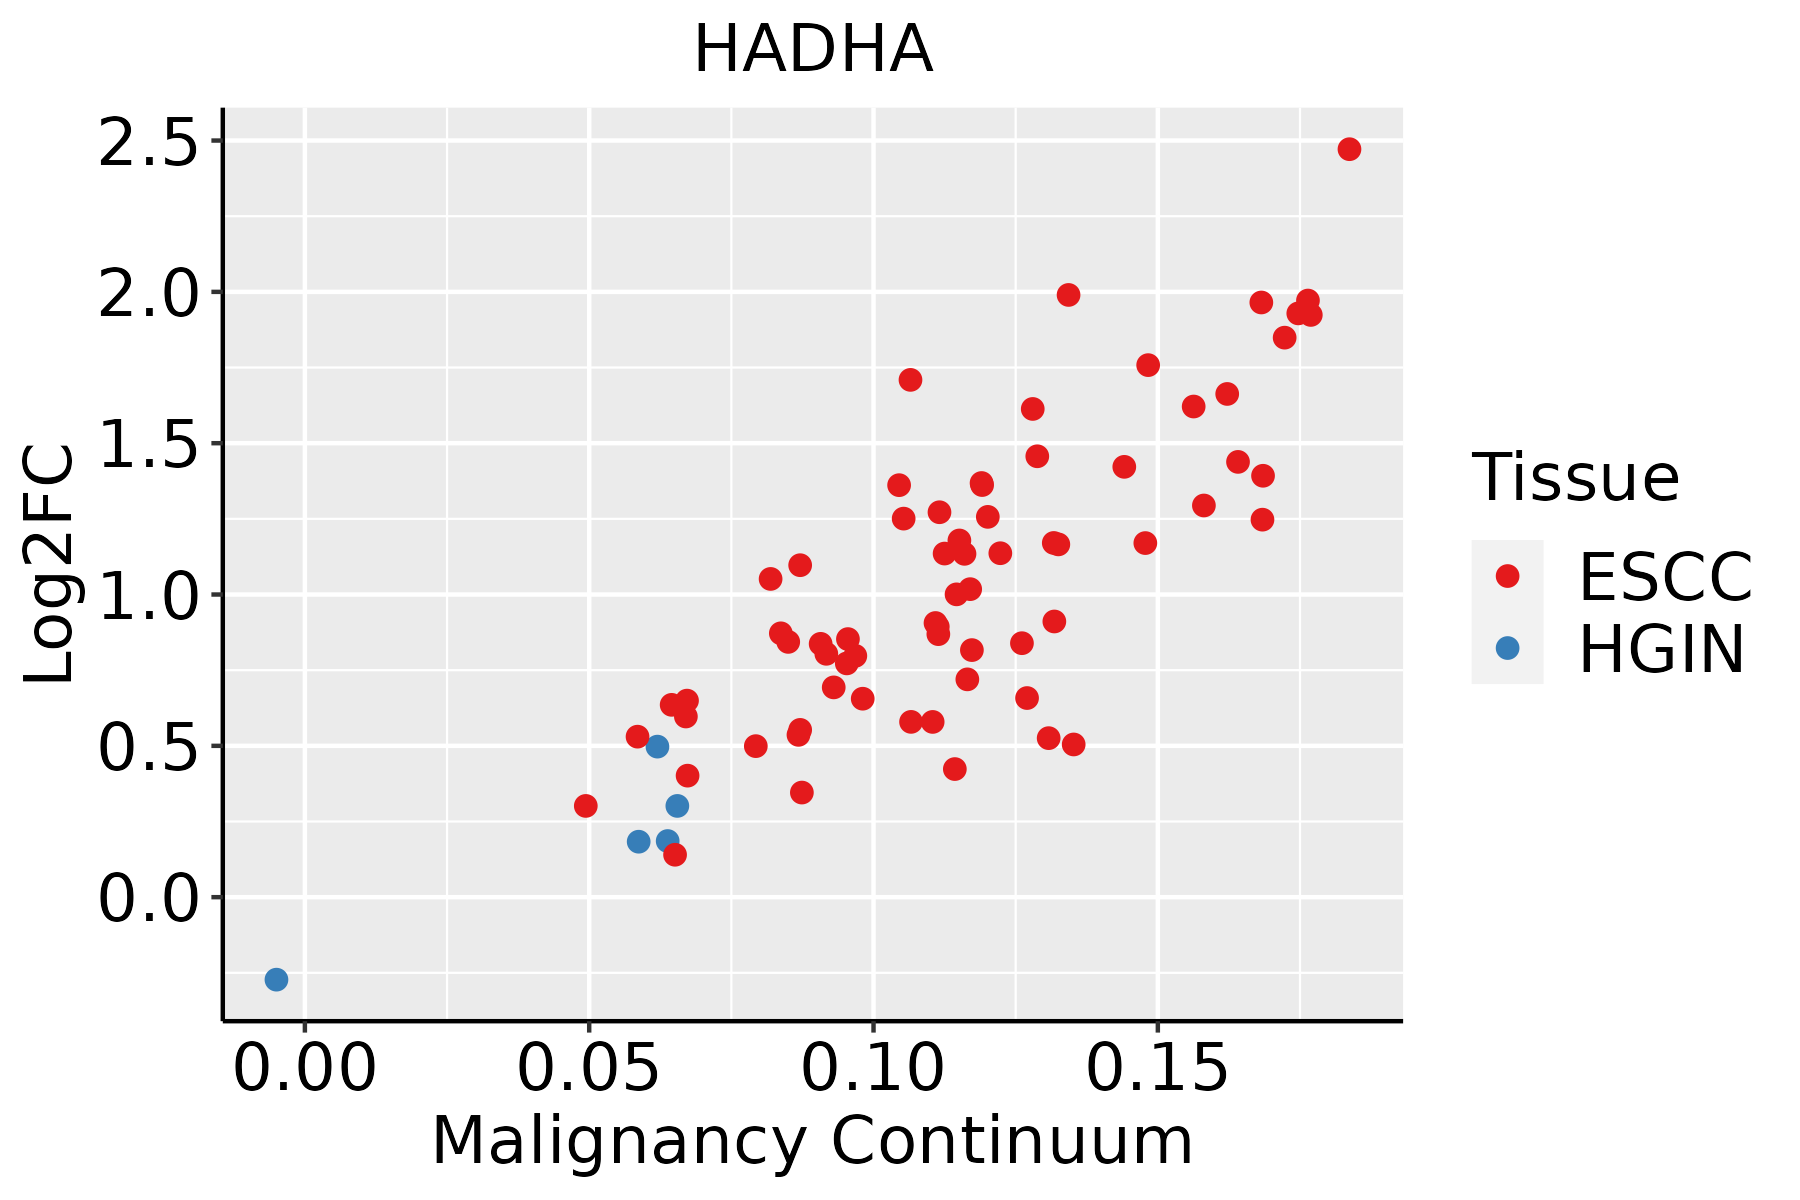 | ESCC: Esophageal squamous cell carcinoma |
| HGIN: High-grade intraepithelial neoplasias | ||
| LGIN: Low-grade intraepithelial neoplasias | ||
| GC | 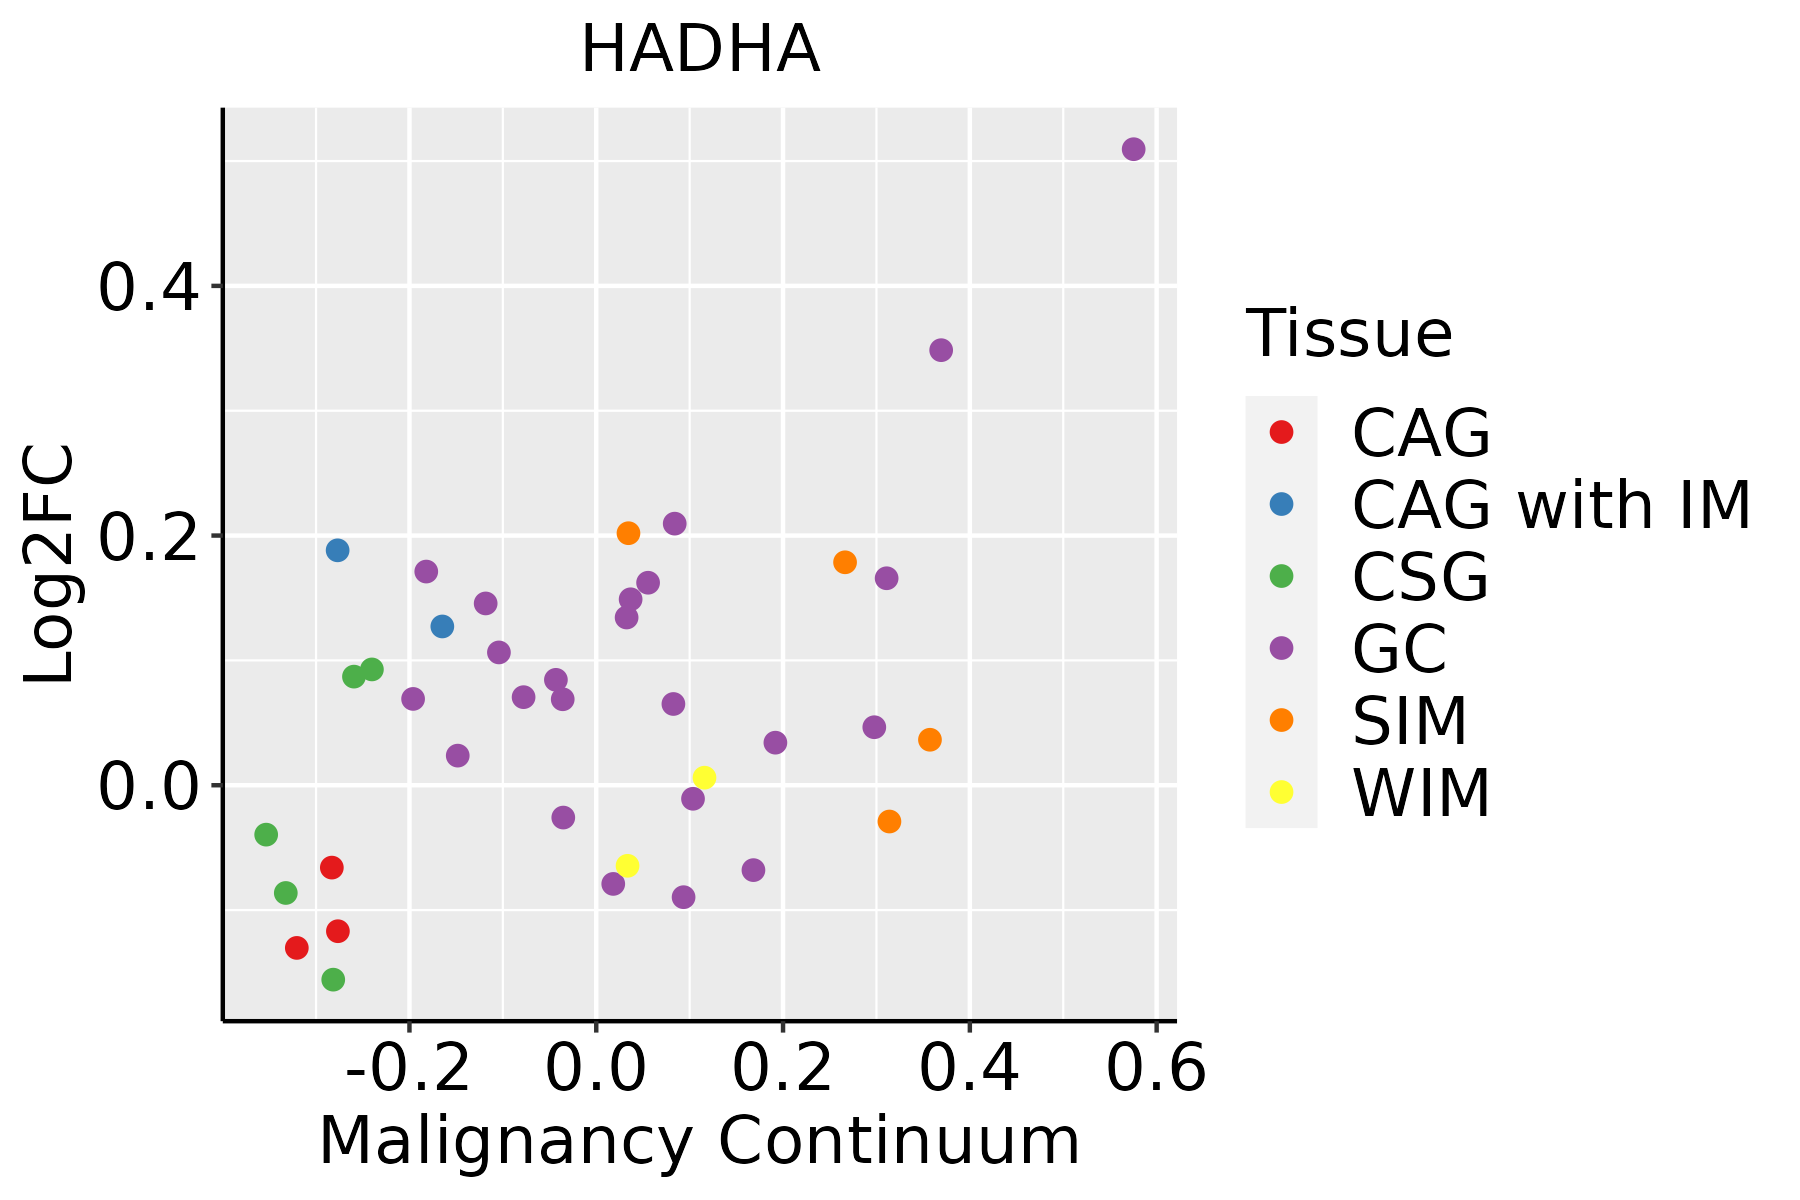 | CAG: Chronic atrophic gastritis |
| CAG with IM: Chronic atrophic gastritis with intestinal metaplasia | ||
| CSG: Chronic superficial gastritis | ||
| GC: Gastric cancer | ||
| SIM: Severe intestinal metaplasia | ||
| WIM: Wild intestinal metaplasia | ||
| Liver |  | HCC: Hepatocellular carcinoma |
| NAFLD: Non-alcoholic fatty liver disease | ||
| Oral Cavity |  | EOLP: Erosive Oral lichen planus |
| LP: leukoplakia | ||
| NEOLP: Non-erosive oral lichen planus | ||
| OSCC: Oral squamous cell carcinoma | ||
| Prostate | 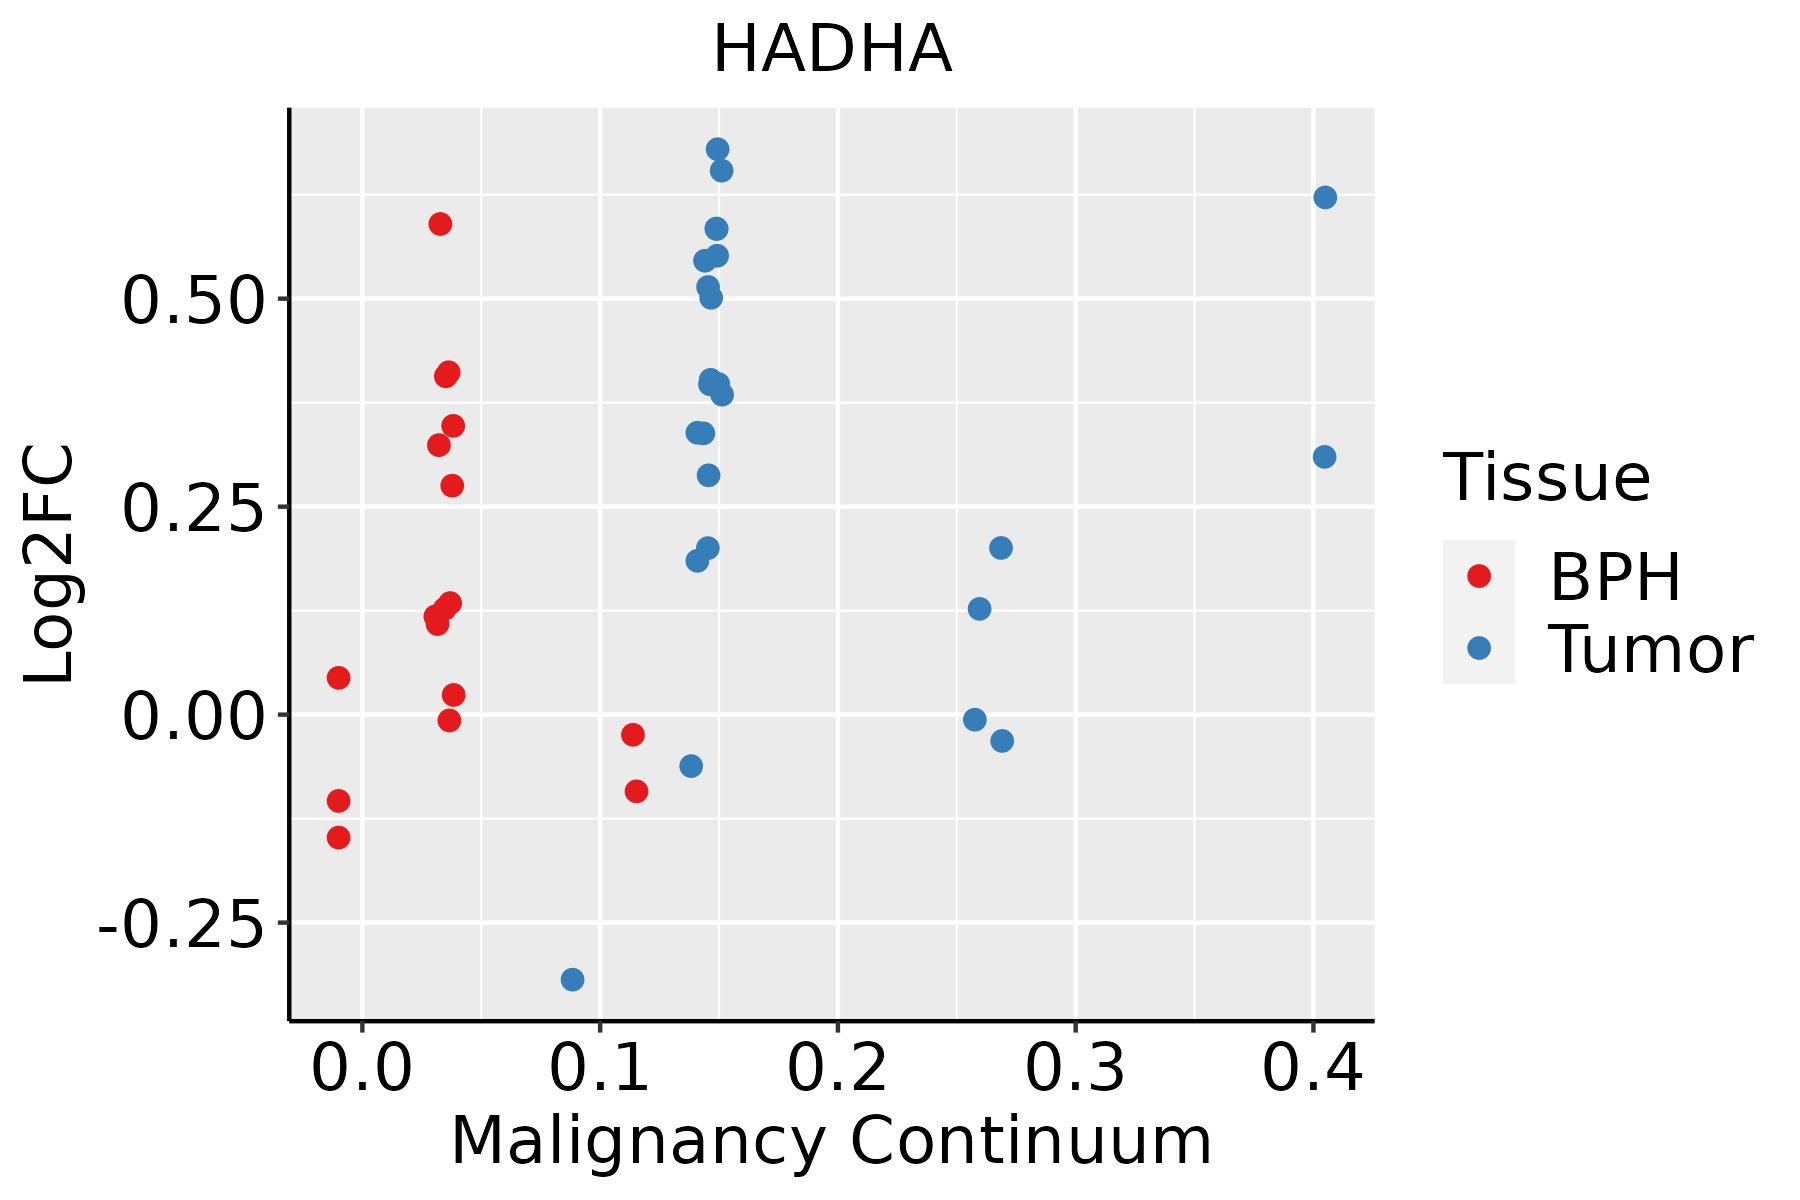 | BPH: Benign Prostatic Hyperplasia |
| Skin | 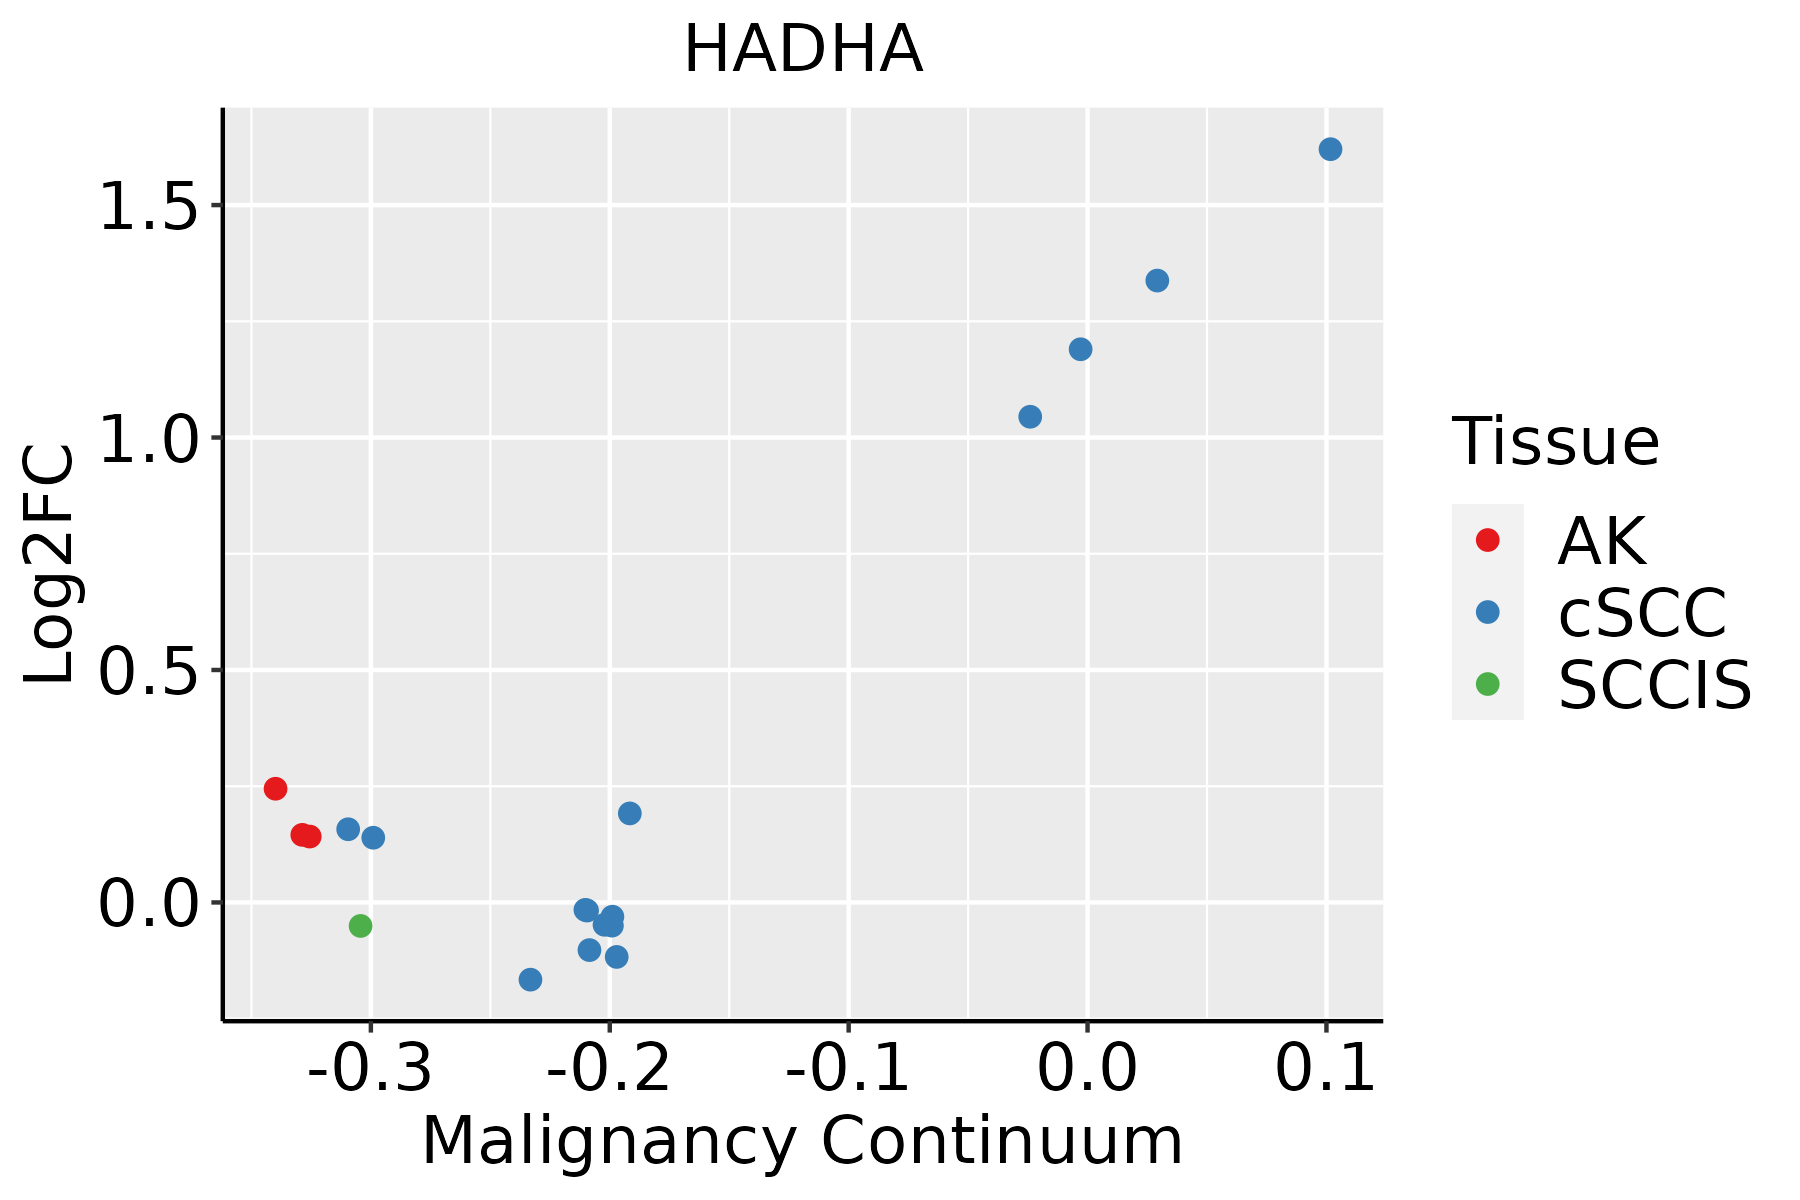 | AK: Actinic keratosis |
| cSCC: Cutaneous squamous cell carcinoma | ||
| SCCIS:squamous cell carcinoma in situ | ||
| Thyroid |  | ATC: Anaplastic thyroid cancer |
| HT: Hashimoto's thyroiditis | ||
| PTC: Papillary thyroid cancer |
| ∗log2FC in expression of this searched gene in stem-like cells from each diseased tissue sample relative to stem-like cells in normal samples in each tissue plotted against the malignancy continuum. Samples are colored based on if they are from different disease stage. |
Top |
Malignant transformation related pathway analysis |
| Find out the enriched GO biological processes and KEGG pathways involved in transition from healthy to precancer to cancer |
| Tissue | Disease Stage | Enriched GO biological Processes |
| Colorectum | CRC |  |
| Stomach | GC |  |
| Stomach | CAG with IM |  |
| Stomach | CSG |  |
| Stomach | CAG |  |
| ∗Top 15 enriched GO BP terms are showed in the bar plot of each disease state in each tissue. Each row represents a significant GO biological process which is colored according to the -log10(p.adjust). |
| Page: 1 2 3 4 5 6 7 8 9 |
| GO ID | Tissue | Disease Stage | Description | Gene Ratio | Bg Ratio | pvalue | p.adjust | Count |
| GO:0032868 | Colorectum | AD | response to insulin | 91/3918 | 264/18723 | 2.02e-07 | 8.48e-06 | 91 |
| GO:0044282 | Colorectum | AD | small molecule catabolic process | 118/3918 | 376/18723 | 1.05e-06 | 3.55e-05 | 118 |
| GO:0043434 | Colorectum | AD | response to peptide hormone | 126/3918 | 414/18723 | 2.70e-06 | 7.86e-05 | 126 |
| GO:0006635 | Colorectum | AD | fatty acid beta-oxidation | 33/3918 | 74/18723 | 3.98e-06 | 1.09e-04 | 33 |
| GO:0009062 | Colorectum | AD | fatty acid catabolic process | 41/3918 | 100/18723 | 4.02e-06 | 1.09e-04 | 41 |
| GO:0019395 | Colorectum | AD | fatty acid oxidation | 40/3918 | 103/18723 | 2.43e-05 | 4.69e-04 | 40 |
| GO:0016042 | Colorectum | AD | lipid catabolic process | 97/3918 | 320/18723 | 4.31e-05 | 7.56e-04 | 97 |
| GO:0006631 | Colorectum | AD | fatty acid metabolic process | 114/3918 | 390/18723 | 5.58e-05 | 9.44e-04 | 114 |
| GO:0072329 | Colorectum | AD | monocarboxylic acid catabolic process | 44/3918 | 122/18723 | 8.05e-05 | 1.28e-03 | 44 |
| GO:0034440 | Colorectum | AD | lipid oxidation | 40/3918 | 108/18723 | 8.52e-05 | 1.32e-03 | 40 |
| GO:0030258 | Colorectum | AD | lipid modification | 67/3918 | 212/18723 | 1.66e-04 | 2.27e-03 | 67 |
| GO:0009410 | Colorectum | AD | response to xenobiotic stimulus | 128/3918 | 462/18723 | 2.69e-04 | 3.31e-03 | 128 |
| GO:0016054 | Colorectum | AD | organic acid catabolic process | 73/3918 | 240/18723 | 3.20e-04 | 3.81e-03 | 73 |
| GO:0044242 | Colorectum | AD | cellular lipid catabolic process | 66/3918 | 214/18723 | 3.96e-04 | 4.50e-03 | 66 |
| GO:0046395 | Colorectum | AD | carboxylic acid catabolic process | 70/3918 | 236/18723 | 9.06e-04 | 8.71e-03 | 70 |
| GO:0006650 | Colorectum | AD | glycerophospholipid metabolic process | 83/3918 | 306/18723 | 5.40e-03 | 3.55e-02 | 83 |
| GO:0006644 | Colorectum | AD | phospholipid metabolic process | 101/3918 | 383/18723 | 5.80e-03 | 3.67e-02 | 101 |
| GO:00160421 | Colorectum | SER | lipid catabolic process | 77/2897 | 320/18723 | 3.52e-05 | 9.18e-04 | 77 |
| GO:00442821 | Colorectum | SER | small molecule catabolic process | 87/2897 | 376/18723 | 5.31e-05 | 1.27e-03 | 87 |
| GO:00328681 | Colorectum | SER | response to insulin | 65/2897 | 264/18723 | 6.70e-05 | 1.53e-03 | 65 |
| Page: 1 2 3 4 5 6 7 8 9 10 |
| Pathway ID | Tissue | Disease Stage | Description | Gene Ratio | Bg Ratio | pvalue | p.adjust | qvalue | Count |
| hsa00280 | Colorectum | AD | Valine, leucine and isoleucine degradation | 25/2092 | 48/8465 | 3.97e-05 | 3.41e-04 | 2.18e-04 | 25 |
| hsa00640 | Colorectum | AD | Propanoate metabolism | 18/2092 | 32/8465 | 1.33e-04 | 1.11e-03 | 7.08e-04 | 18 |
| hsa00310 | Colorectum | AD | Lysine degradation | 27/2092 | 63/8465 | 1.17e-03 | 7.75e-03 | 4.94e-03 | 27 |
| hsa00071 | Colorectum | AD | Fatty acid degradation | 20/2092 | 43/8465 | 1.50e-03 | 8.69e-03 | 5.54e-03 | 20 |
| hsa002801 | Colorectum | AD | Valine, leucine and isoleucine degradation | 25/2092 | 48/8465 | 3.97e-05 | 3.41e-04 | 2.18e-04 | 25 |
| hsa006401 | Colorectum | AD | Propanoate metabolism | 18/2092 | 32/8465 | 1.33e-04 | 1.11e-03 | 7.08e-04 | 18 |
| hsa003101 | Colorectum | AD | Lysine degradation | 27/2092 | 63/8465 | 1.17e-03 | 7.75e-03 | 4.94e-03 | 27 |
| hsa000711 | Colorectum | AD | Fatty acid degradation | 20/2092 | 43/8465 | 1.50e-03 | 8.69e-03 | 5.54e-03 | 20 |
| hsa006402 | Colorectum | SER | Propanoate metabolism | 13/1580 | 32/8465 | 3.20e-03 | 2.12e-02 | 1.54e-02 | 13 |
| hsa00062 | Colorectum | SER | Fatty acid elongation | 11/1580 | 27/8465 | 6.38e-03 | 3.68e-02 | 2.67e-02 | 11 |
| hsa000712 | Colorectum | SER | Fatty acid degradation | 15/1580 | 43/8465 | 8.60e-03 | 4.26e-02 | 3.09e-02 | 15 |
| hsa006403 | Colorectum | SER | Propanoate metabolism | 13/1580 | 32/8465 | 3.20e-03 | 2.12e-02 | 1.54e-02 | 13 |
| hsa000621 | Colorectum | SER | Fatty acid elongation | 11/1580 | 27/8465 | 6.38e-03 | 3.68e-02 | 2.67e-02 | 11 |
| hsa000713 | Colorectum | SER | Fatty acid degradation | 15/1580 | 43/8465 | 8.60e-03 | 4.26e-02 | 3.09e-02 | 15 |
| hsa002802 | Colorectum | MSS | Valine, leucine and isoleucine degradation | 21/1875 | 48/8465 | 6.73e-04 | 4.51e-03 | 2.76e-03 | 21 |
| hsa006404 | Colorectum | MSS | Propanoate metabolism | 15/1875 | 32/8465 | 1.68e-03 | 9.05e-03 | 5.55e-03 | 15 |
| hsa003102 | Colorectum | MSS | Lysine degradation | 24/1875 | 63/8465 | 2.94e-03 | 1.39e-02 | 8.50e-03 | 24 |
| hsa000714 | Colorectum | MSS | Fatty acid degradation | 17/1875 | 43/8465 | 7.50e-03 | 2.86e-02 | 1.75e-02 | 17 |
| hsa002803 | Colorectum | MSS | Valine, leucine and isoleucine degradation | 21/1875 | 48/8465 | 6.73e-04 | 4.51e-03 | 2.76e-03 | 21 |
| hsa006405 | Colorectum | MSS | Propanoate metabolism | 15/1875 | 32/8465 | 1.68e-03 | 9.05e-03 | 5.55e-03 | 15 |
| Page: 1 2 3 4 5 |
Top |
Cell-cell communication analysis |
| Identification of potential cell-cell interactions between two cell types and their ligand-receptor pairs for different disease states |
| Ligand | Receptor | LRpair | Pathway | Tissue | Disease Stage |
| Page: 1 |
Top |
Single-cell gene regulatory network inference analysis |
| Find out the significant the regulons (TFs) and the target genes of each regulon across cell types for different disease states |
| TF | Cell Type | Tissue | Disease Stage | Target Gene | RSS | Regulon Activity |
| ∗The dot plots of a searched regulon are shown for all cell subpopulations in each disease state of each tissue based on the regulon specific score inferred using pySCENIC and by calculating the average expression. |
| Page: 1 |
Top |
Somatic mutation of malignant transformation related genes |
| Annotation of somatic variants for genes involved in malignant transformation |
| Hugo Symbol | Variant Class | Variant Classification | dbSNP RS | HGVSc | HGVSp | HGVSp Short | SWISSPROT | BIOTYPE | SIFT | PolyPhen | Tumor Sample Barcode | Tissue | Histology | Sex | Age | Stage | Therapy Types | Drugs | Outcome |
| HADHA | SNV | Missense_Mutation | c.1128N>G | p.Ile376Met | p.I376M | P40939 | protein_coding | deleterious(0) | probably_damaging(0.998) | TCGA-AR-A1AO-01 | Breast | breast invasive carcinoma | Female | <65 | I/II | Chemotherapy | doxorubicin | SD | |
| HADHA | SNV | Missense_Mutation | novel | c.1326N>G | p.Asp442Glu | p.D442E | P40939 | protein_coding | deleterious(0.02) | probably_damaging(0.951) | TCGA-E2-A2P5-01 | Breast | breast invasive carcinoma | Female | >=65 | III/IV | Hormone Therapy | arimidex | PD |
| HADHA | insertion | Nonsense_Mutation | novel | c.2171_2172insAGGTAGAGCCCACTGCTCATTGTATAAGCCCCGAGGCCTAGAG | p.Tyr724Ter | p.Y724* | P40939 | protein_coding | TCGA-A2-A0D0-01 | Breast | breast invasive carcinoma | Female | <65 | I/II | Chemotherapy | cytoxan | SD | ||
| HADHA | insertion | Frame_Shift_Ins | novel | c.685_686insCTTCTTTGAATACTCCTTTGTATTTATCTTGTGGC | p.Leu229ProfsTer13 | p.L229Pfs*13 | P40939 | protein_coding | TCGA-AN-A0FF-01 | Breast | breast invasive carcinoma | Female | <65 | I/II | Unknown | Unknown | SD | ||
| HADHA | insertion | In_Frame_Ins | novel | c.1128_1129insTGCAGCCTTGAACTCCTGGGTACAAGTGATCCTTCT | p.Ile376_Ala377insCysSerLeuGluLeuLeuGlyThrSerAspProSer | p.I376_A377insCSLELLGTSDPS | P40939 | protein_coding | TCGA-AO-A128-01 | Breast | breast invasive carcinoma | Female | <65 | I/II | Chemotherapy | doxorubicin | SD | ||
| HADHA | SNV | Missense_Mutation | novel | c.1358N>T | p.Ser453Ile | p.S453I | P40939 | protein_coding | tolerated(0.08) | benign(0.148) | TCGA-C5-A1M6-01 | Cervix | cervical & endocervical cancer | Female | <65 | I/II | Chemotherapy | cisplatin | PD |
| HADHA | SNV | Missense_Mutation | novel | c.1770N>T | p.Glu590Asp | p.E590D | P40939 | protein_coding | deleterious(0) | probably_damaging(0.999) | TCGA-DS-A1OC-01 | Cervix | cervical & endocervical cancer | Female | <65 | I/II | Chemotherapy | gemcitabine | SD |
| HADHA | SNV | Missense_Mutation | c.283N>T | p.Pro95Ser | p.P95S | P40939 | protein_coding | deleterious(0.02) | possibly_damaging(0.817) | TCGA-AA-3930-01 | Colorectum | colon adenocarcinoma | Male | >=65 | III/IV | Chemotherapy | capecitabine | PD | |
| HADHA | SNV | Missense_Mutation | c.1620N>T | p.Lys540Asn | p.K540N | P40939 | protein_coding | deleterious(0.04) | probably_damaging(0.978) | TCGA-AY-6197-01 | Colorectum | colon adenocarcinoma | Male | <65 | I/II | Unknown | Unknown | SD | |
| HADHA | SNV | Missense_Mutation | c.1165N>G | p.Leu389Val | p.L389V | P40939 | protein_coding | deleterious(0.03) | probably_damaging(0.976) | TCGA-CK-4951-01 | Colorectum | colon adenocarcinoma | Female | >=65 | I/II | Unknown | Unknown | PD |
| Page: 1 2 3 4 5 6 7 |
Top |
Related drugs of malignant transformation related genes |
| Identification of chemicals and drugs interact with genes involved in malignant transfromation |
| (DGIdb 4.0) |
| Entrez ID | Symbol | Category | Interaction Types | Drug Claim Name | Drug Name | PMIDs |
| Page: 1 |

Copyright 2023-Present -The University of Texas Health Science Center at Houston |