
|
|||||
|
 | |
| |
| |
| |
| |
| |
|
Gene: GGA1 |
Gene summary for GGA1 |
| Gene information | Species | Human | Gene symbol | GGA1 | Gene ID | 26088 |
| Gene name | golgi associated, gamma adaptin ear containing, ARF binding protein 1 | |
| Gene Alias | GGA1 | |
| Cytomap | 22q13.1 | |
| Gene Type | protein-coding | GO ID | GO:0006807 | UniProtAcc | Q9UJY5 |
Top |
Malignant transformation analysis |
| Identification of the aberrant gene expression in precancerous and cancerous lesions by comparing the gene expression of stem-like cells in diseased tissues with normal stem cells |
| Entrez ID | Symbol | Replicates | Species | Organ | Tissue | Adj P-value | Log2FC | Malignancy |
| 26088 | GGA1 | HTA11_2487_2000001011 | Human | Colorectum | SER | 1.66e-02 | 2.81e-01 | -0.1808 |
| 26088 | GGA1 | HTA11_1938_2000001011 | Human | Colorectum | AD | 1.21e-05 | 3.76e-01 | -0.0811 |
| 26088 | GGA1 | HTA11_347_2000001011 | Human | Colorectum | AD | 9.96e-06 | 2.98e-01 | -0.1954 |
| 26088 | GGA1 | HTA11_411_2000001011 | Human | Colorectum | SER | 3.82e-03 | 7.16e-01 | -0.2602 |
| 26088 | GGA1 | HTA11_3361_2000001011 | Human | Colorectum | AD | 3.01e-03 | 3.48e-01 | -0.1207 |
| 26088 | GGA1 | HTA11_696_2000001011 | Human | Colorectum | AD | 7.57e-07 | 4.43e-01 | -0.1464 |
| 26088 | GGA1 | HTA11_866_2000001011 | Human | Colorectum | AD | 7.63e-06 | 3.79e-01 | -0.1001 |
| 26088 | GGA1 | HTA11_1391_2000001011 | Human | Colorectum | AD | 1.02e-08 | 5.34e-01 | -0.059 |
| 26088 | GGA1 | HTA11_866_3004761011 | Human | Colorectum | AD | 5.36e-05 | 3.29e-01 | 0.096 |
| 26088 | GGA1 | HTA11_7696_3000711011 | Human | Colorectum | AD | 3.78e-04 | 3.47e-01 | 0.0674 |
| 26088 | GGA1 | HTA11_99999971662_82457 | Human | Colorectum | MSS | 1.93e-12 | 5.06e-01 | 0.3859 |
| 26088 | GGA1 | A015-C-203 | Human | Colorectum | FAP | 2.94e-06 | 8.40e-02 | -0.1294 |
| 26088 | GGA1 | A002-C-201 | Human | Colorectum | FAP | 1.63e-03 | 2.16e-01 | 0.0324 |
| 26088 | GGA1 | A002-C-205 | Human | Colorectum | FAP | 4.34e-03 | -3.76e-02 | -0.1236 |
| 26088 | GGA1 | A015-C-006 | Human | Colorectum | FAP | 3.53e-03 | 8.18e-02 | -0.0994 |
| 26088 | GGA1 | A002-C-114 | Human | Colorectum | FAP | 5.40e-04 | 1.25e-01 | -0.1561 |
| 26088 | GGA1 | A015-C-104 | Human | Colorectum | FAP | 5.00e-06 | 1.40e-01 | -0.1899 |
| 26088 | GGA1 | A002-C-016 | Human | Colorectum | FAP | 3.41e-04 | -1.53e-01 | 0.0521 |
| 26088 | GGA1 | A002-C-116 | Human | Colorectum | FAP | 2.05e-04 | -1.61e-01 | -0.0452 |
| 26088 | GGA1 | A018-E-020 | Human | Colorectum | FAP | 2.93e-02 | -6.63e-02 | -0.2034 |
| Page: 1 2 3 4 5 6 7 |
| Tissue | Expression Dynamics | Abbreviation |
| Colorectum (GSE201348) | 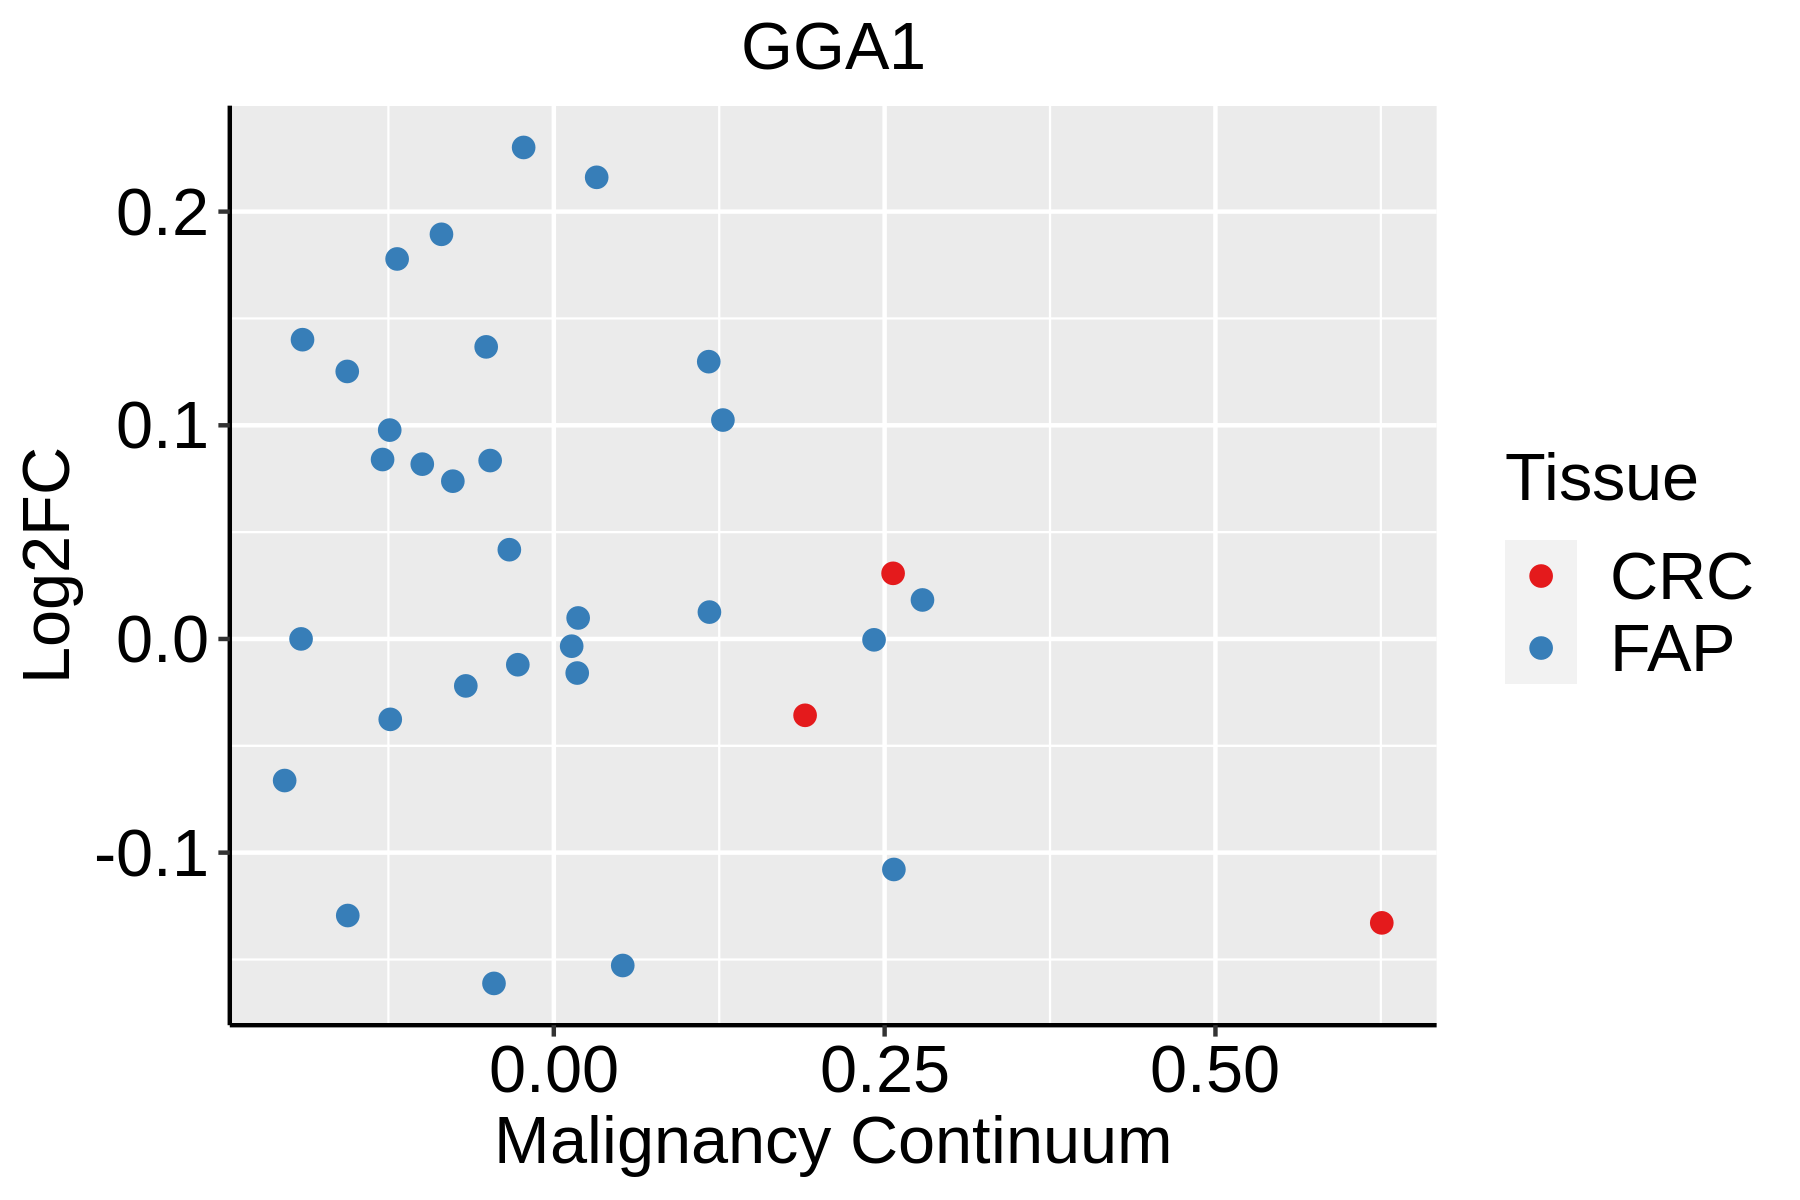 | FAP: Familial adenomatous polyposis |
| CRC: Colorectal cancer | ||
| Colorectum (HTA11) |  | AD: Adenomas |
| SER: Sessile serrated lesions | ||
| MSI-H: Microsatellite-high colorectal cancer | ||
| MSS: Microsatellite stable colorectal cancer | ||
| Esophagus | 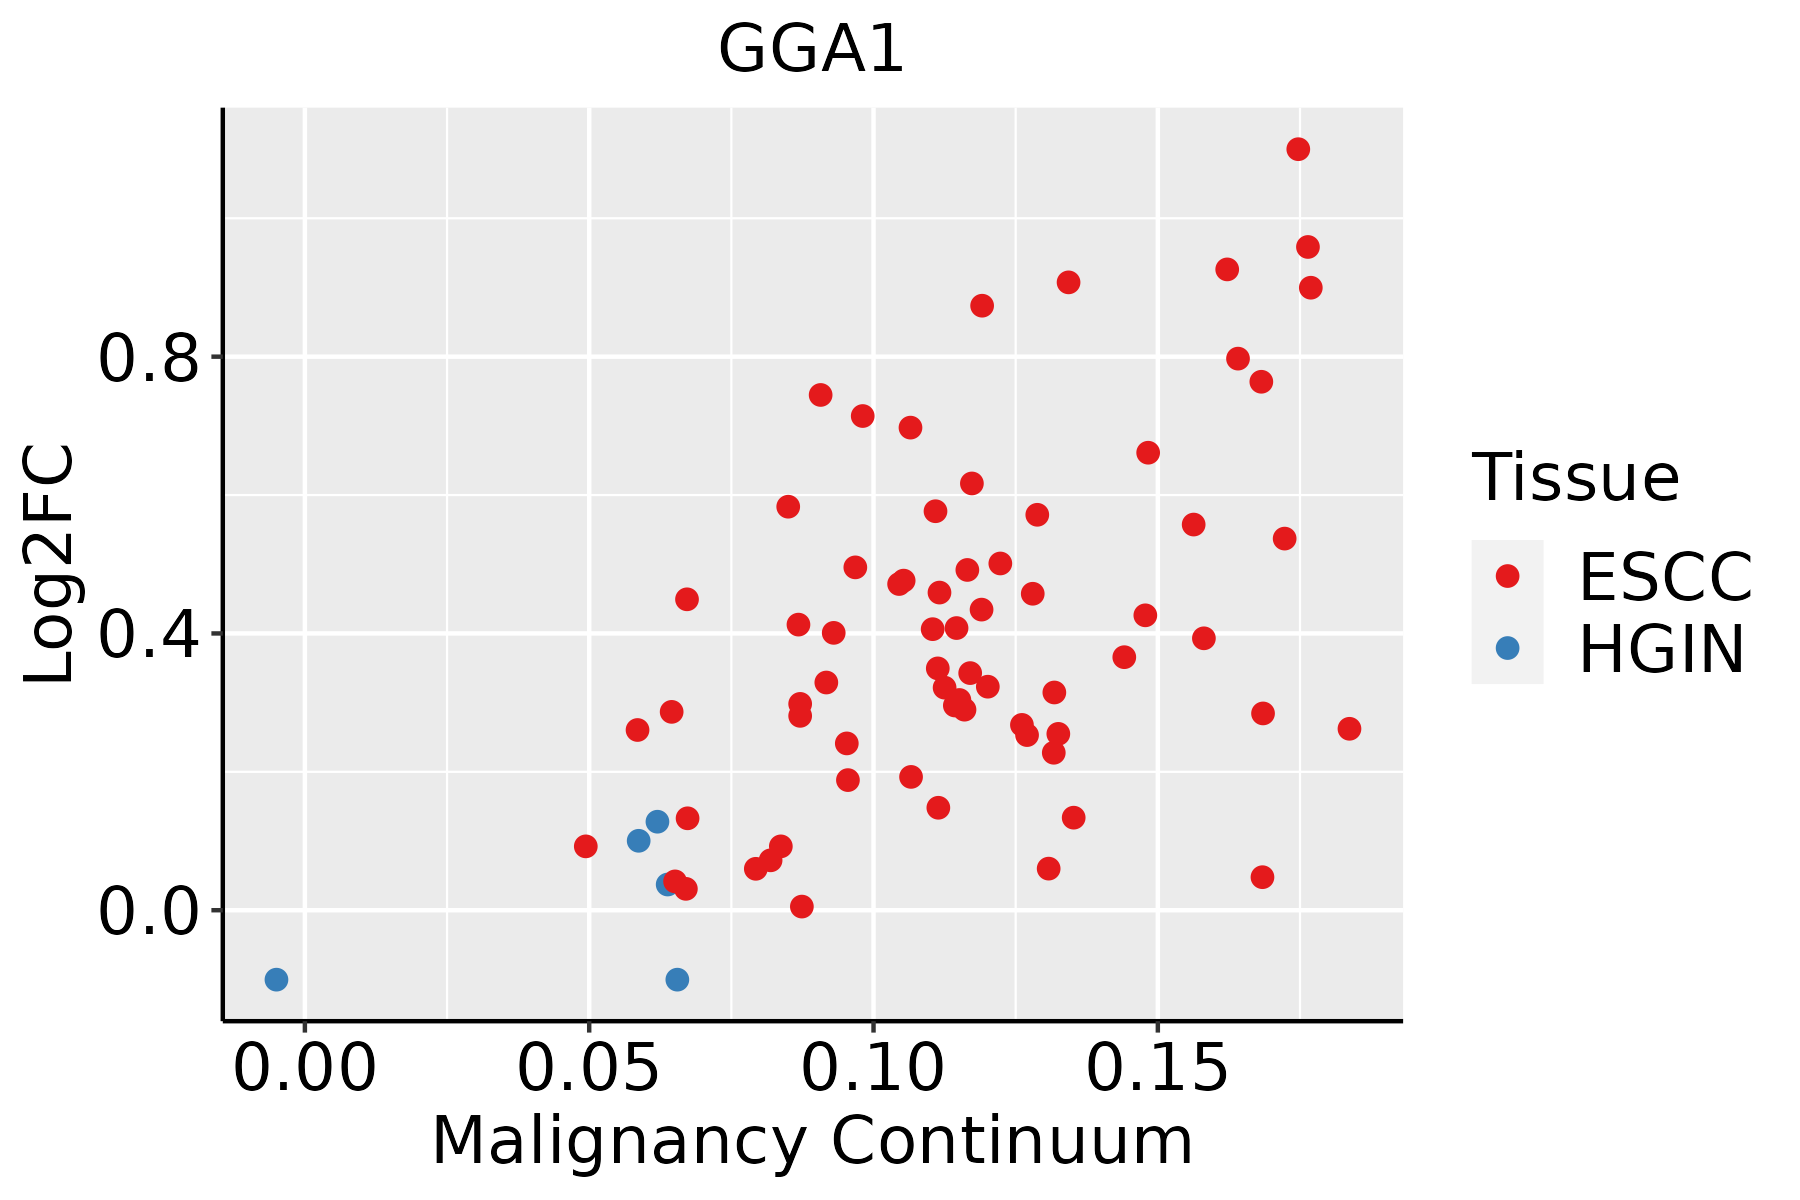 | ESCC: Esophageal squamous cell carcinoma |
| HGIN: High-grade intraepithelial neoplasias | ||
| LGIN: Low-grade intraepithelial neoplasias | ||
| Liver |  | HCC: Hepatocellular carcinoma |
| NAFLD: Non-alcoholic fatty liver disease | ||
| Oral Cavity |  | EOLP: Erosive Oral lichen planus |
| LP: leukoplakia | ||
| NEOLP: Non-erosive oral lichen planus | ||
| OSCC: Oral squamous cell carcinoma | ||
| Skin | 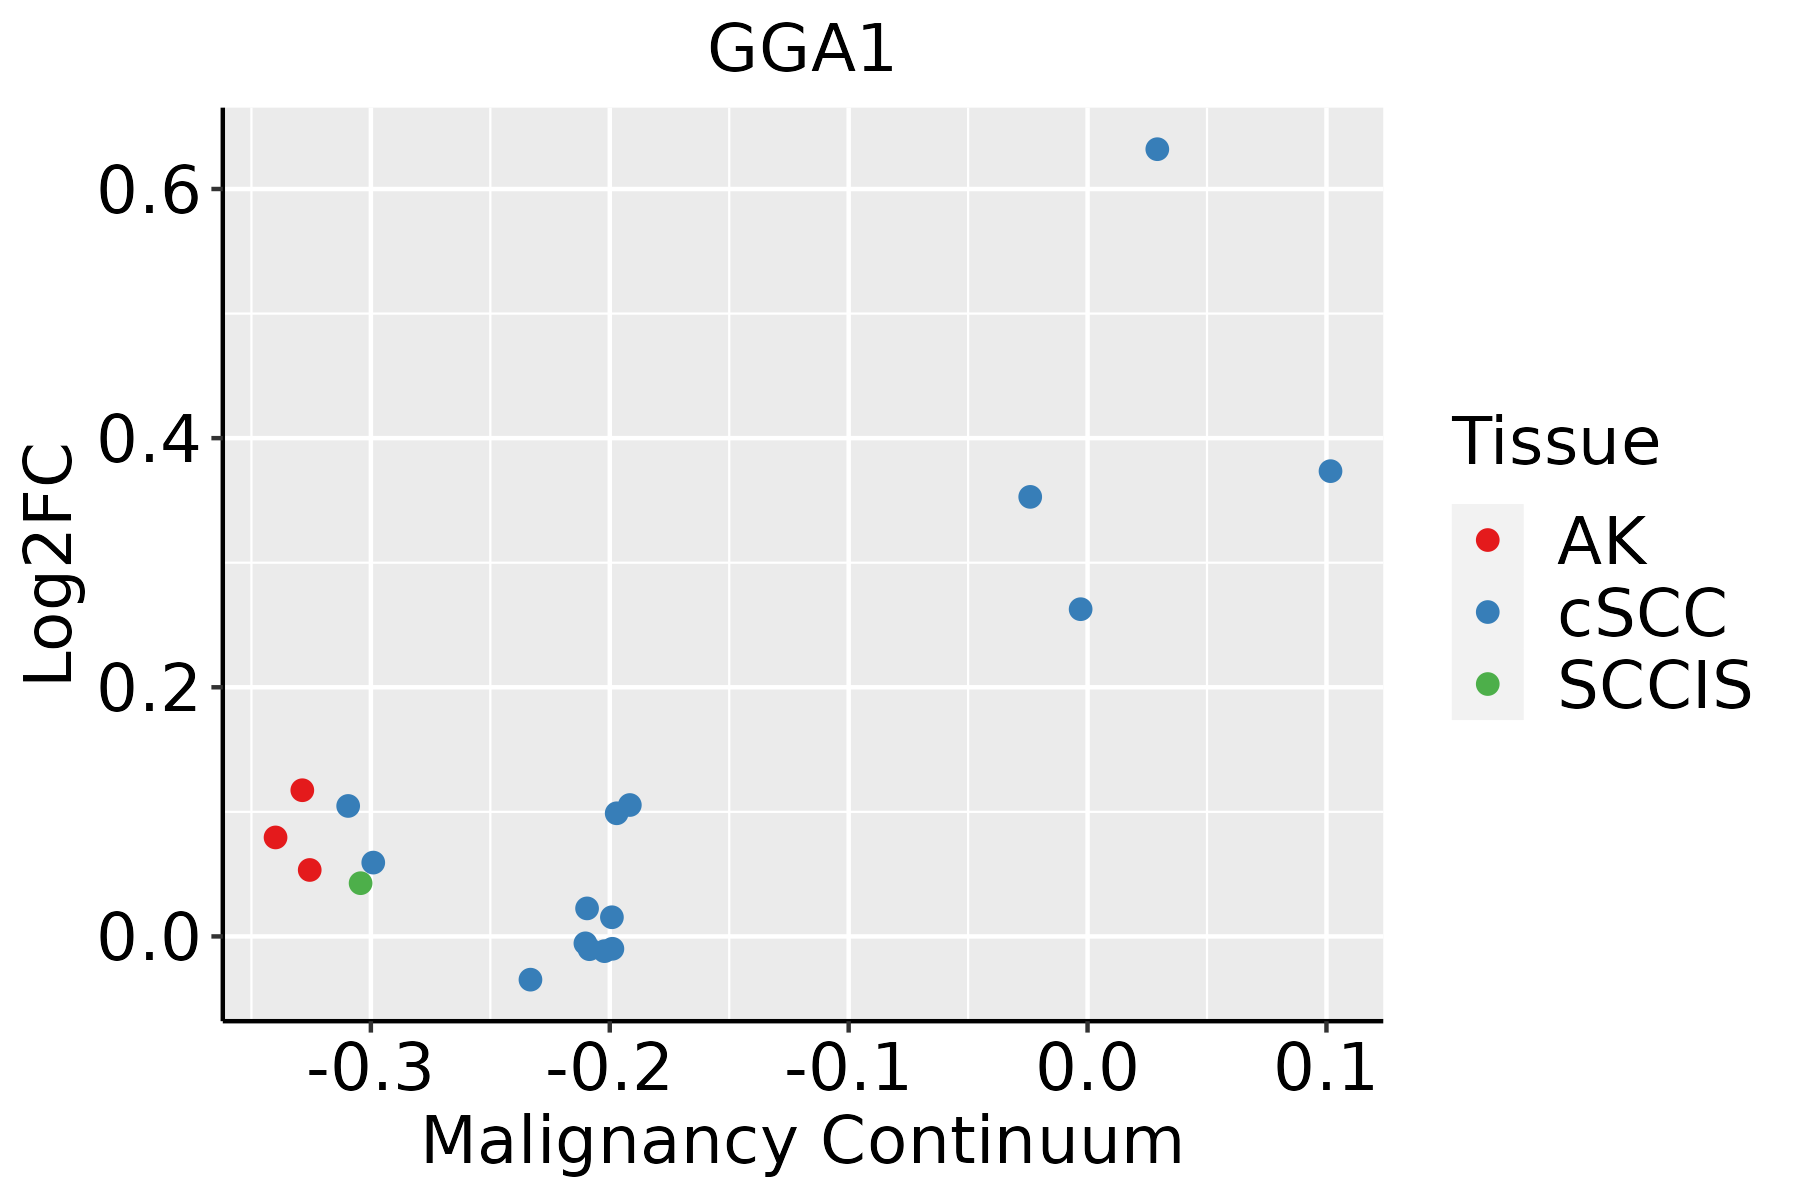 | AK: Actinic keratosis |
| cSCC: Cutaneous squamous cell carcinoma | ||
| SCCIS:squamous cell carcinoma in situ | ||
| Thyroid | 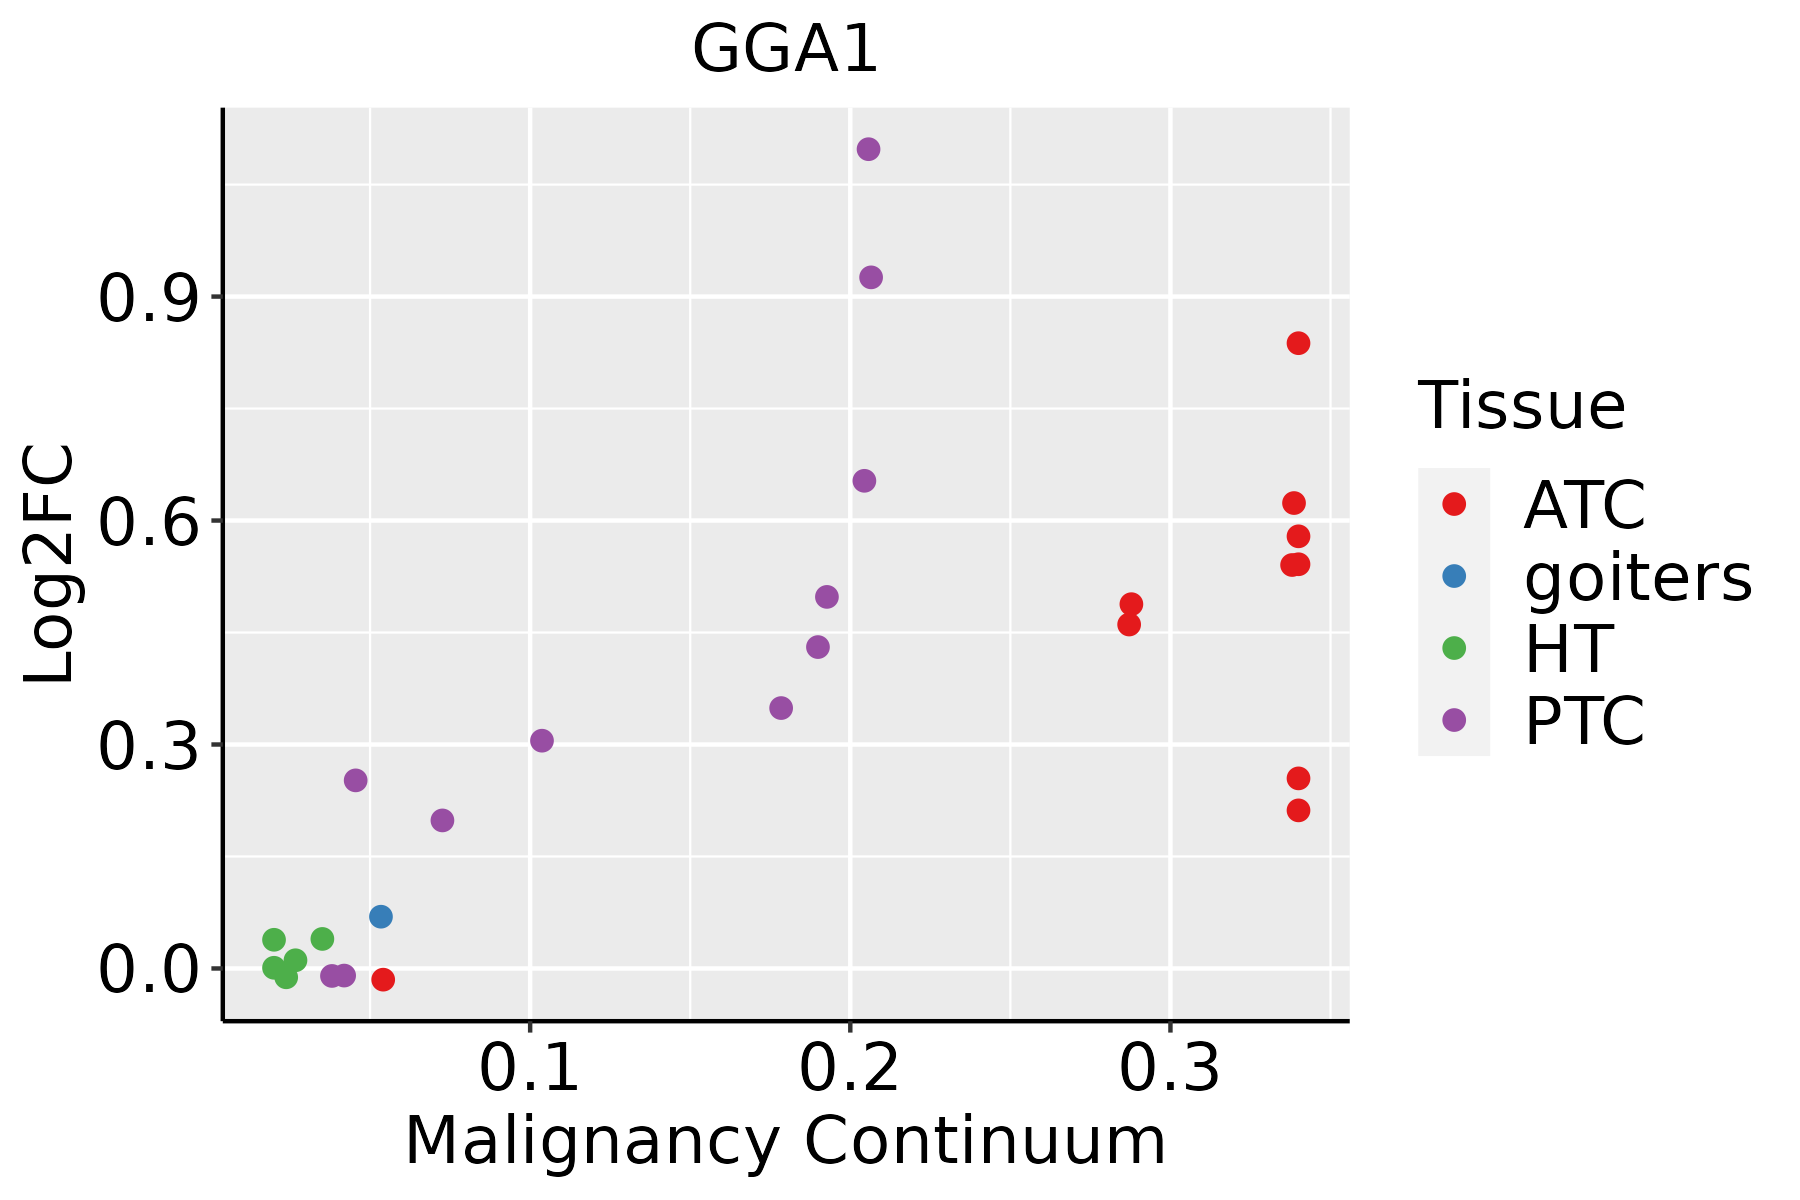 | ATC: Anaplastic thyroid cancer |
| HT: Hashimoto's thyroiditis | ||
| PTC: Papillary thyroid cancer |
| ∗log2FC in expression of this searched gene in stem-like cells from each diseased tissue sample relative to stem-like cells in normal samples in each tissue plotted against the malignancy continuum. Samples are colored based on if they are from different disease stage. |
Top |
Malignant transformation related pathway analysis |
| Find out the enriched GO biological processes and KEGG pathways involved in transition from healthy to precancer to cancer |
| Tissue | Disease Stage | Enriched GO biological Processes |
| Colorectum | CRC |  |
| Stomach | GC |  |
| Stomach | CAG with IM |  |
| Stomach | CSG |  |
| Stomach | CAG |  |
| ∗Top 15 enriched GO BP terms are showed in the bar plot of each disease state in each tissue. Each row represents a significant GO biological process which is colored according to the -log10(p.adjust). |
| Page: 1 2 3 4 5 6 7 8 9 |
| GO ID | Tissue | Disease Stage | Description | Gene Ratio | Bg Ratio | pvalue | p.adjust | Count |
| GO:0042176 | Colorectum | AD | regulation of protein catabolic process | 160/3918 | 391/18723 | 1.06e-19 | 7.34e-17 | 160 |
| GO:0072659 | Colorectum | AD | protein localization to plasma membrane | 122/3918 | 284/18723 | 2.86e-17 | 1.49e-14 | 122 |
| GO:0009896 | Colorectum | AD | positive regulation of catabolic process | 180/3918 | 492/18723 | 4.33e-16 | 1.94e-13 | 180 |
| GO:1990778 | Colorectum | AD | protein localization to cell periphery | 129/3918 | 333/18723 | 5.51e-14 | 1.15e-11 | 129 |
| GO:0045732 | Colorectum | AD | positive regulation of protein catabolic process | 92/3918 | 231/18723 | 3.85e-11 | 4.47e-09 | 92 |
| GO:0090150 | Colorectum | AD | establishment of protein localization to membrane | 100/3918 | 260/18723 | 6.01e-11 | 6.33e-09 | 100 |
| GO:0048193 | Colorectum | AD | Golgi vesicle transport | 109/3918 | 296/18723 | 1.80e-10 | 1.68e-08 | 109 |
| GO:0016197 | Colorectum | AD | endosomal transport | 90/3918 | 230/18723 | 1.88e-10 | 1.73e-08 | 90 |
| GO:0016482 | Colorectum | AD | cytosolic transport | 68/3918 | 168/18723 | 6.00e-09 | 3.72e-07 | 68 |
| GO:0098876 | Colorectum | AD | vesicle-mediated transport to the plasma membrane | 57/3918 | 136/18723 | 2.30e-08 | 1.27e-06 | 57 |
| GO:0061951 | Colorectum | AD | establishment of protein localization to plasma membrane | 31/3918 | 60/18723 | 1.37e-07 | 6.42e-06 | 31 |
| GO:0006892 | Colorectum | AD | post-Golgi vesicle-mediated transport | 45/3918 | 104/18723 | 2.22e-07 | 9.26e-06 | 45 |
| GO:0043001 | Colorectum | AD | Golgi to plasma membrane protein transport | 21/3918 | 40/18723 | 1.03e-05 | 2.40e-04 | 21 |
| GO:0042147 | Colorectum | AD | retrograde transport, endosome to Golgi | 37/3918 | 91/18723 | 1.46e-05 | 3.14e-04 | 37 |
| GO:0006893 | Colorectum | AD | Golgi to plasma membrane transport | 27/3918 | 60/18723 | 2.41e-05 | 4.66e-04 | 27 |
| GO:0034394 | Colorectum | AD | protein localization to cell surface | 24/3918 | 68/18723 | 4.33e-03 | 2.97e-02 | 24 |
| GO:00421761 | Colorectum | SER | regulation of protein catabolic process | 126/2897 | 391/18723 | 5.33e-17 | 2.52e-14 | 126 |
| GO:00726591 | Colorectum | SER | protein localization to plasma membrane | 92/2897 | 284/18723 | 6.36e-13 | 1.86e-10 | 92 |
| GO:00457321 | Colorectum | SER | positive regulation of protein catabolic process | 77/2897 | 231/18723 | 9.91e-12 | 1.90e-09 | 77 |
| GO:00098961 | Colorectum | SER | positive regulation of catabolic process | 132/2897 | 492/18723 | 4.16e-11 | 6.72e-09 | 132 |
| Page: 1 2 3 4 5 6 7 8 9 10 |
| Pathway ID | Tissue | Disease Stage | Description | Gene Ratio | Bg Ratio | pvalue | p.adjust | qvalue | Count |
| hsa04142 | Colorectum | SER | Lysosome | 38/1580 | 132/8465 | 2.87e-03 | 2.03e-02 | 1.47e-02 | 38 |
| hsa041421 | Colorectum | SER | Lysosome | 38/1580 | 132/8465 | 2.87e-03 | 2.03e-02 | 1.47e-02 | 38 |
| hsa0414222 | Esophagus | ESCC | Lysosome | 102/4205 | 132/8465 | 5.11e-11 | 7.13e-10 | 3.65e-10 | 102 |
| hsa0414232 | Esophagus | ESCC | Lysosome | 102/4205 | 132/8465 | 5.11e-11 | 7.13e-10 | 3.65e-10 | 102 |
| hsa041424 | Liver | Cirrhotic | Lysosome | 68/2530 | 132/8465 | 1.34e-07 | 1.97e-06 | 1.21e-06 | 68 |
| hsa0414211 | Liver | Cirrhotic | Lysosome | 68/2530 | 132/8465 | 1.34e-07 | 1.97e-06 | 1.21e-06 | 68 |
| hsa041422 | Liver | HCC | Lysosome | 100/4020 | 132/8465 | 2.32e-11 | 4.31e-10 | 2.40e-10 | 100 |
| hsa041423 | Liver | HCC | Lysosome | 100/4020 | 132/8465 | 2.32e-11 | 4.31e-10 | 2.40e-10 | 100 |
| hsa041425 | Oral cavity | OSCC | Lysosome | 87/3704 | 132/8465 | 1.97e-07 | 1.35e-06 | 6.86e-07 | 87 |
| hsa0414212 | Oral cavity | OSCC | Lysosome | 87/3704 | 132/8465 | 1.97e-07 | 1.35e-06 | 6.86e-07 | 87 |
| hsa0414221 | Oral cavity | LP | Lysosome | 67/2418 | 132/8465 | 5.13e-08 | 7.77e-07 | 5.01e-07 | 67 |
| hsa0414231 | Oral cavity | LP | Lysosome | 67/2418 | 132/8465 | 5.13e-08 | 7.77e-07 | 5.01e-07 | 67 |
| Page: 1 |
Top |
Cell-cell communication analysis |
| Identification of potential cell-cell interactions between two cell types and their ligand-receptor pairs for different disease states |
| Ligand | Receptor | LRpair | Pathway | Tissue | Disease Stage |
| Page: 1 |
Top |
Single-cell gene regulatory network inference analysis |
| Find out the significant the regulons (TFs) and the target genes of each regulon across cell types for different disease states |
| TF | Cell Type | Tissue | Disease Stage | Target Gene | RSS | Regulon Activity |
| ∗The dot plots of a searched regulon are shown for all cell subpopulations in each disease state of each tissue based on the regulon specific score inferred using pySCENIC and by calculating the average expression. |
| Page: 1 |
Top |
Somatic mutation of malignant transformation related genes |
| Annotation of somatic variants for genes involved in malignant transformation |
| Hugo Symbol | Variant Class | Variant Classification | dbSNP RS | HGVSc | HGVSp | HGVSp Short | SWISSPROT | BIOTYPE | SIFT | PolyPhen | Tumor Sample Barcode | Tissue | Histology | Sex | Age | Stage | Therapy Types | Drugs | Outcome |
| GGA1 | SNV | Missense_Mutation | rs368649058 | c.736N>A | p.Glu246Lys | p.E246K | Q9UJY5 | protein_coding | tolerated(0.14) | benign(0.013) | TCGA-C8-A12Q-01 | Breast | breast invasive carcinoma | Female | >=65 | III/IV | Unknown | Unknown | PD |
| GGA1 | SNV | Missense_Mutation | rs771955351 | c.203N>T | p.Thr68Met | p.T68M | Q9UJY5 | protein_coding | tolerated(0.06) | possibly_damaging(0.643) | TCGA-C8-A26X-01 | Breast | breast invasive carcinoma | Female | <65 | I/II | Chemotherapy | 5-fluorouracil | CR |
| GGA1 | SNV | Missense_Mutation | c.574N>A | p.Ala192Thr | p.A192T | Q9UJY5 | protein_coding | deleterious(0.01) | benign(0.166) | TCGA-D8-A1XQ-01 | Breast | breast invasive carcinoma | Female | >=65 | I/II | Unknown | Unknown | SD | |
| GGA1 | SNV | Missense_Mutation | c.1534N>G | p.Ile512Val | p.I512V | Q9UJY5 | protein_coding | tolerated(0.47) | benign(0) | TCGA-D8-A1XQ-01 | Breast | breast invasive carcinoma | Female | >=65 | I/II | Unknown | Unknown | SD | |
| GGA1 | insertion | Nonsense_Mutation | novel | c.694_695insTCTGGTGAGGGGTTTGGAAACCCAGGTTCCTGGGCCATCTC | p.Met233TrpfsTer2 | p.M233Wfs*2 | Q9UJY5 | protein_coding | TCGA-A8-A095-01 | Breast | breast invasive carcinoma | Female | <65 | I/II | Chemotherapy | 5-fluorouracil | CR | ||
| GGA1 | deletion | Frame_Shift_Del | c.1890delN | p.Pro632HisfsTer59 | p.P632Hfs*59 | Q9UJY5 | protein_coding | TCGA-BH-A18G-01 | Breast | breast invasive carcinoma | Female | >=65 | I/II | Unknown | Unknown | SD | |||
| GGA1 | SNV | Missense_Mutation | c.1058C>T | p.Ser353Leu | p.S353L | Q9UJY5 | protein_coding | deleterious(0.04) | benign(0.049) | TCGA-LP-A4AV-01 | Cervix | cervical & endocervical cancer | Female | <65 | I/II | Unknown | Unknown | SD | |
| GGA1 | SNV | Missense_Mutation | novel | c.1474N>T | p.Pro492Ser | p.P492S | Q9UJY5 | protein_coding | tolerated(0.34) | benign(0) | TCGA-VS-A9U6-01 | Cervix | cervical & endocervical cancer | Female | <65 | I/II | Chemotherapy | cisplatin | PD |
| GGA1 | SNV | Missense_Mutation | rs765255006 | c.715G>A | p.Gly239Ser | p.G239S | Q9UJY5 | protein_coding | tolerated(0.34) | benign(0.234) | TCGA-A6-6653-01 | Colorectum | colon adenocarcinoma | Male | >=65 | I/II | Unknown | Unknown | SD |
| GGA1 | SNV | Missense_Mutation | rs766603973 | c.253N>A | p.Val85Met | p.V85M | Q9UJY5 | protein_coding | deleterious(0.02) | probably_damaging(0.937) | TCGA-AA-3821-01 | Colorectum | colon adenocarcinoma | Female | >=65 | I/II | Unknown | Unknown | SD |
| Page: 1 2 3 4 5 6 |
Top |
Related drugs of malignant transformation related genes |
| Identification of chemicals and drugs interact with genes involved in malignant transfromation |
| (DGIdb 4.0) |
| Entrez ID | Symbol | Category | Interaction Types | Drug Claim Name | Drug Name | PMIDs |
| Page: 1 |

Copyright 2023-Present -The University of Texas Health Science Center at Houston |