
|
|||||
|
 | |
| |
| |
| |
| |
| |
|
Gene: GATA3-AS1 |
Gene summary for GATA3-AS1 |
| Gene information | Species | Human | Gene symbol | GATA3-AS1 | Gene ID | 399717 |
| Gene name | GATA3 antisense RNA 1 | |
| Gene Alias | GATA3-AS1 | |
| Cytomap | 10p14 | |
| Gene Type | ncRNA | GO ID | NA | UniProtAcc | NA |
Top |
Malignant transformation analysis |
| Identification of the aberrant gene expression in precancerous and cancerous lesions by comparing the gene expression of stem-like cells in diseased tissues with normal stem cells |
| Entrez ID | Symbol | Replicates | Species | Organ | Tissue | Adj P-value | Log2FC | Malignancy |
| 399717 | GATA3-AS1 | GSM4909293 | Human | Breast | IDC | 4.47e-30 | 5.33e-01 | 0.1581 |
| 399717 | GATA3-AS1 | GSM4909296 | Human | Breast | IDC | 1.56e-03 | 2.54e-01 | 0.1524 |
| 399717 | GATA3-AS1 | GSM4909298 | Human | Breast | IDC | 4.91e-35 | 5.56e-01 | 0.1551 |
| 399717 | GATA3-AS1 | GSM4909301 | Human | Breast | IDC | 3.68e-43 | 8.29e-01 | 0.1577 |
| 399717 | GATA3-AS1 | GSM4909302 | Human | Breast | IDC | 3.11e-10 | 3.77e-01 | 0.1545 |
| 399717 | GATA3-AS1 | GSM4909304 | Human | Breast | IDC | 1.04e-32 | 5.14e-01 | 0.1636 |
| 399717 | GATA3-AS1 | GSM4909306 | Human | Breast | IDC | 1.16e-34 | 6.71e-01 | 0.1564 |
| 399717 | GATA3-AS1 | GSM4909307 | Human | Breast | IDC | 1.66e-26 | 5.93e-01 | 0.1569 |
| 399717 | GATA3-AS1 | GSM4909308 | Human | Breast | IDC | 1.00e-57 | 8.99e-01 | 0.158 |
| 399717 | GATA3-AS1 | GSM4909319 | Human | Breast | IDC | 1.95e-07 | 2.86e-01 | 0.1563 |
| 399717 | GATA3-AS1 | M1 | Human | Breast | IDC | 7.82e-23 | 6.36e-01 | 0.1577 |
| 399717 | GATA3-AS1 | M5 | Human | Breast | IDC | 7.82e-05 | 5.31e-01 | 0.1598 |
| 399717 | GATA3-AS1 | NCCBC3 | Human | Breast | DCIS | 6.10e-03 | 2.39e-01 | 0.1198 |
| 399717 | GATA3-AS1 | DCIS2 | Human | Breast | DCIS | 3.39e-09 | -1.94e-02 | 0.0085 |
| Page: 1 |
| Tissue | Expression Dynamics | Abbreviation |
| Breast | 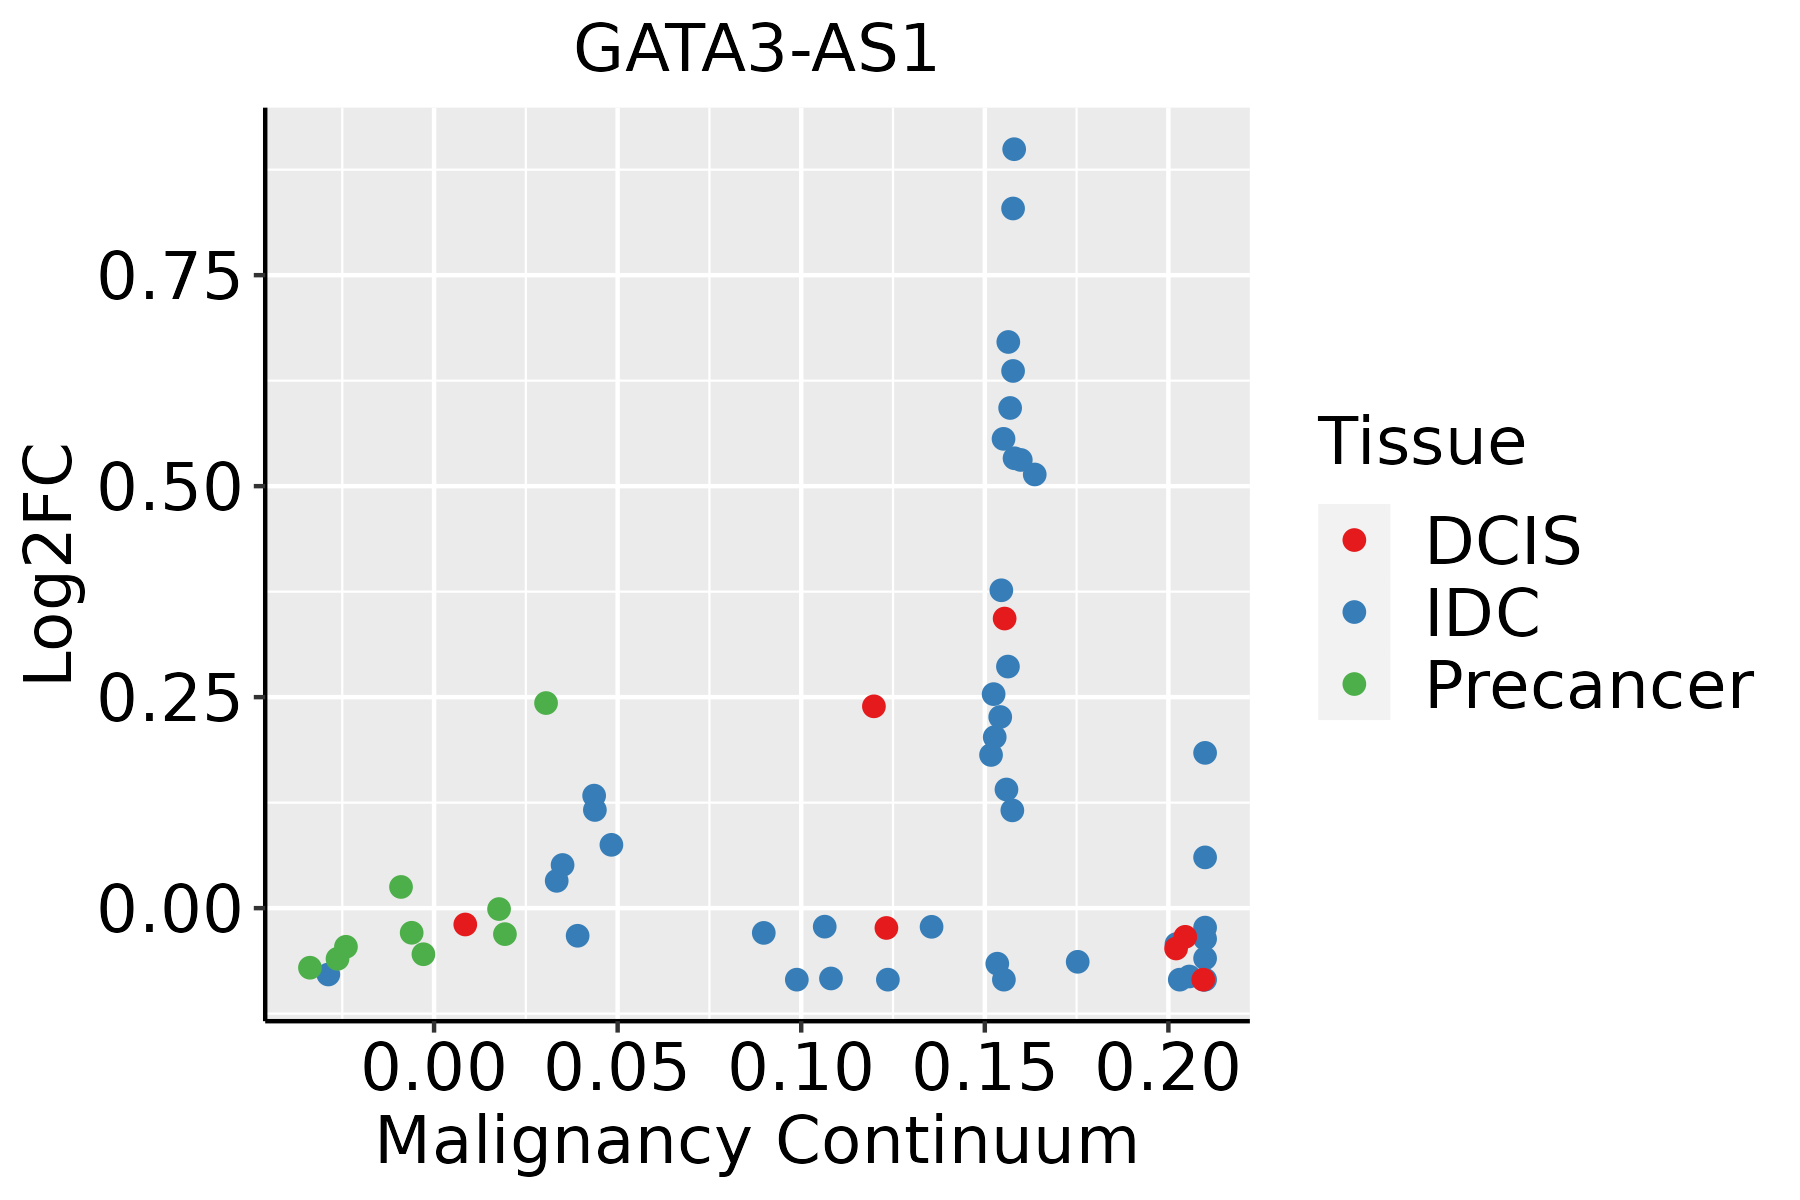 | IDC: Invasive ductal carcinoma |
| DCIS: Ductal carcinoma in situ | ||
| Precancer(BRCA1-mut): Precancerous lesion from BRCA1 mutation carriers |
| ∗log2FC in expression of this searched gene in stem-like cells from each diseased tissue sample relative to stem-like cells in normal samples in each tissue plotted against the malignancy continuum. Samples are colored based on if they are from different disease stage. |
Top |
Malignant transformation related pathway analysis |
| Find out the enriched GO biological processes and KEGG pathways involved in transition from healthy to precancer to cancer |
| Tissue | Disease Stage | Enriched GO biological Processes |
| Colorectum | CRC |  |
| Stomach | GC |  |
| Stomach | CAG with IM |  |
| Stomach | CSG |  |
| Stomach | CAG |  |
| ∗Top 15 enriched GO BP terms are showed in the bar plot of each disease state in each tissue. Each row represents a significant GO biological process which is colored according to the -log10(p.adjust). |
| Page: 1 2 3 4 5 6 7 8 9 |
| GO ID | Tissue | Disease Stage | Description | Gene Ratio | Bg Ratio | pvalue | p.adjust | Count |
| Page: 1 |
| Pathway ID | Tissue | Disease Stage | Description | Gene Ratio | Bg Ratio | pvalue | p.adjust | qvalue | Count |
| Page: 1 |
Top |
Cell-cell communication analysis |
| Identification of potential cell-cell interactions between two cell types and their ligand-receptor pairs for different disease states |
| Ligand | Receptor | LRpair | Pathway | Tissue | Disease Stage |
| Page: 1 |
Top |
Single-cell gene regulatory network inference analysis |
| Find out the significant the regulons (TFs) and the target genes of each regulon across cell types for different disease states |
| TF | Cell Type | Tissue | Disease Stage | Target Gene | RSS | Regulon Activity |
| ∗The dot plots of a searched regulon are shown for all cell subpopulations in each disease state of each tissue based on the regulon specific score inferred using pySCENIC and by calculating the average expression. |
| Page: 1 |
Top |
Somatic mutation of malignant transformation related genes |
| Annotation of somatic variants for genes involved in malignant transformation |
| Hugo Symbol | Variant Class | Variant Classification | dbSNP RS | HGVSc | HGVSp | HGVSp Short | SWISSPROT | BIOTYPE | SIFT | PolyPhen | Tumor Sample Barcode | Tissue | Histology | Sex | Age | Stage | Therapy Types | Drugs | Outcome |
| Page: 1 |
Top |
Related drugs of malignant transformation related genes |
| Identification of chemicals and drugs interact with genes involved in malignant transfromation |
| (DGIdb 4.0) |
| Entrez ID | Symbol | Category | Interaction Types | Drug Claim Name | Drug Name | PMIDs |
| Page: 1 |

Copyright 2023-Present -The University of Texas Health Science Center at Houston |