
|
|||||
|
 | |
| |
| |
| |
| |
| |
|
Gene: FUT6 |
Gene summary for FUT6 |
| Gene information | Species | Human | Gene symbol | FUT6 | Gene ID | 2528 |
| Gene name | fucosyltransferase 6 | |
| Gene Alias | FCT3A | |
| Cytomap | 19p13.3 | |
| Gene Type | protein-coding | GO ID | GO:0005975 | UniProtAcc | P51993 |
Top |
Malignant transformation analysis |
| Identification of the aberrant gene expression in precancerous and cancerous lesions by comparing the gene expression of stem-like cells in diseased tissues with normal stem cells |
| Entrez ID | Symbol | Replicates | Species | Organ | Tissue | Adj P-value | Log2FC | Malignancy |
| 2528 | FUT6 | LZE22D1 | Human | Esophagus | HGIN | 5.85e-09 | 3.43e-01 | 0.0595 |
| 2528 | FUT6 | LZE24T | Human | Esophagus | ESCC | 3.47e-02 | 1.53e-01 | 0.0596 |
| 2528 | FUT6 | P1T-E | Human | Esophagus | ESCC | 3.92e-08 | 1.39e+00 | 0.0875 |
| 2528 | FUT6 | P8T-E | Human | Esophagus | ESCC | 1.44e-32 | 6.46e-01 | 0.0889 |
| 2528 | FUT6 | P23T-E | Human | Esophagus | ESCC | 6.49e-12 | 1.12e+00 | 0.108 |
| 2528 | FUT6 | P37T-E | Human | Esophagus | ESCC | 1.98e-02 | -2.77e-02 | 0.1371 |
| 2528 | FUT6 | P39T-E | Human | Esophagus | ESCC | 4.62e-11 | 5.82e-01 | 0.0894 |
| 2528 | FUT6 | P54T-E | Human | Esophagus | ESCC | 5.30e-06 | 4.06e-01 | 0.0975 |
| 2528 | FUT6 | P57T-E | Human | Esophagus | ESCC | 1.71e-11 | 3.69e-01 | 0.0926 |
| 2528 | FUT6 | P75T-E | Human | Esophagus | ESCC | 7.02e-23 | 1.07e+00 | 0.1125 |
| 2528 | FUT6 | P127T-E | Human | Esophagus | ESCC | 2.07e-15 | 5.72e-01 | 0.0826 |
| 2528 | FUT6 | P128T-E | Human | Esophagus | ESCC | 1.32e-48 | 2.04e+00 | 0.1241 |
| 2528 | FUT6 | HCC1_Meng | Human | Liver | HCC | 1.37e-06 | -2.58e-02 | 0.0246 |
| 2528 | FUT6 | HCC2_Meng | Human | Liver | HCC | 2.28e-05 | 9.74e-02 | 0.0107 |
| 2528 | FUT6 | cirrhotic2 | Human | Liver | Cirrhotic | 1.06e-04 | 1.11e-01 | 0.0201 |
| 2528 | FUT6 | HCC1 | Human | Liver | HCC | 3.11e-06 | 1.17e+00 | 0.5336 |
| 2528 | FUT6 | HCC2 | Human | Liver | HCC | 1.96e-21 | 2.24e+00 | 0.5341 |
| 2528 | FUT6 | HCC5 | Human | Liver | HCC | 2.57e-09 | 1.17e+00 | 0.4932 |
| 2528 | FUT6 | S028 | Human | Liver | HCC | 3.74e-09 | 3.93e-01 | 0.2503 |
| 2528 | FUT6 | S029 | Human | Liver | HCC | 7.21e-07 | 3.87e-01 | 0.2581 |
| Page: 1 |
| Tissue | Expression Dynamics | Abbreviation |
| Esophagus | 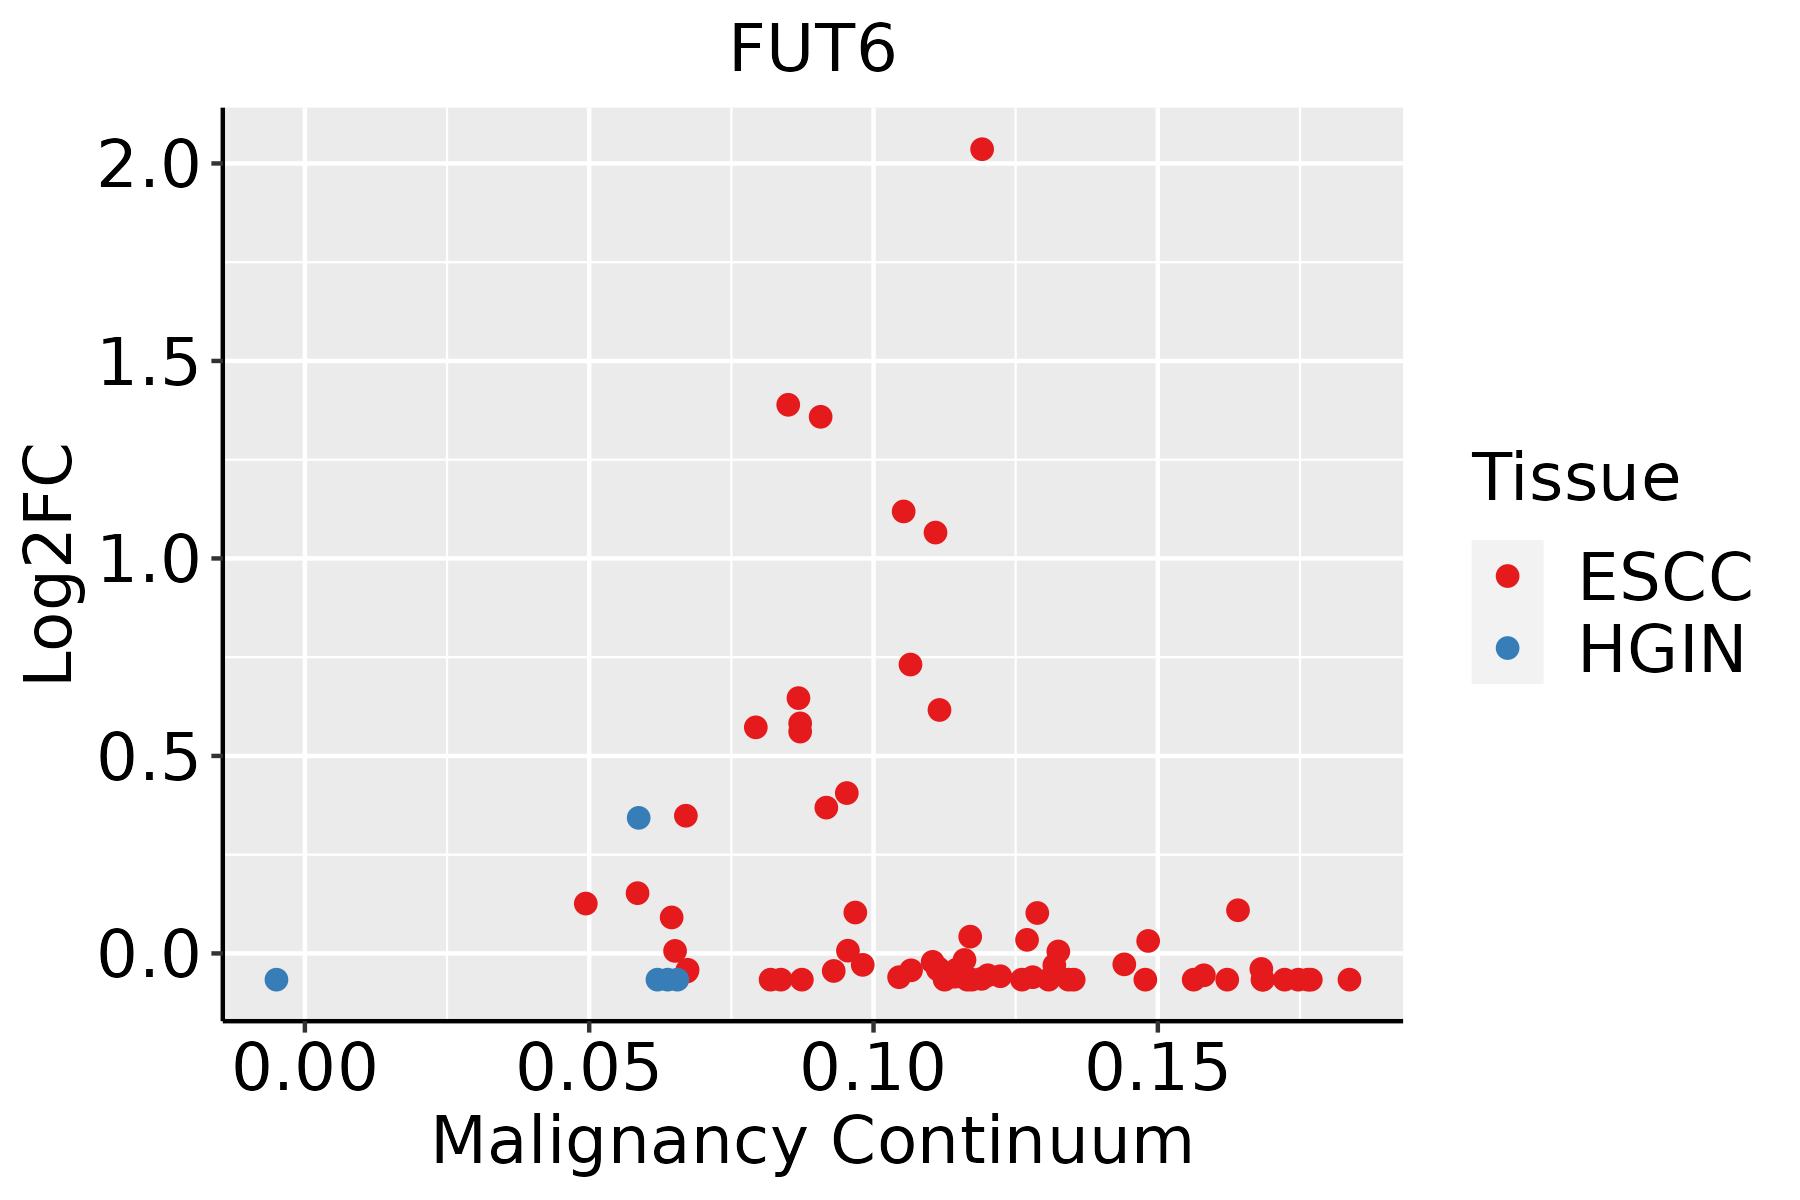 | ESCC: Esophageal squamous cell carcinoma |
| HGIN: High-grade intraepithelial neoplasias | ||
| LGIN: Low-grade intraepithelial neoplasias | ||
| Liver | 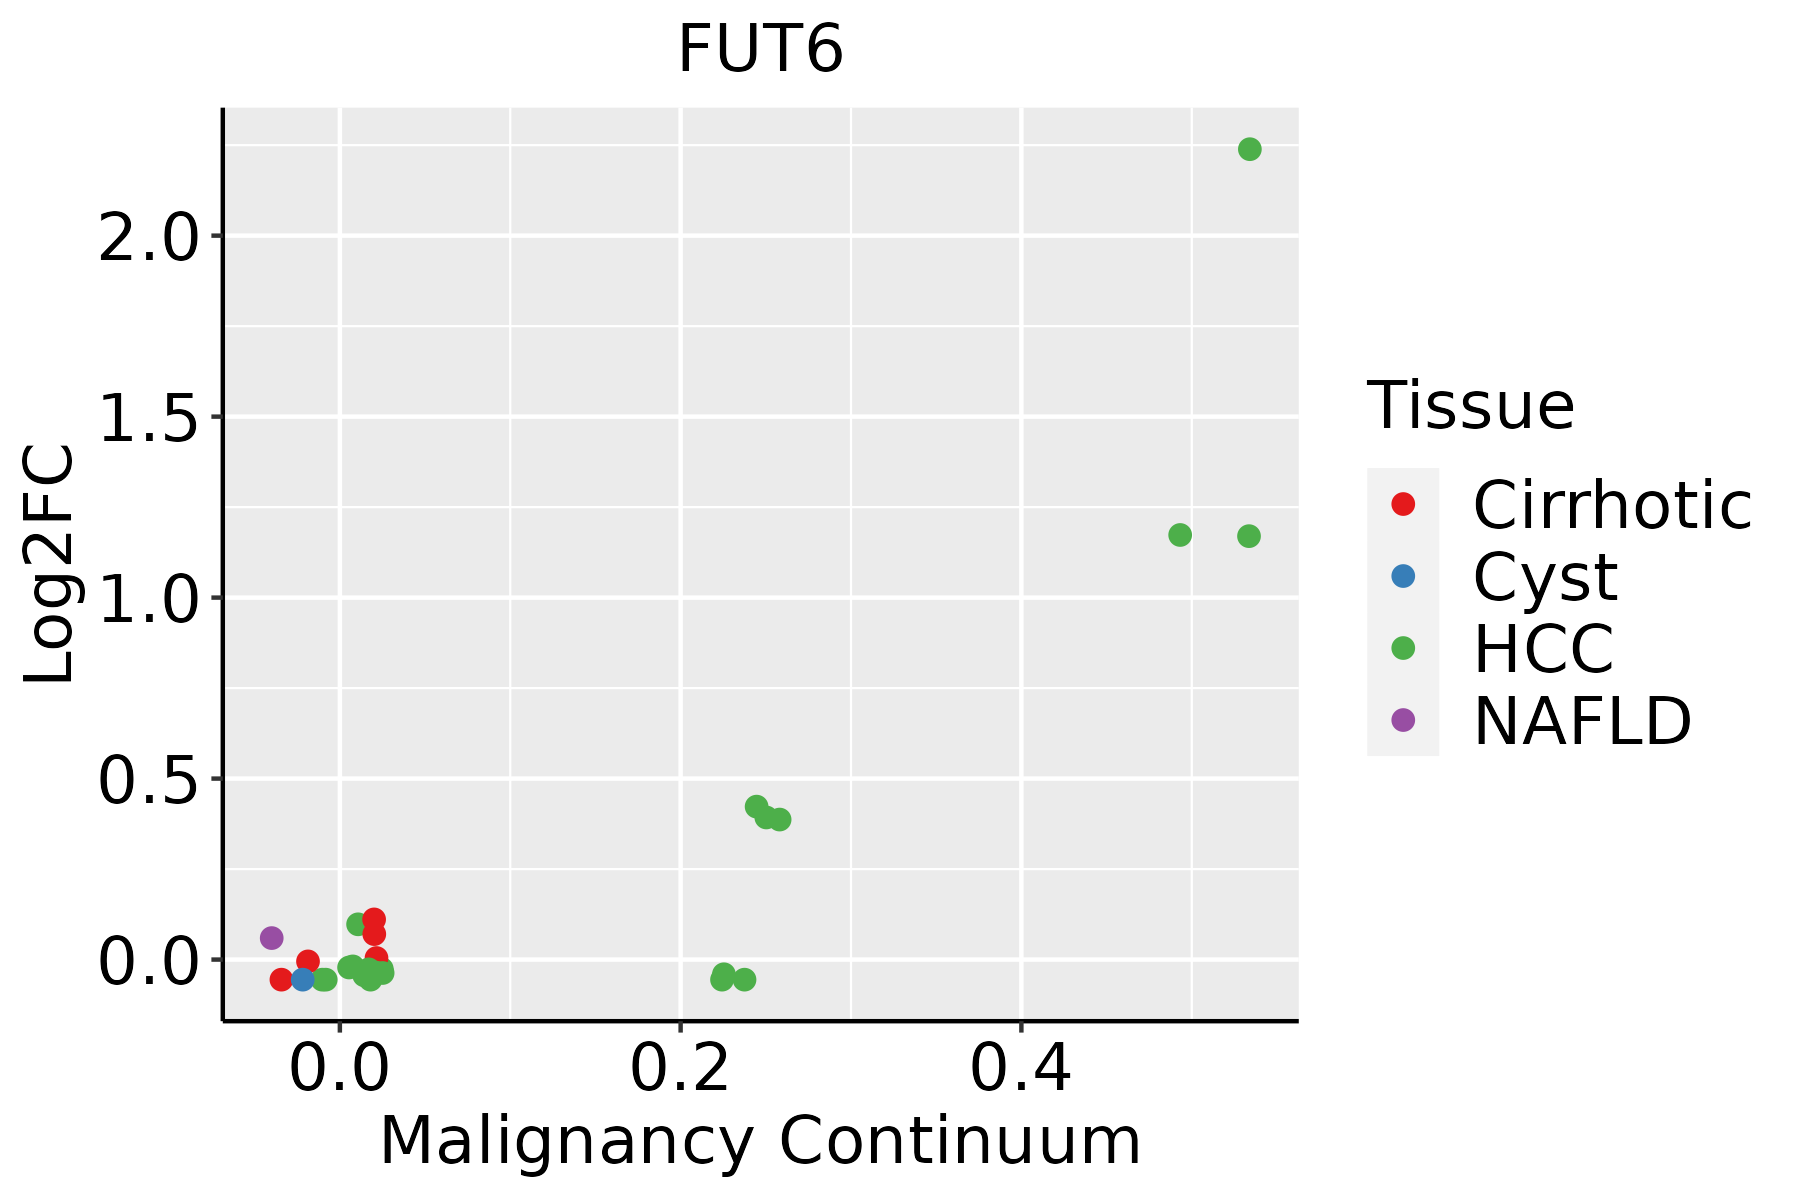 | HCC: Hepatocellular carcinoma |
| NAFLD: Non-alcoholic fatty liver disease |
| ∗log2FC in expression of this searched gene in stem-like cells from each diseased tissue sample relative to stem-like cells in normal samples in each tissue plotted against the malignancy continuum. Samples are colored based on if they are from different disease stage. |
Top |
Malignant transformation related pathway analysis |
| Find out the enriched GO biological processes and KEGG pathways involved in transition from healthy to precancer to cancer |
| Tissue | Disease Stage | Enriched GO biological Processes |
| Colorectum | CRC |  |
| Stomach | GC |  |
| Stomach | CAG with IM |  |
| Stomach | CSG |  |
| Stomach | CAG |  |
| ∗Top 15 enriched GO BP terms are showed in the bar plot of each disease state in each tissue. Each row represents a significant GO biological process which is colored according to the -log10(p.adjust). |
| Page: 1 2 3 4 5 6 7 8 9 |
| GO ID | Tissue | Disease Stage | Description | Gene Ratio | Bg Ratio | pvalue | p.adjust | Count |
| GO:00066433 | Esophagus | ESCC | membrane lipid metabolic process | 130/8552 | 203/18723 | 9.29e-08 | 1.54e-06 | 130 |
| GO:00059969 | Esophagus | ESCC | monosaccharide metabolic process | 159/8552 | 257/18723 | 1.11e-07 | 1.81e-06 | 159 |
| GO:00193189 | Esophagus | ESCC | hexose metabolic process | 147/8552 | 237/18723 | 2.63e-07 | 3.94e-06 | 147 |
| GO:00091002 | Esophagus | ESCC | glycoprotein metabolic process | 226/8552 | 387/18723 | 2.64e-07 | 3.94e-06 | 226 |
| GO:00700854 | Esophagus | ESCC | glycosylation | 144/8552 | 240/18723 | 5.12e-06 | 5.38e-05 | 144 |
| GO:00064865 | Esophagus | ESCC | protein glycosylation | 135/8552 | 226/18723 | 1.36e-05 | 1.24e-04 | 135 |
| GO:00434135 | Esophagus | ESCC | macromolecule glycosylation | 135/8552 | 226/18723 | 1.36e-05 | 1.24e-04 | 135 |
| GO:00091012 | Esophagus | ESCC | glycoprotein biosynthetic process | 181/8552 | 317/18723 | 2.54e-05 | 2.15e-04 | 181 |
| GO:00066652 | Esophagus | ESCC | sphingolipid metabolic process | 96/8552 | 155/18723 | 3.21e-05 | 2.66e-04 | 96 |
| GO:00160514 | Esophagus | ESCC | carbohydrate biosynthetic process | 117/8552 | 202/18723 | 2.96e-04 | 1.79e-03 | 117 |
| GO:001605216 | Esophagus | ESCC | carbohydrate catabolic process | 91/8552 | 154/18723 | 5.39e-04 | 2.97e-03 | 91 |
| GO:00442827 | Esophagus | ESCC | small molecule catabolic process | 201/8552 | 376/18723 | 1.35e-03 | 6.41e-03 | 201 |
| GO:00066721 | Esophagus | ESCC | ceramide metabolic process | 61/8552 | 102/18723 | 2.82e-03 | 1.19e-02 | 61 |
| GO:004428211 | Liver | Cirrhotic | small molecule catabolic process | 151/4634 | 376/18723 | 2.20e-11 | 1.34e-09 | 151 |
| GO:000599612 | Liver | Cirrhotic | monosaccharide metabolic process | 104/4634 | 257/18723 | 1.74e-08 | 6.32e-07 | 104 |
| GO:001931812 | Liver | Cirrhotic | hexose metabolic process | 97/4634 | 237/18723 | 2.67e-08 | 9.16e-07 | 97 |
| GO:001605212 | Liver | Cirrhotic | carbohydrate catabolic process | 66/4634 | 154/18723 | 6.10e-07 | 1.32e-05 | 66 |
| GO:00160511 | Liver | Cirrhotic | carbohydrate biosynthetic process | 73/4634 | 202/18723 | 1.91e-04 | 1.77e-03 | 73 |
| GO:0006643 | Liver | Cirrhotic | membrane lipid metabolic process | 69/4634 | 203/18723 | 1.89e-03 | 1.19e-02 | 69 |
| GO:000599621 | Liver | HCC | monosaccharide metabolic process | 167/7958 | 257/18723 | 2.31e-13 | 1.25e-11 | 167 |
| Page: 1 2 |
| Pathway ID | Tissue | Disease Stage | Description | Gene Ratio | Bg Ratio | pvalue | p.adjust | qvalue | Count |
| Page: 1 |
Top |
Cell-cell communication analysis |
| Identification of potential cell-cell interactions between two cell types and their ligand-receptor pairs for different disease states |
| Ligand | Receptor | LRpair | Pathway | Tissue | Disease Stage |
| Page: 1 |
Top |
Single-cell gene regulatory network inference analysis |
| Find out the significant the regulons (TFs) and the target genes of each regulon across cell types for different disease states |
| TF | Cell Type | Tissue | Disease Stage | Target Gene | RSS | Regulon Activity |
| ∗The dot plots of a searched regulon are shown for all cell subpopulations in each disease state of each tissue based on the regulon specific score inferred using pySCENIC and by calculating the average expression. |
| Page: 1 |
Top |
Somatic mutation of malignant transformation related genes |
| Annotation of somatic variants for genes involved in malignant transformation |
| Hugo Symbol | Variant Class | Variant Classification | dbSNP RS | HGVSc | HGVSp | HGVSp Short | SWISSPROT | BIOTYPE | SIFT | PolyPhen | Tumor Sample Barcode | Tissue | Histology | Sex | Age | Stage | Therapy Types | Drugs | Outcome |
| FUT6 | SNV | Missense_Mutation | c.324C>G | p.His108Gln | p.H108Q | P51993 | protein_coding | deleterious(0) | probably_damaging(0.983) | TCGA-C8-A27B-01 | Breast | breast invasive carcinoma | Female | <65 | I/II | Chemotherapy | 5-fluorouracil | CR | |
| FUT6 | SNV | Missense_Mutation | c.23A>T | p.Lys8Met | p.K8M | P51993 | protein_coding | deleterious(0.03) | benign(0.066) | TCGA-EK-A2R7-01 | Cervix | cervical & endocervical cancer | Female | <65 | I/II | Unknown | Unknown | SD | |
| FUT6 | insertion | Frame_Shift_Ins | novel | c.842_843insAAAT | p.Arg282AsnfsTer117 | p.R282Nfs*117 | P51993 | protein_coding | TCGA-DS-A1OB-01 | Cervix | cervical & endocervical cancer | Female | <65 | I/II | Chemotherapy | carboplatin | PD | ||
| FUT6 | SNV | Missense_Mutation | rs375534466 | c.937N>A | p.Ala313Thr | p.A313T | P51993 | protein_coding | tolerated(0.5) | benign(0.027) | TCGA-AA-3510-01 | Colorectum | colon adenocarcinoma | Male | >=65 | I/II | Unknown | Unknown | SD |
| FUT6 | SNV | Missense_Mutation | c.682N>A | p.Leu228Met | p.L228M | P51993 | protein_coding | deleterious(0) | probably_damaging(0.991) | TCGA-AA-3710-01 | Colorectum | colon adenocarcinoma | Female | >=65 | I/II | Unknown | Unknown | SD | |
| FUT6 | SNV | Missense_Mutation | rs375534466 | c.937N>A | p.Ala313Thr | p.A313T | P51993 | protein_coding | tolerated(0.5) | benign(0.027) | TCGA-AA-3966-01 | Colorectum | colon adenocarcinoma | Female | >=65 | I/II | Unknown | Unknown | SD |
| FUT6 | SNV | Missense_Mutation | c.353N>A | p.Ala118Asp | p.A118D | P51993 | protein_coding | tolerated(0.24) | benign(0.014) | TCGA-G4-6302-01 | Colorectum | colon adenocarcinoma | Female | >=65 | I/II | Unknown | Unknown | SD | |
| FUT6 | SNV | Missense_Mutation | rs112849079 | c.172N>A | p.Ala58Thr | p.A58T | P51993 | protein_coding | tolerated(0.64) | benign(0.009) | TCGA-EI-6507-01 | Colorectum | rectum adenocarcinoma | Male | <65 | I/II | Unknown | Unknown | SD |
| FUT6 | SNV | Missense_Mutation | rs201524447 | c.103C>T | p.Arg35Cys | p.R35C | P51993 | protein_coding | deleterious(0.01) | probably_damaging(0.939) | TCGA-AJ-A3EK-01 | Endometrium | uterine corpus endometrioid carcinoma | Female | <65 | I/II | Chemotherapy | carboplatin | CR |
| FUT6 | SNV | Missense_Mutation | rs144398741 | c.620G>A | p.Arg207His | p.R207H | P51993 | protein_coding | deleterious(0.04) | benign(0.015) | TCGA-AJ-A3EL-01 | Endometrium | uterine corpus endometrioid carcinoma | Female | <65 | I/II | Unknown | Unknown | SD |
| Page: 1 2 3 4 5 |
Top |
Related drugs of malignant transformation related genes |
| Identification of chemicals and drugs interact with genes involved in malignant transfromation |
| (DGIdb 4.0) |
| Entrez ID | Symbol | Category | Interaction Types | Drug Claim Name | Drug Name | PMIDs |
| Page: 1 |

Copyright 2023-Present -The University of Texas Health Science Center at Houston |