
|
|||||
|
 | |
| |
| |
| |
| |
| |
|
Gene: EPAS1 |
Gene summary for EPAS1 |
| Gene information | Species | Human | Gene symbol | EPAS1 | Gene ID | 2034 |
| Gene name | endothelial PAS domain protein 1 | |
| Gene Alias | ECYT4 | |
| Cytomap | 2p21 | |
| Gene Type | protein-coding | GO ID | GO:0000003 | UniProtAcc | B3KW07 |
Top |
Malignant transformation analysis |
| Identification of the aberrant gene expression in precancerous and cancerous lesions by comparing the gene expression of stem-like cells in diseased tissues with normal stem cells |
| Entrez ID | Symbol | Replicates | Species | Organ | Tissue | Adj P-value | Log2FC | Malignancy |
| 2034 | EPAS1 | HTA11_2487_2000001011 | Human | Colorectum | SER | 8.76e-11 | 6.54e-01 | -0.1808 |
| 2034 | EPAS1 | HTA11_1938_2000001011 | Human | Colorectum | AD | 1.05e-11 | 6.80e-01 | -0.0811 |
| 2034 | EPAS1 | HTA11_78_2000001011 | Human | Colorectum | AD | 8.74e-06 | 4.87e-01 | -0.1088 |
| 2034 | EPAS1 | HTA11_347_2000001011 | Human | Colorectum | AD | 3.64e-17 | 7.42e-01 | -0.1954 |
| 2034 | EPAS1 | HTA11_411_2000001011 | Human | Colorectum | SER | 2.72e-05 | 7.73e-01 | -0.2602 |
| 2034 | EPAS1 | HTA11_83_2000001011 | Human | Colorectum | SER | 5.77e-03 | 4.79e-01 | -0.1526 |
| 2034 | EPAS1 | HTA11_1391_2000001011 | Human | Colorectum | AD | 5.11e-06 | 5.15e-01 | -0.059 |
| 2034 | EPAS1 | HTA11_2992_2000001011 | Human | Colorectum | SER | 3.00e-02 | 3.87e-01 | -0.1706 |
| 2034 | EPAS1 | HTA11_5212_2000001011 | Human | Colorectum | AD | 1.14e-04 | 5.49e-01 | -0.2061 |
| 2034 | EPAS1 | HTA11_99999970781_79442 | Human | Colorectum | MSS | 1.02e-05 | -2.10e-01 | 0.294 |
| 2034 | EPAS1 | A002-C-010 | Human | Colorectum | FAP | 1.46e-03 | -1.24e-01 | 0.242 |
| 2034 | EPAS1 | A015-C-203 | Human | Colorectum | FAP | 7.86e-09 | -1.74e-01 | -0.1294 |
| 2034 | EPAS1 | A001-C-108 | Human | Colorectum | FAP | 9.05e-04 | -1.24e-01 | -0.0272 |
| 2034 | EPAS1 | A002-C-205 | Human | Colorectum | FAP | 4.80e-04 | -2.47e-01 | -0.1236 |
| 2034 | EPAS1 | A015-C-106 | Human | Colorectum | FAP | 1.78e-03 | -1.45e-01 | -0.0511 |
| 2034 | EPAS1 | A015-C-104 | Human | Colorectum | FAP | 2.66e-08 | -2.28e-01 | -0.1899 |
| 2034 | EPAS1 | A001-C-014 | Human | Colorectum | FAP | 2.30e-03 | -1.04e-01 | 0.0135 |
| 2034 | EPAS1 | A002-C-016 | Human | Colorectum | FAP | 2.29e-06 | -1.62e-01 | 0.0521 |
| 2034 | EPAS1 | A002-C-116 | Human | Colorectum | FAP | 2.57e-09 | -1.91e-01 | -0.0452 |
| 2034 | EPAS1 | A014-C-008 | Human | Colorectum | FAP | 1.08e-03 | -2.73e-01 | -0.191 |
| Page: 1 2 3 4 5 6 7 8 9 |
| Tissue | Expression Dynamics | Abbreviation |
| Colorectum (GSE201348) |  | FAP: Familial adenomatous polyposis |
| CRC: Colorectal cancer | ||
| Colorectum (HTA11) |  | AD: Adenomas |
| SER: Sessile serrated lesions | ||
| MSI-H: Microsatellite-high colorectal cancer | ||
| MSS: Microsatellite stable colorectal cancer | ||
| Esophagus | 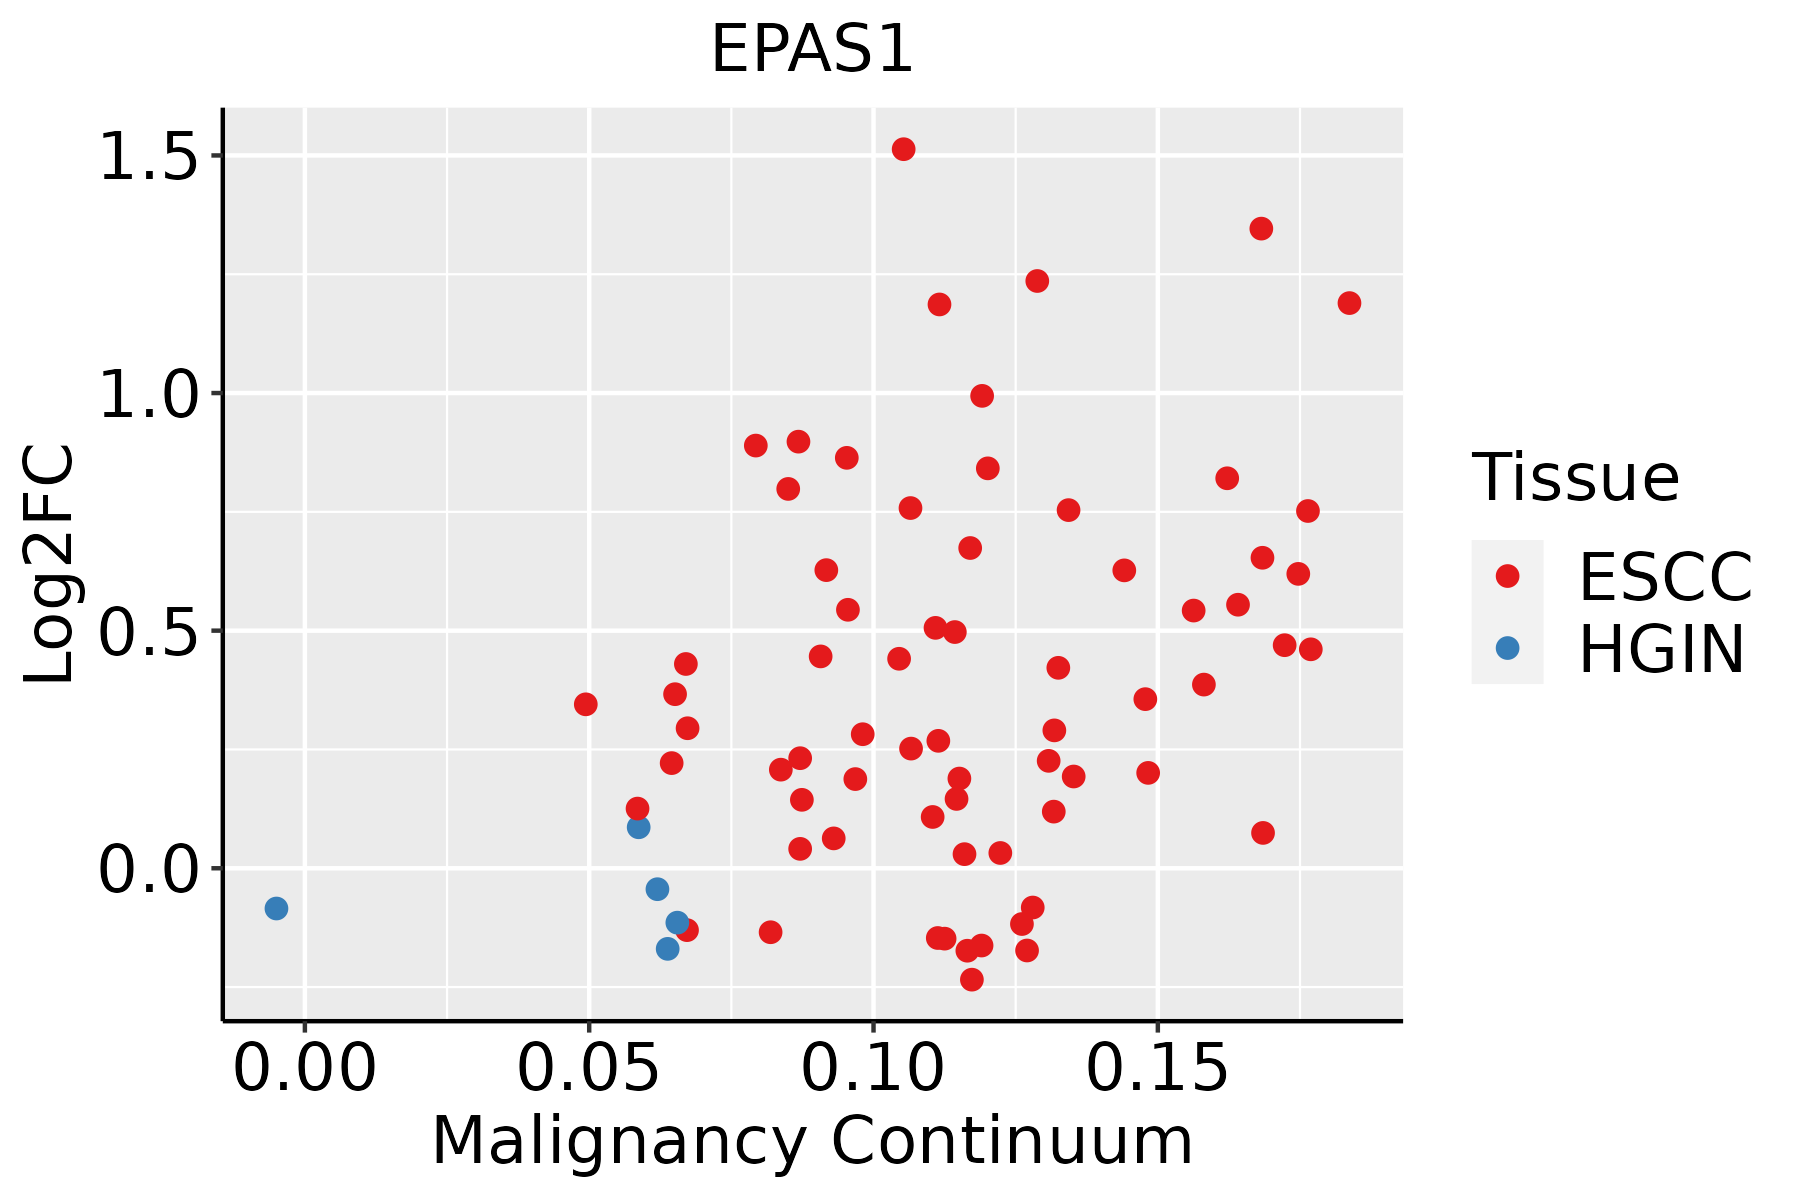 | ESCC: Esophageal squamous cell carcinoma |
| HGIN: High-grade intraepithelial neoplasias | ||
| LGIN: Low-grade intraepithelial neoplasias | ||
| Liver | 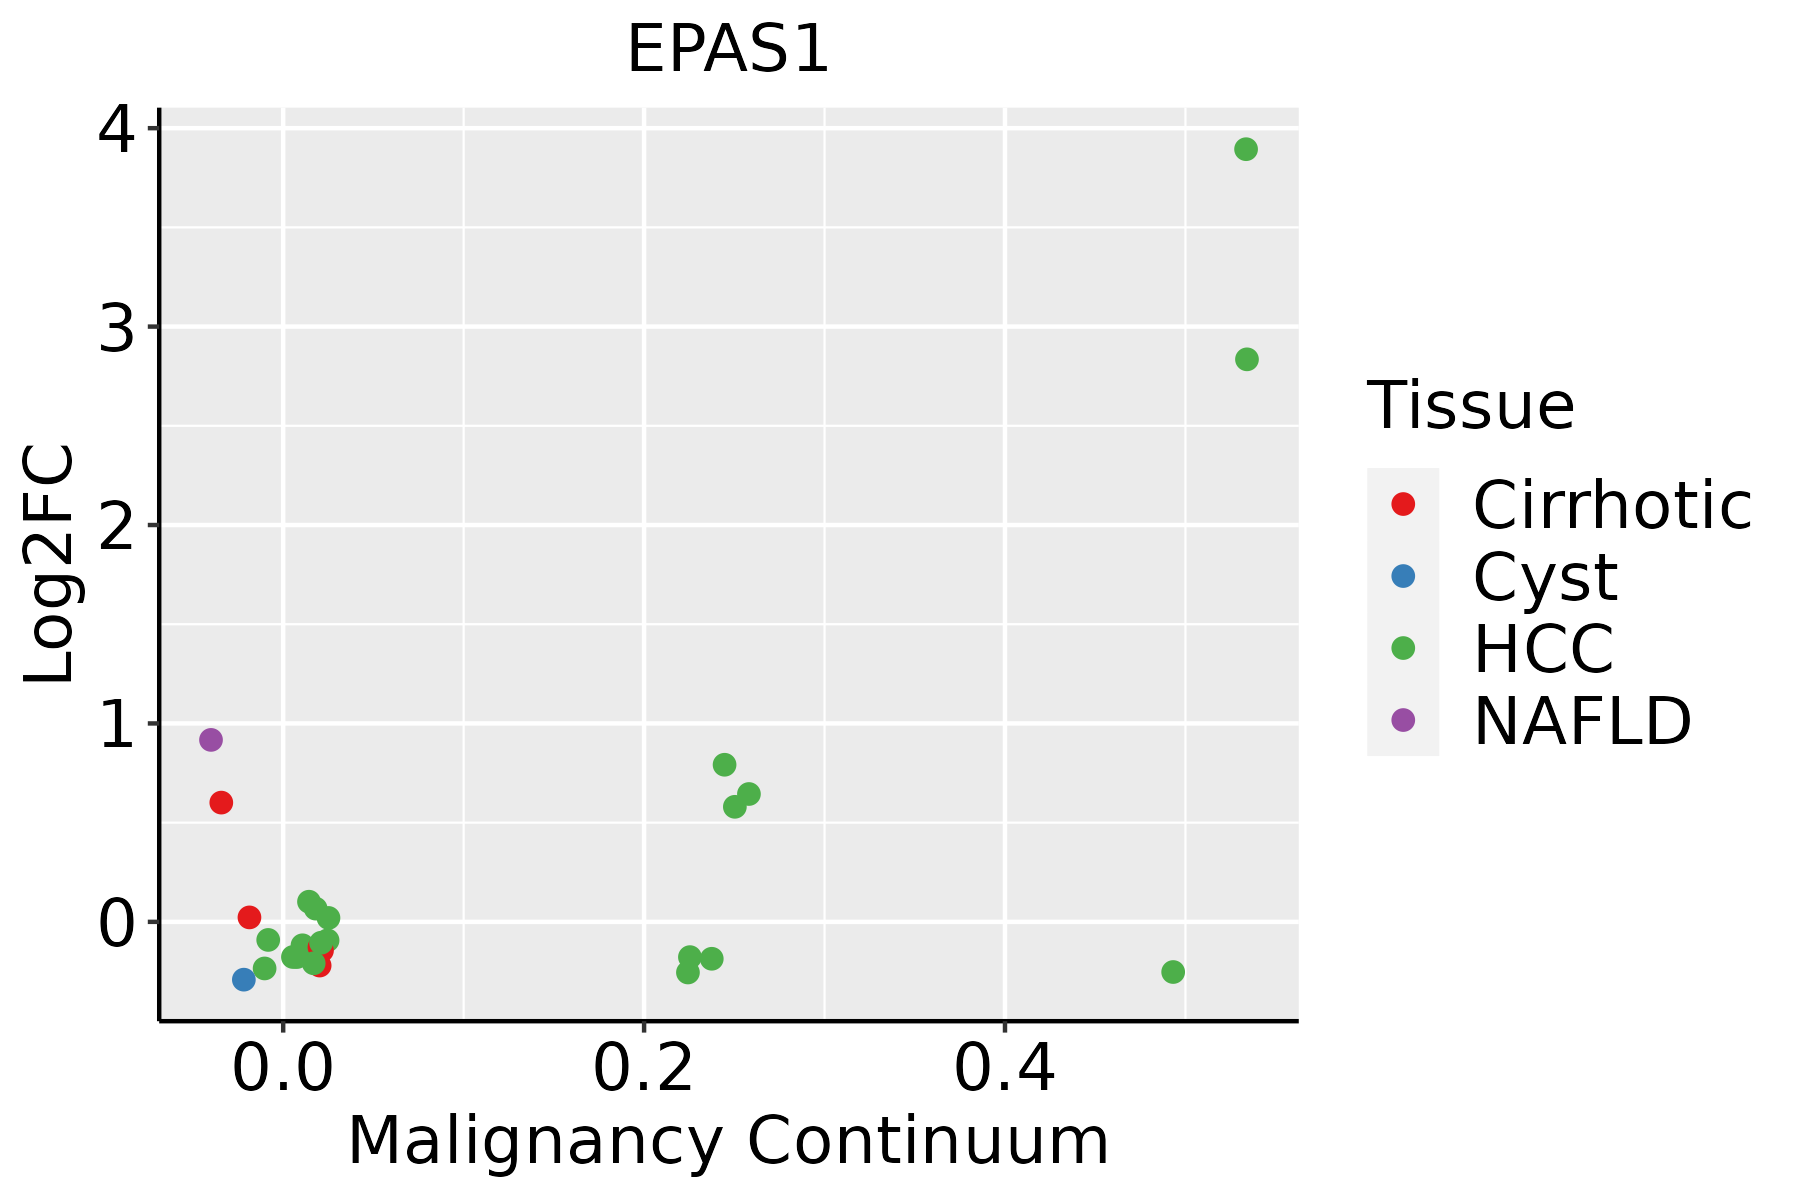 | HCC: Hepatocellular carcinoma |
| NAFLD: Non-alcoholic fatty liver disease | ||
| Lung |  | AAH: Atypical adenomatous hyperplasia |
| AIS: Adenocarcinoma in situ | ||
| IAC: Invasive lung adenocarcinoma | ||
| MIA: Minimally invasive adenocarcinoma | ||
| Oral Cavity | 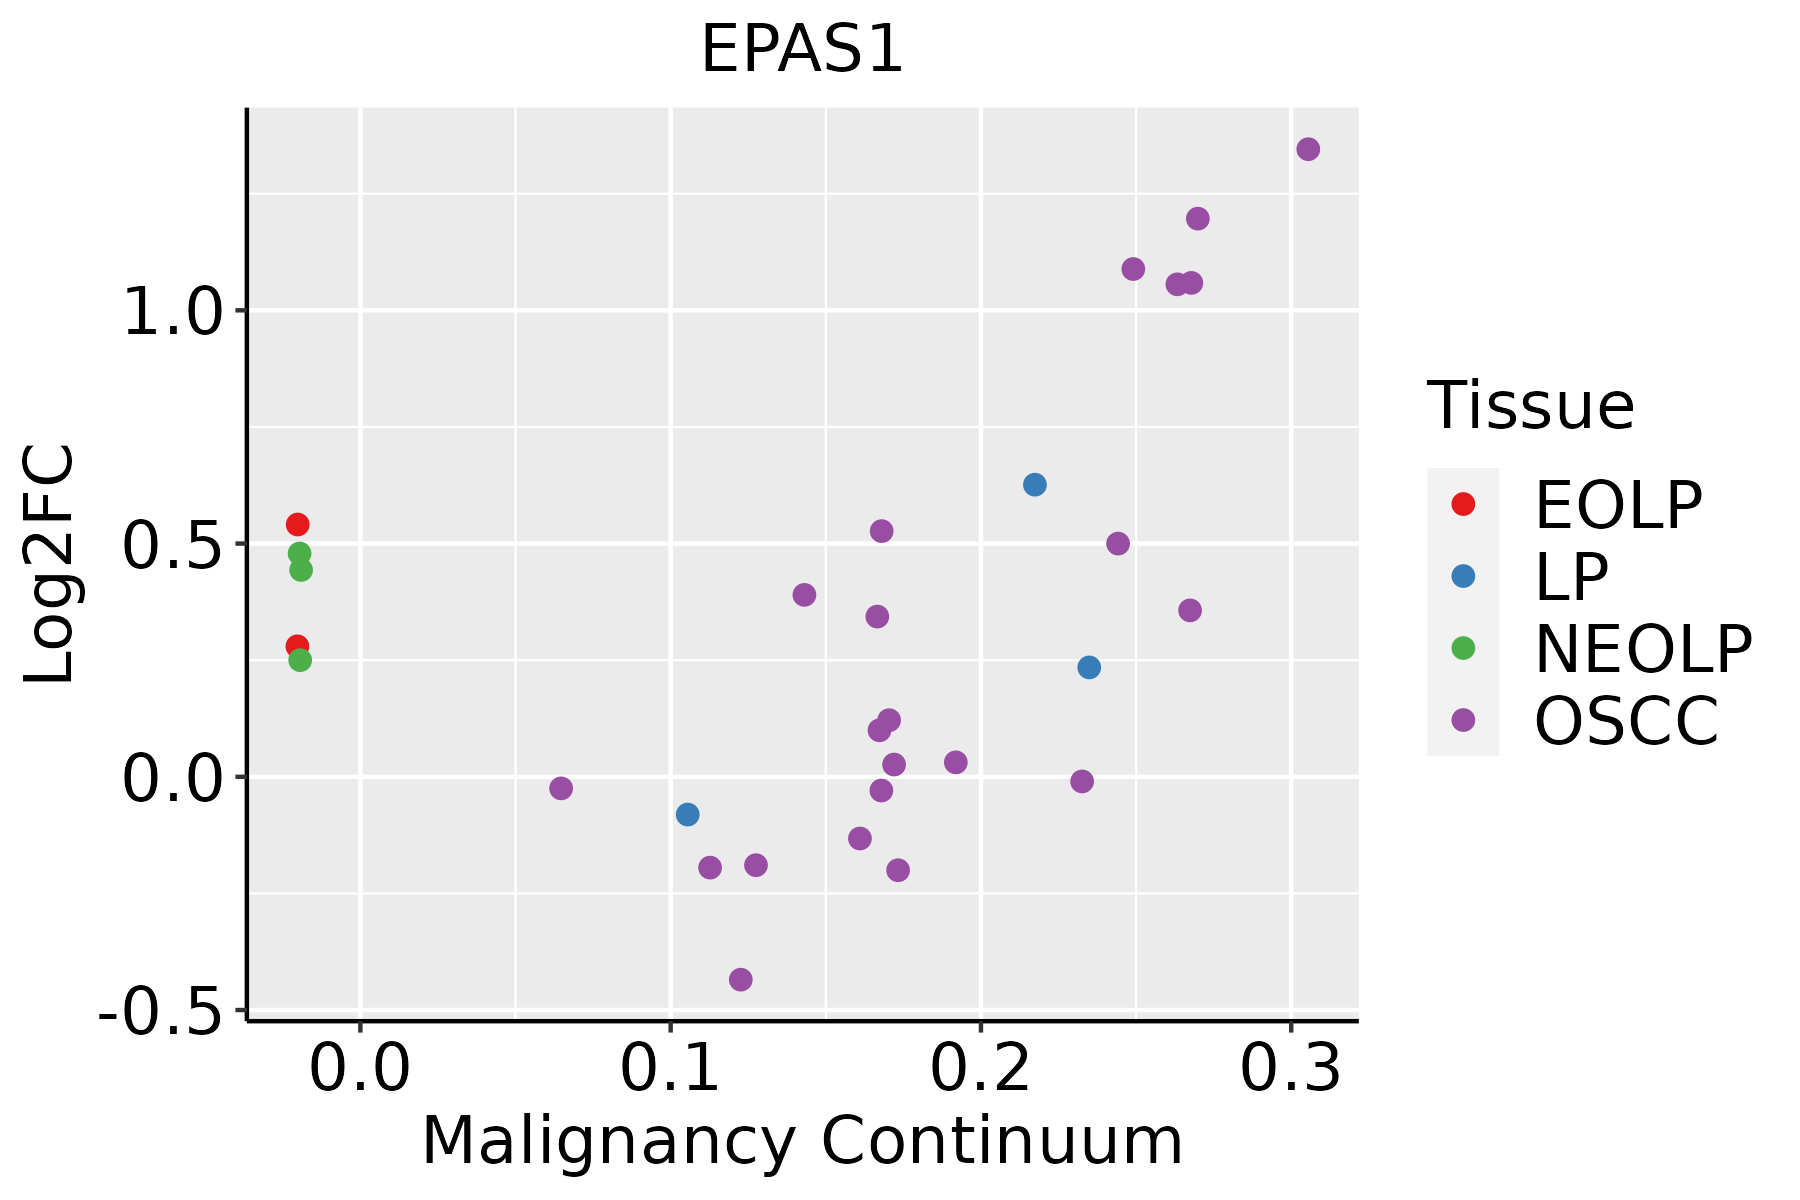 | EOLP: Erosive Oral lichen planus |
| LP: leukoplakia | ||
| NEOLP: Non-erosive oral lichen planus | ||
| OSCC: Oral squamous cell carcinoma | ||
| Prostate | 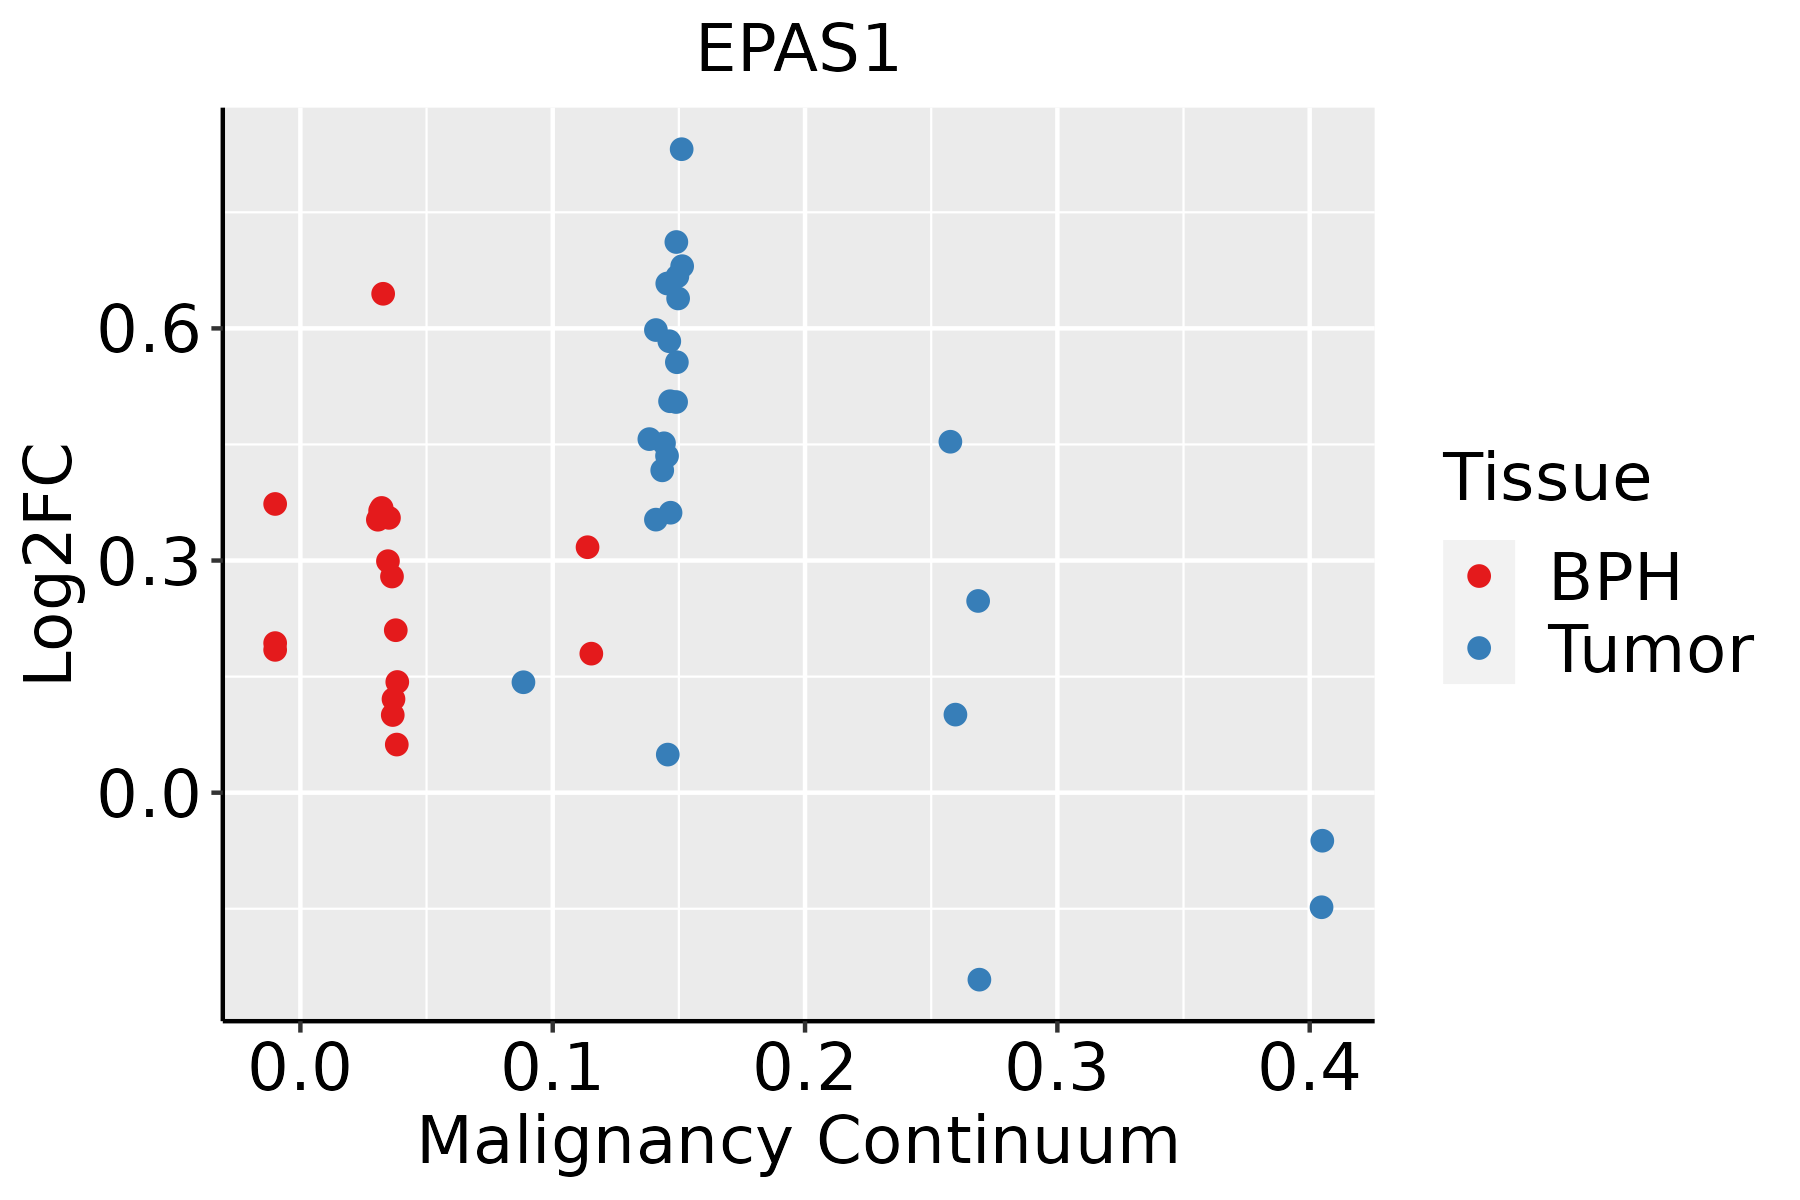 | BPH: Benign Prostatic Hyperplasia |
| Skin | 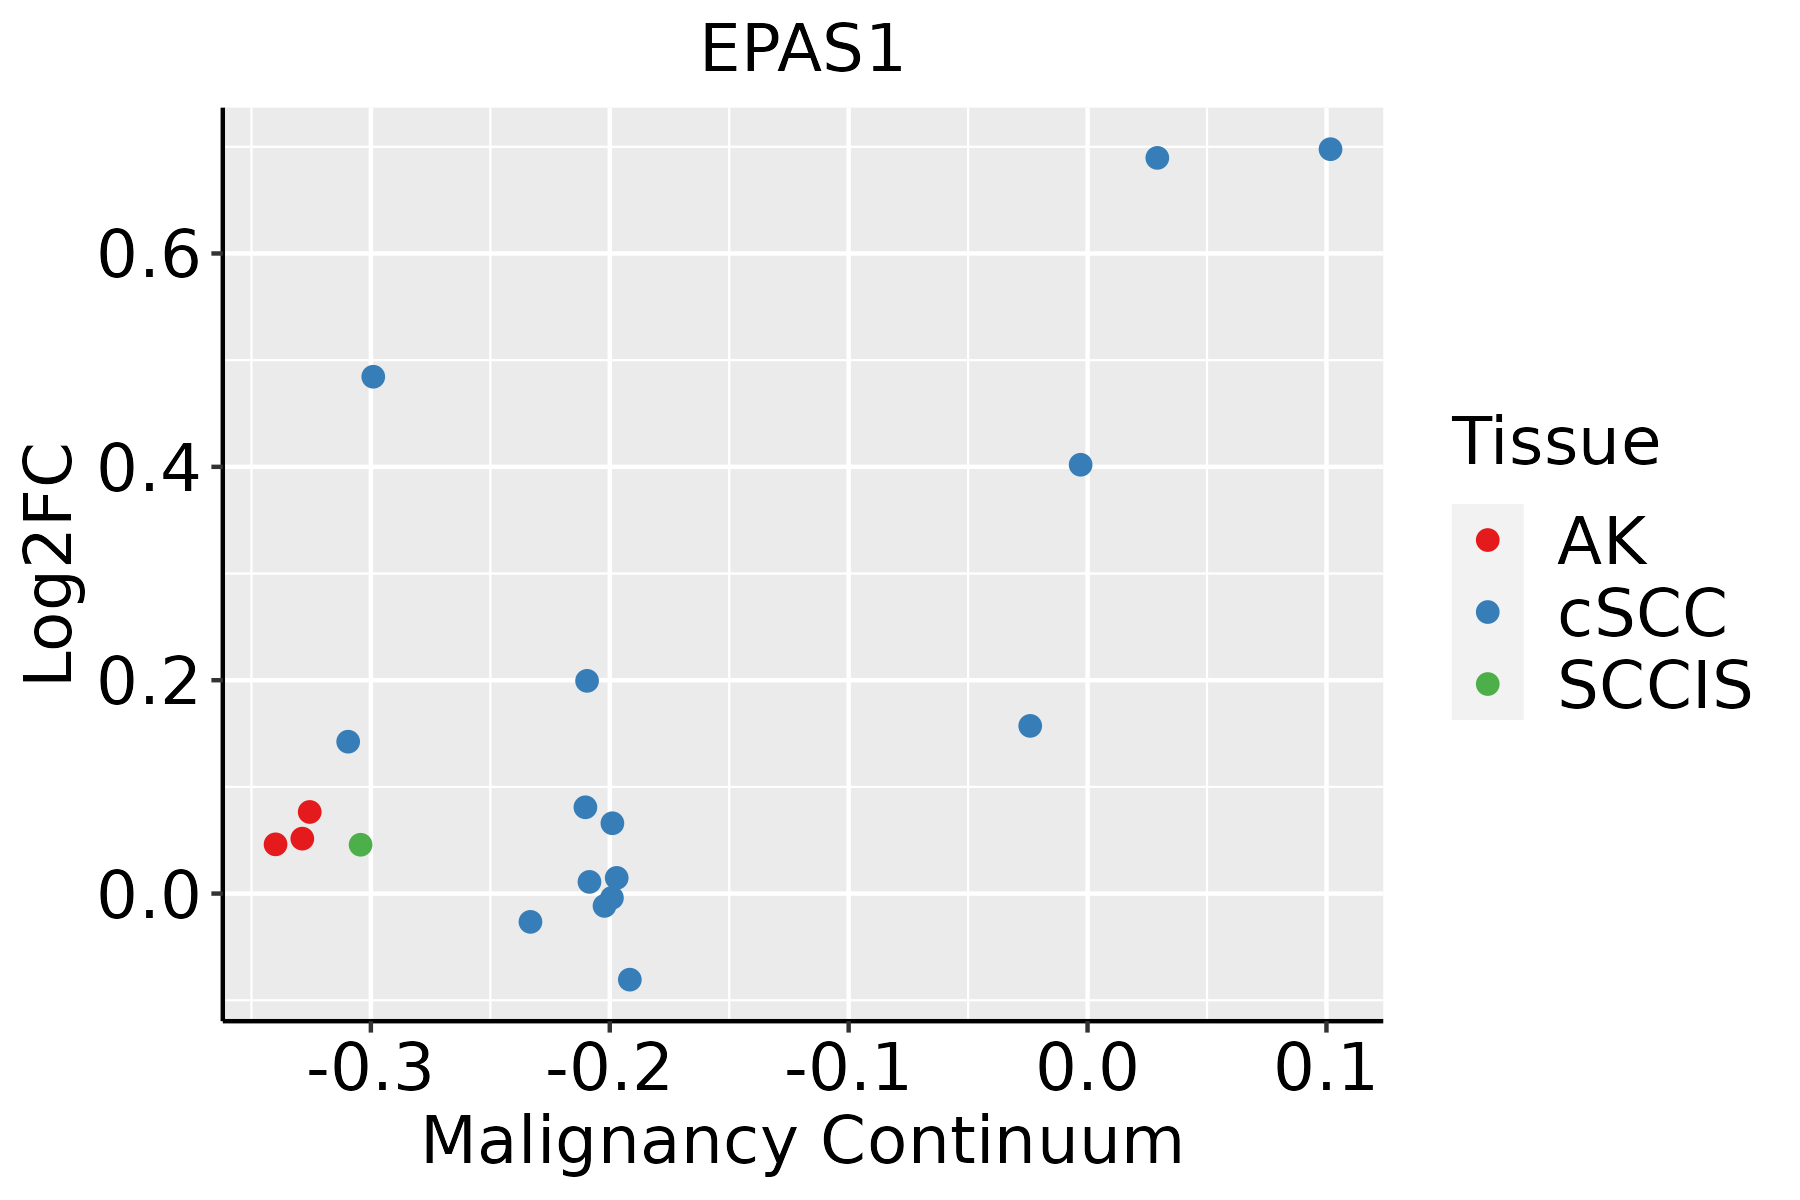 | AK: Actinic keratosis |
| cSCC: Cutaneous squamous cell carcinoma | ||
| SCCIS:squamous cell carcinoma in situ | ||
| Thyroid |  | ATC: Anaplastic thyroid cancer |
| HT: Hashimoto's thyroiditis | ||
| PTC: Papillary thyroid cancer |
| ∗log2FC in expression of this searched gene in stem-like cells from each diseased tissue sample relative to stem-like cells in normal samples in each tissue plotted against the malignancy continuum. Samples are colored based on if they are from different disease stage. |
Top |
Malignant transformation related pathway analysis |
| Find out the enriched GO biological processes and KEGG pathways involved in transition from healthy to precancer to cancer |
| Tissue | Disease Stage | Enriched GO biological Processes |
| Colorectum | CRC |  |
| Stomach | GC |  |
| Stomach | CAG with IM |  |
| Stomach | CSG |  |
| Stomach | CAG |  |
| ∗Top 15 enriched GO BP terms are showed in the bar plot of each disease state in each tissue. Each row represents a significant GO biological process which is colored according to the -log10(p.adjust). |
| Page: 1 2 3 4 5 6 7 8 9 |
| GO ID | Tissue | Disease Stage | Description | Gene Ratio | Bg Ratio | pvalue | p.adjust | Count |
| GO:0006979 | Colorectum | AD | response to oxidative stress | 145/3918 | 446/18723 | 5.16e-09 | 3.23e-07 | 145 |
| GO:1903320 | Colorectum | AD | regulation of protein modification by small protein conjugation or removal | 86/3918 | 242/18723 | 9.43e-08 | 4.65e-06 | 86 |
| GO:0062197 | Colorectum | AD | cellular response to chemical stress | 109/3918 | 337/18723 | 5.33e-07 | 1.95e-05 | 109 |
| GO:0034101 | Colorectum | AD | erythrocyte homeostasis | 51/3918 | 129/18723 | 1.07e-06 | 3.59e-05 | 51 |
| GO:0030099 | Colorectum | AD | myeloid cell differentiation | 119/3918 | 381/18723 | 1.24e-06 | 4.01e-05 | 119 |
| GO:0055076 | Colorectum | AD | transition metal ion homeostasis | 53/3918 | 138/18723 | 1.89e-06 | 5.65e-05 | 53 |
| GO:0034599 | Colorectum | AD | cellular response to oxidative stress | 94/3918 | 288/18723 | 2.03e-06 | 6.02e-05 | 94 |
| GO:0002262 | Colorectum | AD | myeloid cell homeostasis | 57/3918 | 157/18723 | 6.17e-06 | 1.56e-04 | 57 |
| GO:0048872 | Colorectum | AD | homeostasis of number of cells | 87/3918 | 272/18723 | 1.16e-05 | 2.61e-04 | 87 |
| GO:0030218 | Colorectum | AD | erythrocyte differentiation | 45/3918 | 120/18723 | 2.22e-05 | 4.39e-04 | 45 |
| GO:0001701 | Colorectum | AD | in utero embryonic development | 110/3918 | 367/18723 | 2.36e-05 | 4.62e-04 | 110 |
| GO:0001890 | Colorectum | AD | placenta development | 51/3918 | 144/18723 | 3.99e-05 | 7.16e-04 | 51 |
| GO:0001892 | Colorectum | AD | embryonic placenta development | 33/3918 | 82/18723 | 5.30e-05 | 9.01e-04 | 33 |
| GO:0060249 | Colorectum | AD | anatomical structure homeostasis | 94/3918 | 314/18723 | 9.37e-05 | 1.42e-03 | 94 |
| GO:0043620 | Colorectum | AD | regulation of DNA-templated transcription in response to stress | 23/3918 | 53/18723 | 1.86e-04 | 2.49e-03 | 23 |
| GO:0001894 | Colorectum | AD | tissue homeostasis | 81/3918 | 268/18723 | 1.96e-04 | 2.62e-03 | 81 |
| GO:0055072 | Colorectum | AD | iron ion homeostasis | 32/3918 | 85/18723 | 2.97e-04 | 3.60e-03 | 32 |
| GO:0070482 | Colorectum | AD | response to oxygen levels | 99/3918 | 347/18723 | 4.29e-04 | 4.82e-03 | 99 |
| GO:0043618 | Colorectum | AD | regulation of transcription from RNA polymerase II promoter in response to stress | 20/3918 | 47/18723 | 6.54e-04 | 6.75e-03 | 20 |
| GO:0071453 | Colorectum | AD | cellular response to oxygen levels | 55/3918 | 177/18723 | 9.48e-04 | 8.96e-03 | 55 |
| Page: 1 2 3 4 5 6 7 8 9 10 11 12 13 14 15 16 17 18 19 20 21 22 23 24 25 26 27 28 29 30 31 32 |
| Pathway ID | Tissue | Disease Stage | Description | Gene Ratio | Bg Ratio | pvalue | p.adjust | qvalue | Count |
| hsa05211 | Colorectum | AD | Renal cell carcinoma | 28/2092 | 69/8465 | 2.58e-03 | 1.37e-02 | 8.75e-03 | 28 |
| hsa052111 | Colorectum | AD | Renal cell carcinoma | 28/2092 | 69/8465 | 2.58e-03 | 1.37e-02 | 8.75e-03 | 28 |
| hsa052112 | Colorectum | FAP | Renal cell carcinoma | 23/1404 | 69/8465 | 4.86e-04 | 3.56e-03 | 2.16e-03 | 23 |
| hsa052113 | Colorectum | FAP | Renal cell carcinoma | 23/1404 | 69/8465 | 4.86e-04 | 3.56e-03 | 2.16e-03 | 23 |
| hsa052114 | Colorectum | CRC | Renal cell carcinoma | 20/1091 | 69/8465 | 3.02e-04 | 3.48e-03 | 2.36e-03 | 20 |
| hsa052115 | Colorectum | CRC | Renal cell carcinoma | 20/1091 | 69/8465 | 3.02e-04 | 3.48e-03 | 2.36e-03 | 20 |
| hsa0521118 | Esophagus | ESCC | Renal cell carcinoma | 51/4205 | 69/8465 | 3.29e-05 | 1.53e-04 | 7.83e-05 | 51 |
| hsa0521119 | Esophagus | ESCC | Renal cell carcinoma | 51/4205 | 69/8465 | 3.29e-05 | 1.53e-04 | 7.83e-05 | 51 |
| hsa0521121 | Liver | HCC | Renal cell carcinoma | 51/4020 | 69/8465 | 6.76e-06 | 5.53e-05 | 3.07e-05 | 51 |
| hsa0521131 | Liver | HCC | Renal cell carcinoma | 51/4020 | 69/8465 | 6.76e-06 | 5.53e-05 | 3.07e-05 | 51 |
| hsa052117 | Lung | IAC | Renal cell carcinoma | 18/1053 | 69/8465 | 1.51e-03 | 9.23e-03 | 6.13e-03 | 18 |
| hsa0521112 | Lung | IAC | Renal cell carcinoma | 18/1053 | 69/8465 | 1.51e-03 | 9.23e-03 | 6.13e-03 | 18 |
| hsa0521122 | Lung | AIS | Renal cell carcinoma | 15/961 | 69/8465 | 9.37e-03 | 4.10e-02 | 2.63e-02 | 15 |
| hsa0521132 | Lung | AIS | Renal cell carcinoma | 15/961 | 69/8465 | 9.37e-03 | 4.10e-02 | 2.63e-02 | 15 |
| hsa0521116 | Oral cavity | OSCC | Renal cell carcinoma | 51/3704 | 69/8465 | 3.30e-07 | 2.05e-06 | 1.04e-06 | 51 |
| hsa0521117 | Oral cavity | OSCC | Renal cell carcinoma | 51/3704 | 69/8465 | 3.30e-07 | 2.05e-06 | 1.04e-06 | 51 |
| hsa0521141 | Oral cavity | EOLP | Renal cell carcinoma | 25/1218 | 69/8465 | 4.96e-06 | 3.27e-05 | 1.93e-05 | 25 |
| hsa0521151 | Oral cavity | EOLP | Renal cell carcinoma | 25/1218 | 69/8465 | 4.96e-06 | 3.27e-05 | 1.93e-05 | 25 |
| hsa0521161 | Oral cavity | NEOLP | Renal cell carcinoma | 21/1112 | 69/8465 | 1.32e-04 | 9.32e-04 | 5.86e-04 | 21 |
| hsa0521171 | Oral cavity | NEOLP | Renal cell carcinoma | 21/1112 | 69/8465 | 1.32e-04 | 9.32e-04 | 5.86e-04 | 21 |
| Page: 1 2 |
Top |
Cell-cell communication analysis |
| Identification of potential cell-cell interactions between two cell types and their ligand-receptor pairs for different disease states |
| Ligand | Receptor | LRpair | Pathway | Tissue | Disease Stage |
| Page: 1 |
Top |
Single-cell gene regulatory network inference analysis |
| Find out the significant the regulons (TFs) and the target genes of each regulon across cell types for different disease states |
| TF | Cell Type | Tissue | Disease Stage | Target Gene | RSS | Regulon Activity |
| EPAS1 | MAST | Cervix | ADJ | RGS5,SPARC,ADAMTS4, etc. | 2.90e-01 |  |
| EPAS1 | MAST | Cervix | CC | RGS5,SPARC,ADAMTS4, etc. | 8.46e-02 |  |
| EPAS1 | INMON | Cervix | Healthy | RGS5,SPARC,ADAMTS4, etc. | 2.36e-02 |  |
| EPAS1 | MAST | Cervix | Healthy | RGS5,SPARC,ADAMTS4, etc. | 1.62e-02 | |
| EPAS1 | MAST | Cervix | HSIL_HPV | RGS5,SPARC,ADAMTS4, etc. | 2.23e-01 |  |
| EPAS1 | IMENT | Colorectum | ADJ | FSIP2,FABP1,ABCC3, etc. | 3.18e-01 |  |
| EPAS1 | CHIEF | Stomach | Healthy | EIF3A,ID3,EGFL6, etc. | 4.27e-01 |  |
| ∗The dot plots of a searched regulon are shown for all cell subpopulations in each disease state of each tissue based on the regulon specific score inferred using pySCENIC and by calculating the average expression. |
| Page: 1 |
Top |
Somatic mutation of malignant transformation related genes |
| Annotation of somatic variants for genes involved in malignant transformation |
| Hugo Symbol | Variant Class | Variant Classification | dbSNP RS | HGVSc | HGVSp | HGVSp Short | SWISSPROT | BIOTYPE | SIFT | PolyPhen | Tumor Sample Barcode | Tissue | Histology | Sex | Age | Stage | Therapy Types | Drugs | Outcome |
| EPAS1 | SNV | Missense_Mutation | c.694C>A | p.Pro232Thr | p.P232T | Q99814 | protein_coding | deleterious(0) | probably_damaging(0.992) | TCGA-A2-A04T-01 | Breast | breast invasive carcinoma | Female | <65 | I/II | Chemotherapy | cyclophosphamide | SD | |
| EPAS1 | SNV | Missense_Mutation | rs377001303 | c.1556N>T | p.Thr519Met | p.T519M | Q99814 | protein_coding | tolerated(0.3) | benign(0.091) | TCGA-AN-A0AK-01 | Breast | breast invasive carcinoma | Female | >=65 | I/II | Unknown | Unknown | SD |
| EPAS1 | SNV | Missense_Mutation | c.625N>G | p.Asn209Asp | p.N209D | Q99814 | protein_coding | tolerated(0.58) | benign(0.011) | TCGA-AN-A0AS-01 | Breast | breast invasive carcinoma | Female | >=65 | III/IV | Unknown | Unknown | SD | |
| EPAS1 | SNV | Missense_Mutation | novel | c.2061N>G | p.Phe687Leu | p.F687L | Q99814 | protein_coding | tolerated(0.16) | benign(0.005) | TCGA-B6-A0WX-01 | Breast | breast invasive carcinoma | Female | <65 | III/IV | Unknown | Unknown | PD |
| EPAS1 | SNV | Missense_Mutation | c.164N>T | p.Ser55Phe | p.S55F | Q99814 | protein_coding | deleterious(0) | probably_damaging(0.929) | TCGA-BH-A0DX-01 | Breast | breast invasive carcinoma | Female | <65 | I/II | Chemotherapy | taxotere | CR | |
| EPAS1 | SNV | Missense_Mutation | c.493G>C | p.Glu165Gln | p.E165Q | Q99814 | protein_coding | tolerated(0.08) | probably_damaging(0.984) | TCGA-E2-A1AZ-01 | Breast | breast invasive carcinoma | Female | <65 | I/II | Chemotherapy | adriamycin | SD | |
| EPAS1 | insertion | Frame_Shift_Ins | novel | c.1651_1652insAAGGCTGGTACATGATACAAGG | p.Leu551GlnfsTer67 | p.L551Qfs*67 | Q99814 | protein_coding | TCGA-A8-A09E-01 | Breast | breast invasive carcinoma | Female | >=65 | III/IV | Hormone Therapy | anastrozole | SD | ||
| EPAS1 | insertion | Nonsense_Mutation | novel | c.1933_1934insGA | p.Leu645Ter | p.L645* | Q99814 | protein_coding | TCGA-BH-A0BM-01 | Breast | breast invasive carcinoma | Female | <65 | I/II | Chemotherapy | adriamycin | SD | ||
| EPAS1 | insertion | Frame_Shift_Ins | novel | c.1934_1935insGTATAAAACATGTATAA | p.His646TyrfsTer56 | p.H646Yfs*56 | Q99814 | protein_coding | TCGA-BH-A0BM-01 | Breast | breast invasive carcinoma | Female | <65 | I/II | Chemotherapy | adriamycin | SD | ||
| EPAS1 | deletion | Frame_Shift_Del | c.2397delN | p.Pro801HisfsTer39 | p.P801Hfs*39 | Q99814 | protein_coding | TCGA-EW-A1IZ-01 | Breast | breast invasive carcinoma | Female | <65 | III/IV | Chemotherapy | taxotere | SD |
| Page: 1 2 3 4 5 6 7 8 9 10 11 |
Top |
Related drugs of malignant transformation related genes |
| Identification of chemicals and drugs interact with genes involved in malignant transfromation |
| (DGIdb 4.0) |
| Entrez ID | Symbol | Category | Interaction Types | Drug Claim Name | Drug Name | PMIDs |
| 2034 | EPAS1 | KINASE, TRANSCRIPTION FACTOR, DRUGGABLE GENOME, TRANSCRIPTION FACTOR COMPLEX | PUUPEHENONE | PUUPEHENONE | 22928967 | |
| 2034 | EPAS1 | KINASE, TRANSCRIPTION FACTOR, DRUGGABLE GENOME, TRANSCRIPTION FACTOR COMPLEX | HALICLONADIAMINE | HALICLONADIAMINE | 22928967 | |
| 2034 | EPAS1 | KINASE, TRANSCRIPTION FACTOR, DRUGGABLE GENOME, TRANSCRIPTION FACTOR COMPLEX | NEOPETROFORMYNE A | NEOPETROFORMYNE A | 22928967 |
| Page: 1 |

Copyright 2023-Present -The University of Texas Health Science Center at Houston |