
|
|||||
|
 | |
| |
| |
| |
| |
| |
|
Gene: CPLANE1 |
Gene summary for CPLANE1 |
| Gene information | Species | Human | Gene symbol | CPLANE1 | Gene ID | 65250 |
| Gene name | ciliogenesis and planar polarity effector 1 | |
| Gene Alias | C5orf42 | |
| Cytomap | 5p13.2 | |
| Gene Type | protein-coding | GO ID | GO:0006996 | UniProtAcc | Q9H799 |
Top |
Malignant transformation analysis |
| Identification of the aberrant gene expression in precancerous and cancerous lesions by comparing the gene expression of stem-like cells in diseased tissues with normal stem cells |
| Entrez ID | Symbol | Replicates | Species | Organ | Tissue | Adj P-value | Log2FC | Malignancy |
| 65250 | CPLANE1 | RNA-P17T-P17T-4 | Human | Lung | IAC | 4.71e-02 | 4.57e-01 | 0.343 |
| 65250 | CPLANE1 | RNA-P17T-P17T-6 | Human | Lung | IAC | 1.48e-03 | 5.08e-01 | 0.3385 |
| 65250 | CPLANE1 | RNA-P17T-P17T-8 | Human | Lung | IAC | 4.12e-03 | 4.16e-01 | 0.3329 |
| 65250 | CPLANE1 | RNA-P23T2-P23T2-1 | Human | Lung | MIAC | 6.80e-05 | 9.21e-01 | -0.037 |
| 65250 | CPLANE1 | RNA-P23T2-P23T2-2 | Human | Lung | MIAC | 7.31e-03 | 6.78e-01 | -0.028 |
| 65250 | CPLANE1 | RNA-P25T1-P25T1-1 | Human | Lung | AIS | 3.89e-21 | 7.32e-01 | -0.2116 |
| 65250 | CPLANE1 | RNA-P25T1-P25T1-2 | Human | Lung | AIS | 1.36e-03 | 4.74e-01 | -0.1941 |
| 65250 | CPLANE1 | RNA-P25T1-P25T1-3 | Human | Lung | AIS | 2.15e-08 | 6.93e-01 | -0.2107 |
| 65250 | CPLANE1 | RNA-P25T1-P25T1-4 | Human | Lung | AIS | 6.32e-15 | 6.80e-01 | -0.2119 |
| 65250 | CPLANE1 | RNA-P3T-P3T-1 | Human | Lung | IAC | 1.03e-03 | 3.83e-01 | 0.1829 |
| 65250 | CPLANE1 | RNA-P3T-P3T-4 | Human | Lung | IAC | 1.67e-02 | 2.99e-01 | 0.1859 |
| 65250 | CPLANE1 | RNA-P6T2-P6T2-1 | Human | Lung | IAC | 2.53e-24 | 7.46e-01 | -0.0166 |
| 65250 | CPLANE1 | RNA-P6T2-P6T2-2 | Human | Lung | IAC | 1.93e-36 | 9.09e-01 | -0.0132 |
| 65250 | CPLANE1 | RNA-P6T2-P6T2-3 | Human | Lung | IAC | 4.36e-32 | 7.68e-01 | -0.013 |
| 65250 | CPLANE1 | RNA-P6T2-P6T2-4 | Human | Lung | IAC | 4.26e-26 | 7.39e-01 | -0.0121 |
| 65250 | CPLANE1 | RNA-P7T1-P7T1-1 | Human | Lung | AIS | 3.94e-06 | 5.63e-01 | -0.0961 |
| 65250 | CPLANE1 | RNA-P7T1-P7T1-2 | Human | Lung | AIS | 8.94e-07 | 5.36e-01 | -0.0876 |
| 65250 | CPLANE1 | RNA-P7T1-P7T1-3 | Human | Lung | AIS | 2.91e-02 | 3.97e-01 | -0.0822 |
| 65250 | CPLANE1 | RNA-P7T1-P7T1-4 | Human | Lung | AIS | 4.67e-04 | 4.20e-01 | -0.0809 |
| 65250 | CPLANE1 | HTA12-23-1 | Human | Pancreas | PDAC | 4.22e-05 | 6.48e-01 | 0.3405 |
| Page: 1 2 |
| Tissue | Expression Dynamics | Abbreviation |
| Lung | 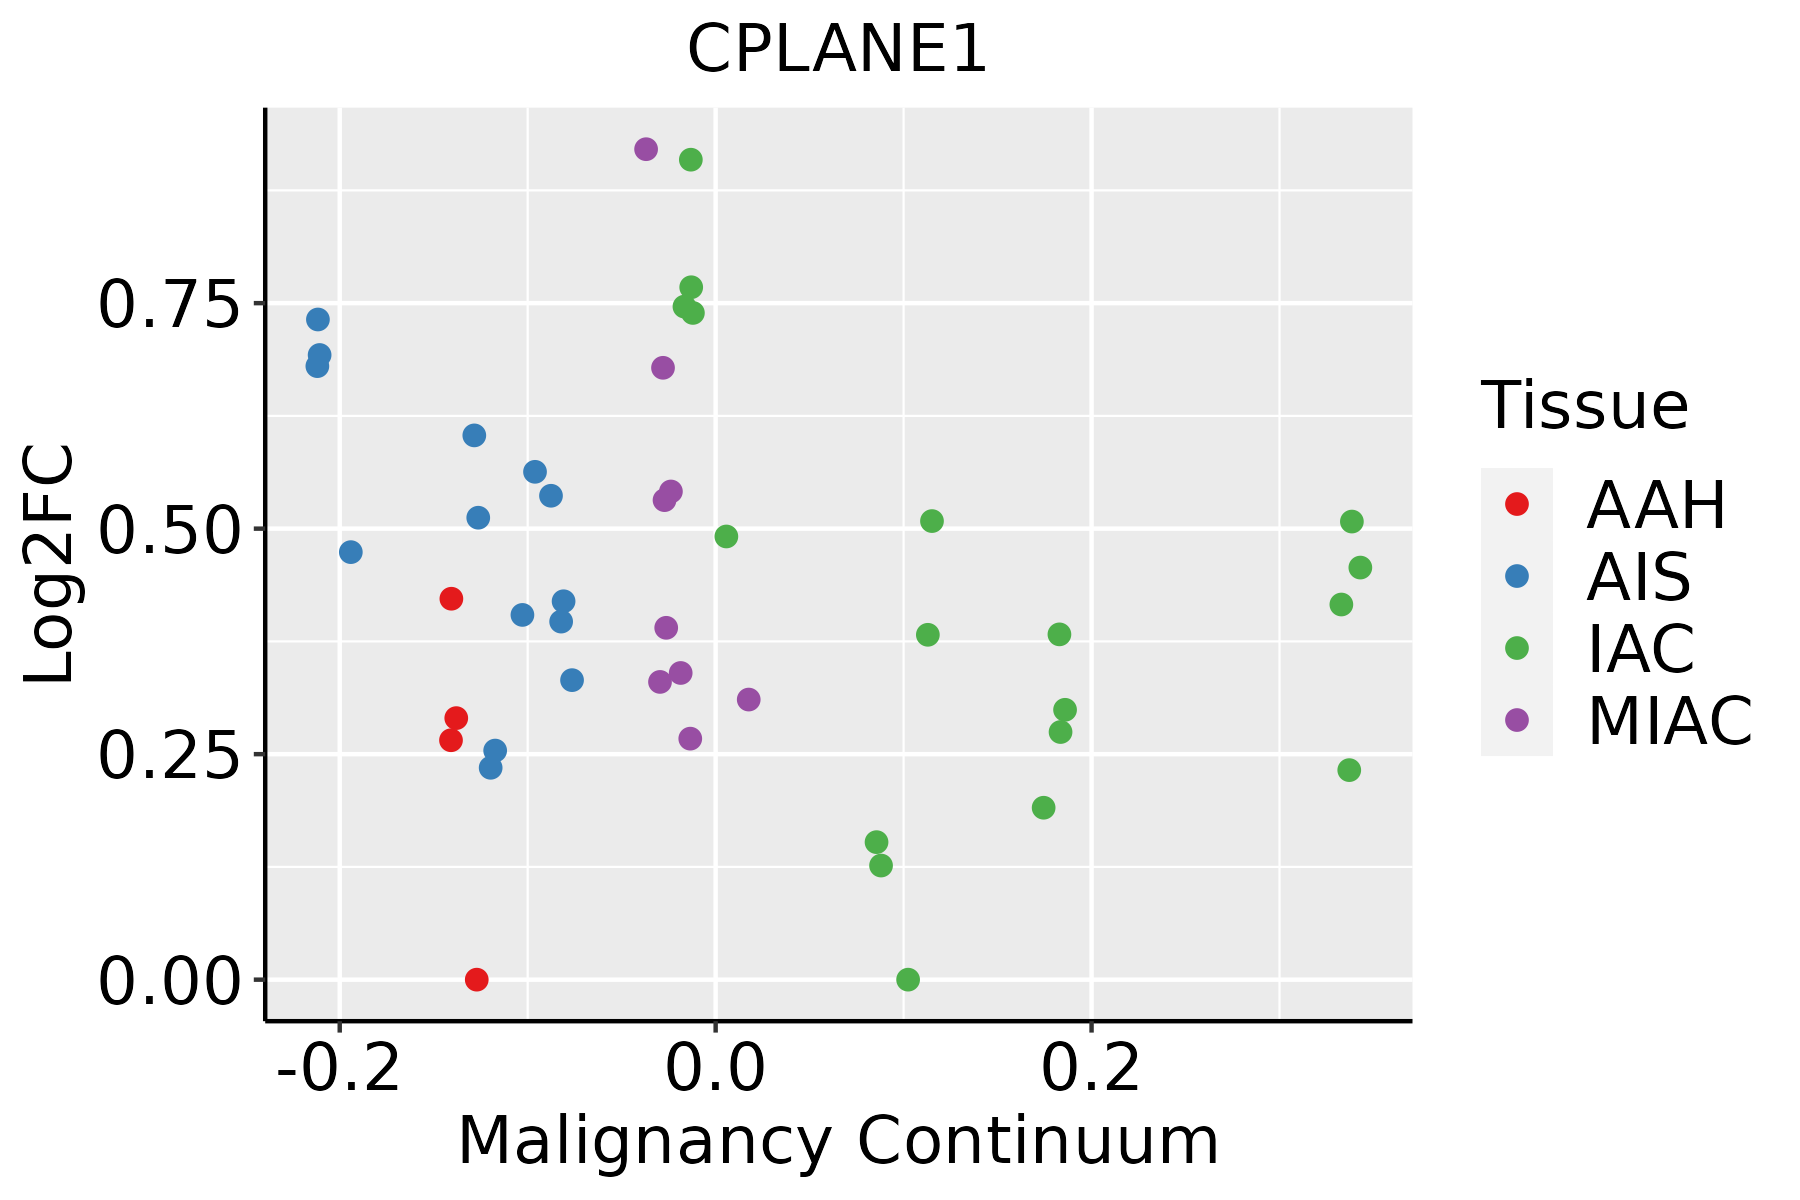 | AAH: Atypical adenomatous hyperplasia |
| AIS: Adenocarcinoma in situ | ||
| IAC: Invasive lung adenocarcinoma | ||
| MIA: Minimally invasive adenocarcinoma | ||
| Thyroid |  | ATC: Anaplastic thyroid cancer |
| HT: Hashimoto's thyroiditis | ||
| PTC: Papillary thyroid cancer |
| ∗log2FC in expression of this searched gene in stem-like cells from each diseased tissue sample relative to stem-like cells in normal samples in each tissue plotted against the malignancy continuum. Samples are colored based on if they are from different disease stage. |
Top |
Malignant transformation related pathway analysis |
| Find out the enriched GO biological processes and KEGG pathways involved in transition from healthy to precancer to cancer |
| Tissue | Disease Stage | Enriched GO biological Processes |
| Colorectum | CRC |  |
| Stomach | GC |  |
| Stomach | CAG with IM |  |
| Stomach | CSG |  |
| Stomach | CAG |  |
| ∗Top 15 enriched GO BP terms are showed in the bar plot of each disease state in each tissue. Each row represents a significant GO biological process which is colored according to the -log10(p.adjust). |
| Page: 1 2 3 4 5 6 7 8 9 |
| GO ID | Tissue | Disease Stage | Description | Gene Ratio | Bg Ratio | pvalue | p.adjust | Count |
| GO:0060271 | Lung | IAC | cilium assembly | 55/2061 | 337/18723 | 1.84e-03 | 1.88e-02 | 55 |
| GO:0044782 | Lung | IAC | cilium organization | 58/2061 | 368/18723 | 3.15e-03 | 2.75e-02 | 58 |
| GO:00602711 | Lung | MIAC | cilium assembly | 37/967 | 337/18723 | 1.29e-05 | 9.85e-04 | 37 |
| GO:00447821 | Lung | MIAC | cilium organization | 38/967 | 368/18723 | 3.93e-05 | 2.08e-03 | 38 |
| Page: 1 |
| Pathway ID | Tissue | Disease Stage | Description | Gene Ratio | Bg Ratio | pvalue | p.adjust | qvalue | Count |
| Page: 1 |
Top |
Cell-cell communication analysis |
| Identification of potential cell-cell interactions between two cell types and their ligand-receptor pairs for different disease states |
| Ligand | Receptor | LRpair | Pathway | Tissue | Disease Stage |
| Page: 1 |
Top |
Single-cell gene regulatory network inference analysis |
| Find out the significant the regulons (TFs) and the target genes of each regulon across cell types for different disease states |
| TF | Cell Type | Tissue | Disease Stage | Target Gene | RSS | Regulon Activity |
| ∗The dot plots of a searched regulon are shown for all cell subpopulations in each disease state of each tissue based on the regulon specific score inferred using pySCENIC and by calculating the average expression. |
| Page: 1 |
Top |
Somatic mutation of malignant transformation related genes |
| Annotation of somatic variants for genes involved in malignant transformation |
| Hugo Symbol | Variant Class | Variant Classification | dbSNP RS | HGVSc | HGVSp | HGVSp Short | SWISSPROT | BIOTYPE | SIFT | PolyPhen | Tumor Sample Barcode | Tissue | Histology | Sex | Age | Stage | Therapy Types | Drugs | Outcome |
| Page: 1 |
Top |
Related drugs of malignant transformation related genes |
| Identification of chemicals and drugs interact with genes involved in malignant transfromation |
| (DGIdb 4.0) |
| Entrez ID | Symbol | Category | Interaction Types | Drug Claim Name | Drug Name | PMIDs |
| Page: 1 |

Copyright 2023-Present -The University of Texas Health Science Center at Houston |