
|
|||||
|
 | |
| |
| |
| |
| |
| |
|
Gene: CHERP |
Gene summary for CHERP |
| Gene information | Species | Human | Gene symbol | CHERP | Gene ID | 10523 |
| Gene name | calcium homeostasis endoplasmic reticulum protein | |
| Gene Alias | DAN16 | |
| Cytomap | 19p13.11 | |
| Gene Type | protein-coding | GO ID | GO:0006139 | UniProtAcc | Q8IWX8 |
Top |
Malignant transformation analysis |
| Identification of the aberrant gene expression in precancerous and cancerous lesions by comparing the gene expression of stem-like cells in diseased tissues with normal stem cells |
| Entrez ID | Symbol | Replicates | Species | Organ | Tissue | Adj P-value | Log2FC | Malignancy |
| 10523 | CHERP | LZE2T | Human | Esophagus | ESCC | 1.86e-02 | 2.36e-01 | 0.082 |
| 10523 | CHERP | LZE4T | Human | Esophagus | ESCC | 1.86e-07 | 1.73e-01 | 0.0811 |
| 10523 | CHERP | LZE7T | Human | Esophagus | ESCC | 5.09e-10 | 6.36e-01 | 0.0667 |
| 10523 | CHERP | LZE20T | Human | Esophagus | ESCC | 1.44e-05 | 1.35e-01 | 0.0662 |
| 10523 | CHERP | LZE22T | Human | Esophagus | ESCC | 5.71e-03 | 3.39e-01 | 0.068 |
| 10523 | CHERP | LZE24T | Human | Esophagus | ESCC | 9.12e-17 | 2.71e-01 | 0.0596 |
| 10523 | CHERP | LZE21T | Human | Esophagus | ESCC | 4.48e-04 | 3.03e-01 | 0.0655 |
| 10523 | CHERP | P1T-E | Human | Esophagus | ESCC | 5.52e-06 | 3.69e-01 | 0.0875 |
| 10523 | CHERP | P2T-E | Human | Esophagus | ESCC | 1.15e-23 | 2.26e-01 | 0.1177 |
| 10523 | CHERP | P4T-E | Human | Esophagus | ESCC | 4.28e-12 | 2.49e-01 | 0.1323 |
| 10523 | CHERP | P5T-E | Human | Esophagus | ESCC | 7.63e-15 | 1.99e-01 | 0.1327 |
| 10523 | CHERP | P8T-E | Human | Esophagus | ESCC | 1.99e-25 | 4.09e-01 | 0.0889 |
| 10523 | CHERP | P9T-E | Human | Esophagus | ESCC | 1.02e-20 | 3.37e-01 | 0.1131 |
| 10523 | CHERP | P10T-E | Human | Esophagus | ESCC | 4.17e-37 | 5.21e-01 | 0.116 |
| 10523 | CHERP | P11T-E | Human | Esophagus | ESCC | 4.96e-13 | 5.58e-01 | 0.1426 |
| 10523 | CHERP | P12T-E | Human | Esophagus | ESCC | 5.96e-24 | 3.44e-01 | 0.1122 |
| 10523 | CHERP | P15T-E | Human | Esophagus | ESCC | 1.10e-21 | 3.82e-01 | 0.1149 |
| 10523 | CHERP | P16T-E | Human | Esophagus | ESCC | 2.45e-23 | 3.43e-01 | 0.1153 |
| 10523 | CHERP | P17T-E | Human | Esophagus | ESCC | 1.01e-07 | 2.89e-01 | 0.1278 |
| 10523 | CHERP | P19T-E | Human | Esophagus | ESCC | 5.10e-03 | 5.71e-01 | 0.1662 |
| Page: 1 2 3 4 5 |
| Tissue | Expression Dynamics | Abbreviation |
| Esophagus | 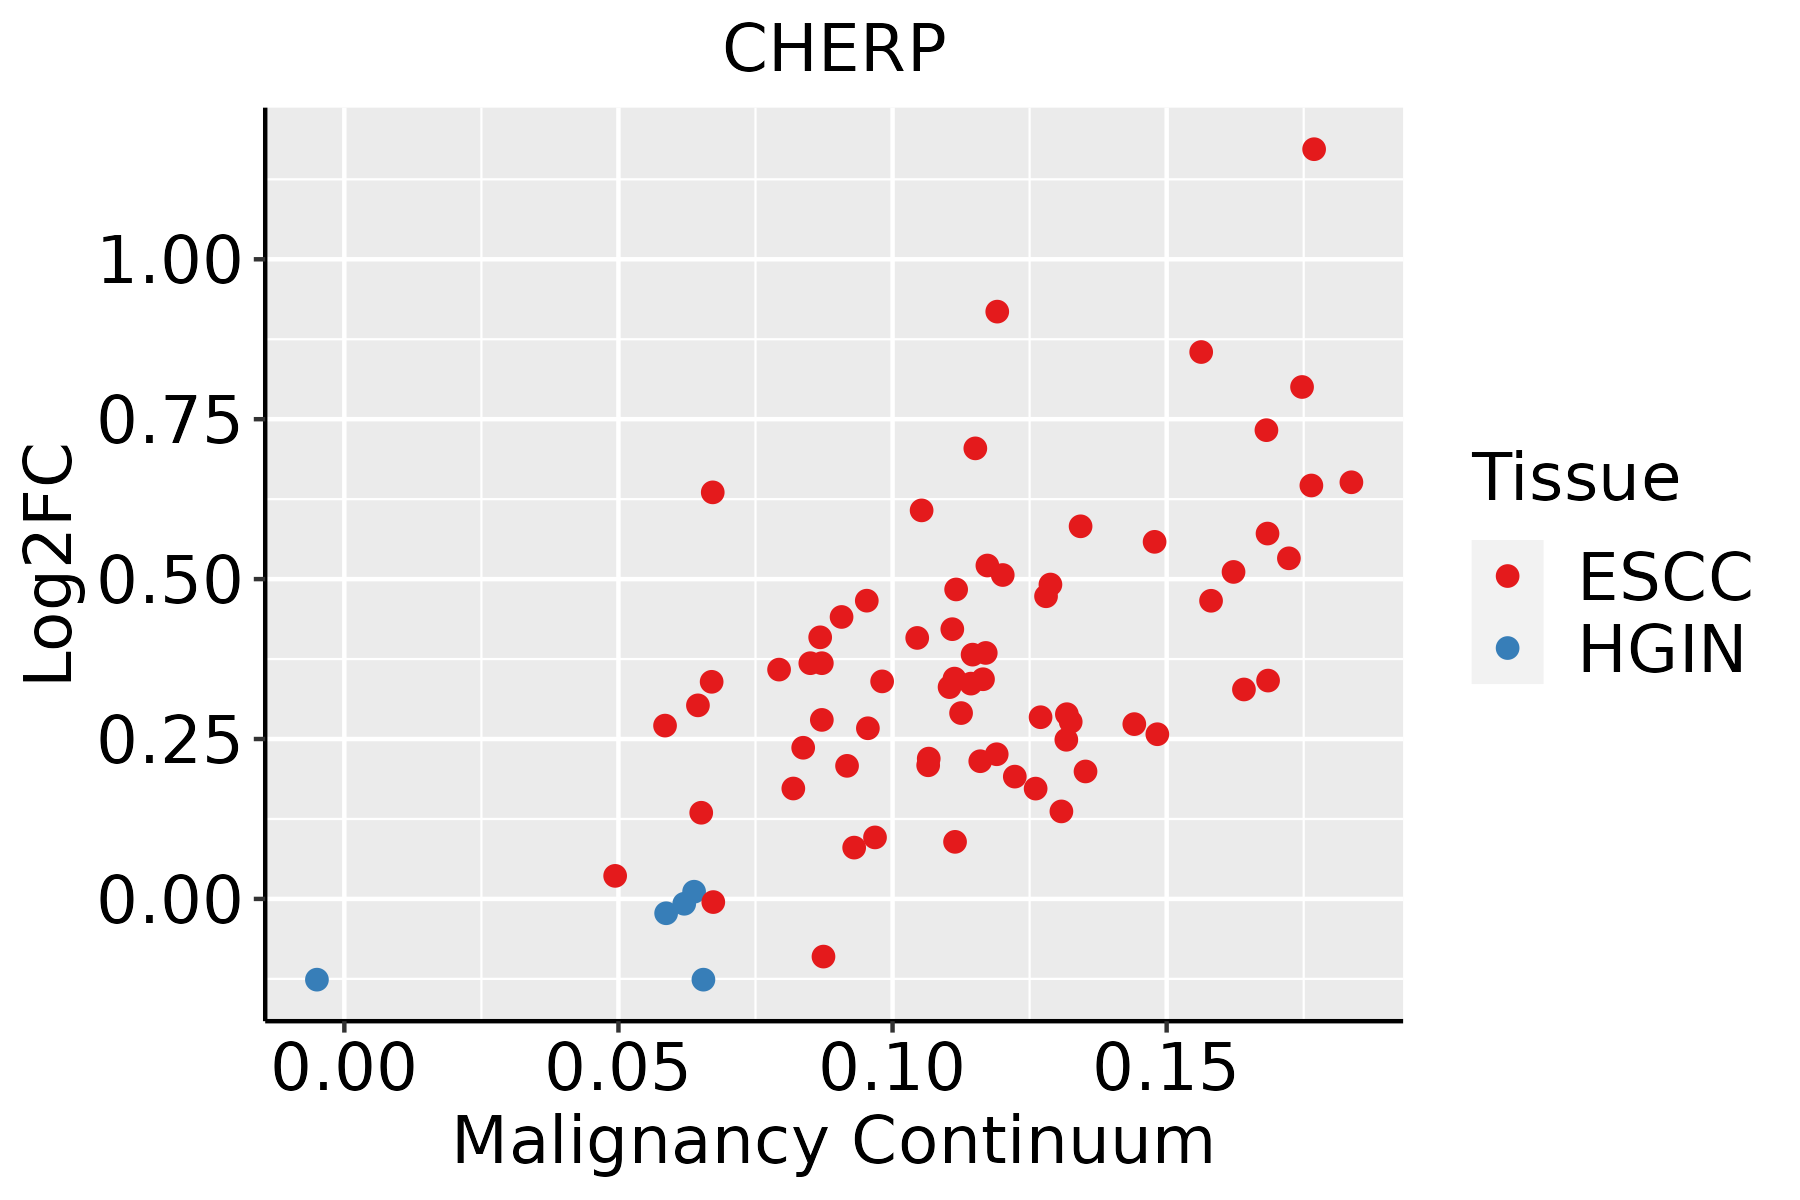 | ESCC: Esophageal squamous cell carcinoma |
| HGIN: High-grade intraepithelial neoplasias | ||
| LGIN: Low-grade intraepithelial neoplasias | ||
| Liver |  | HCC: Hepatocellular carcinoma |
| NAFLD: Non-alcoholic fatty liver disease | ||
| Oral Cavity | 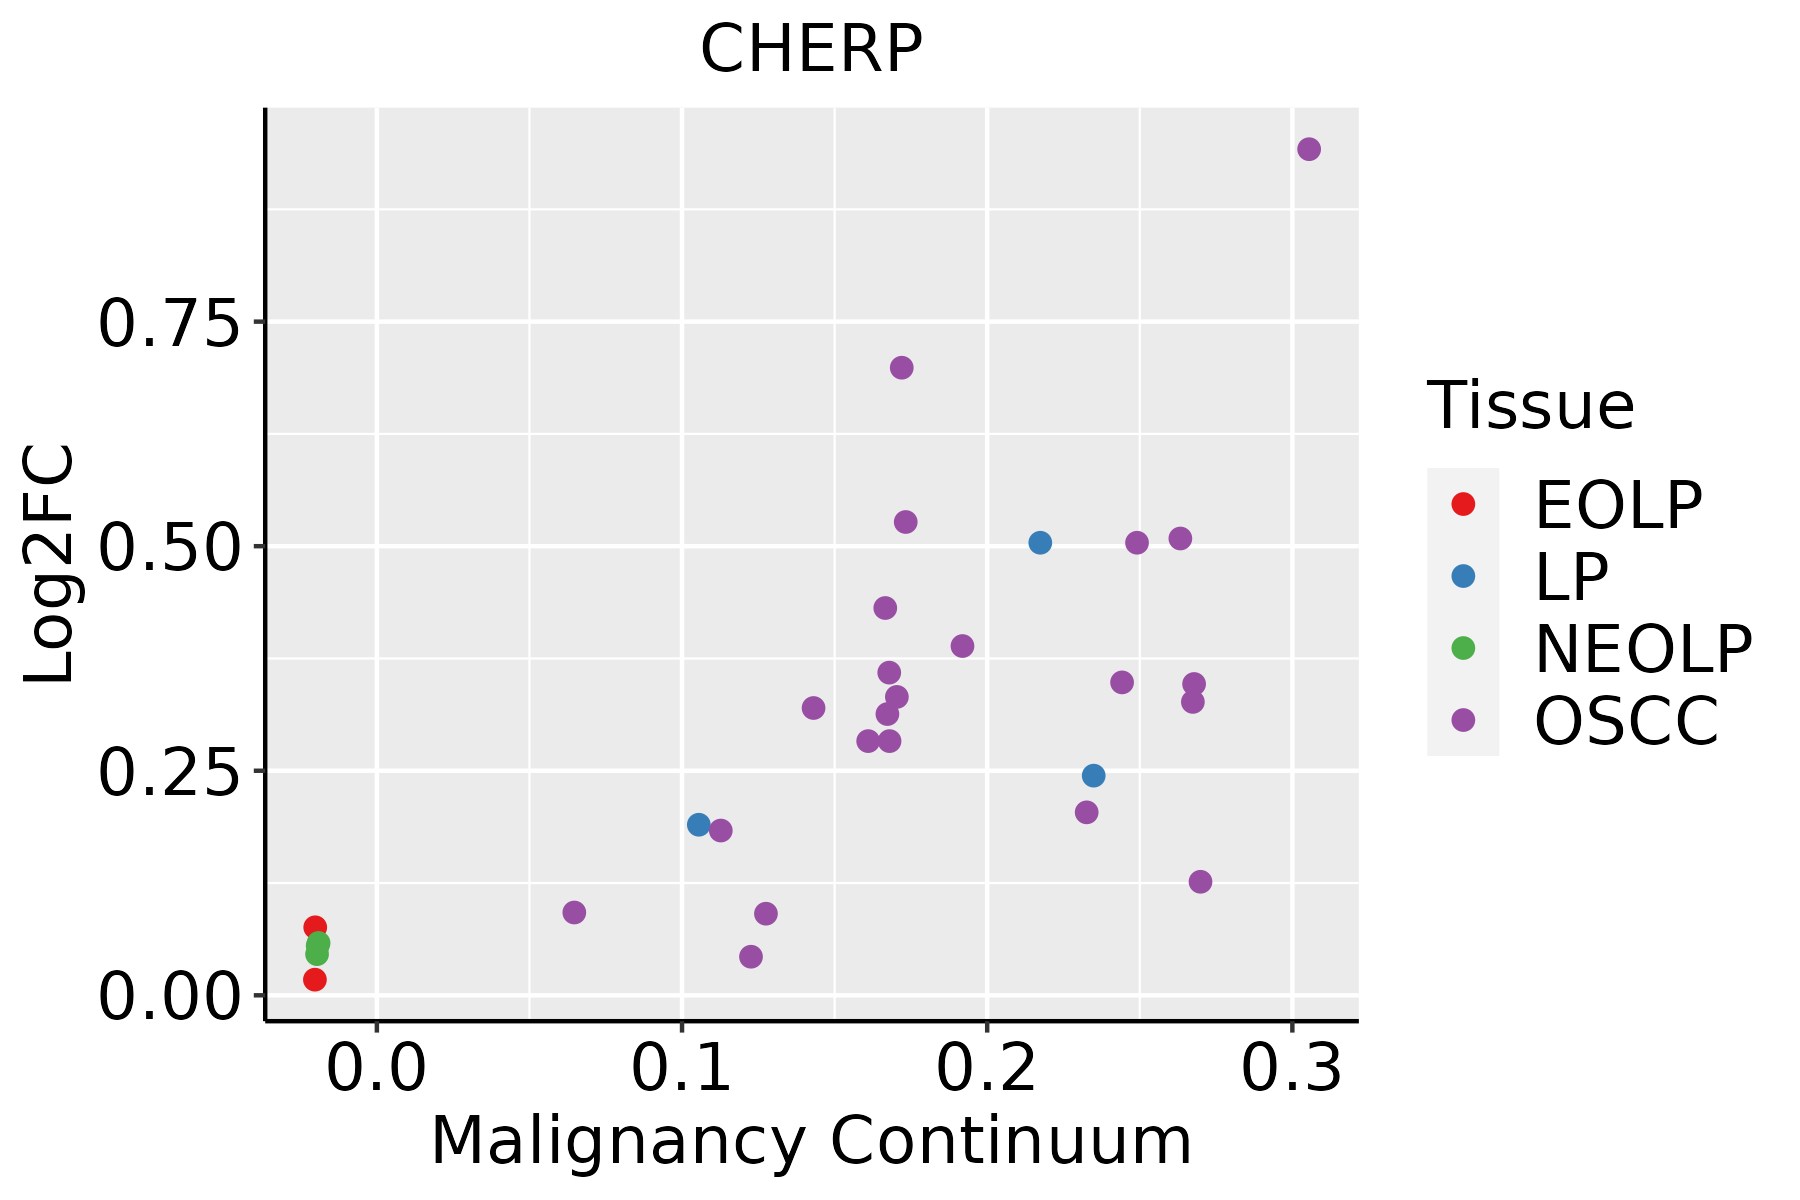 | EOLP: Erosive Oral lichen planus |
| LP: leukoplakia | ||
| NEOLP: Non-erosive oral lichen planus | ||
| OSCC: Oral squamous cell carcinoma | ||
| Thyroid | 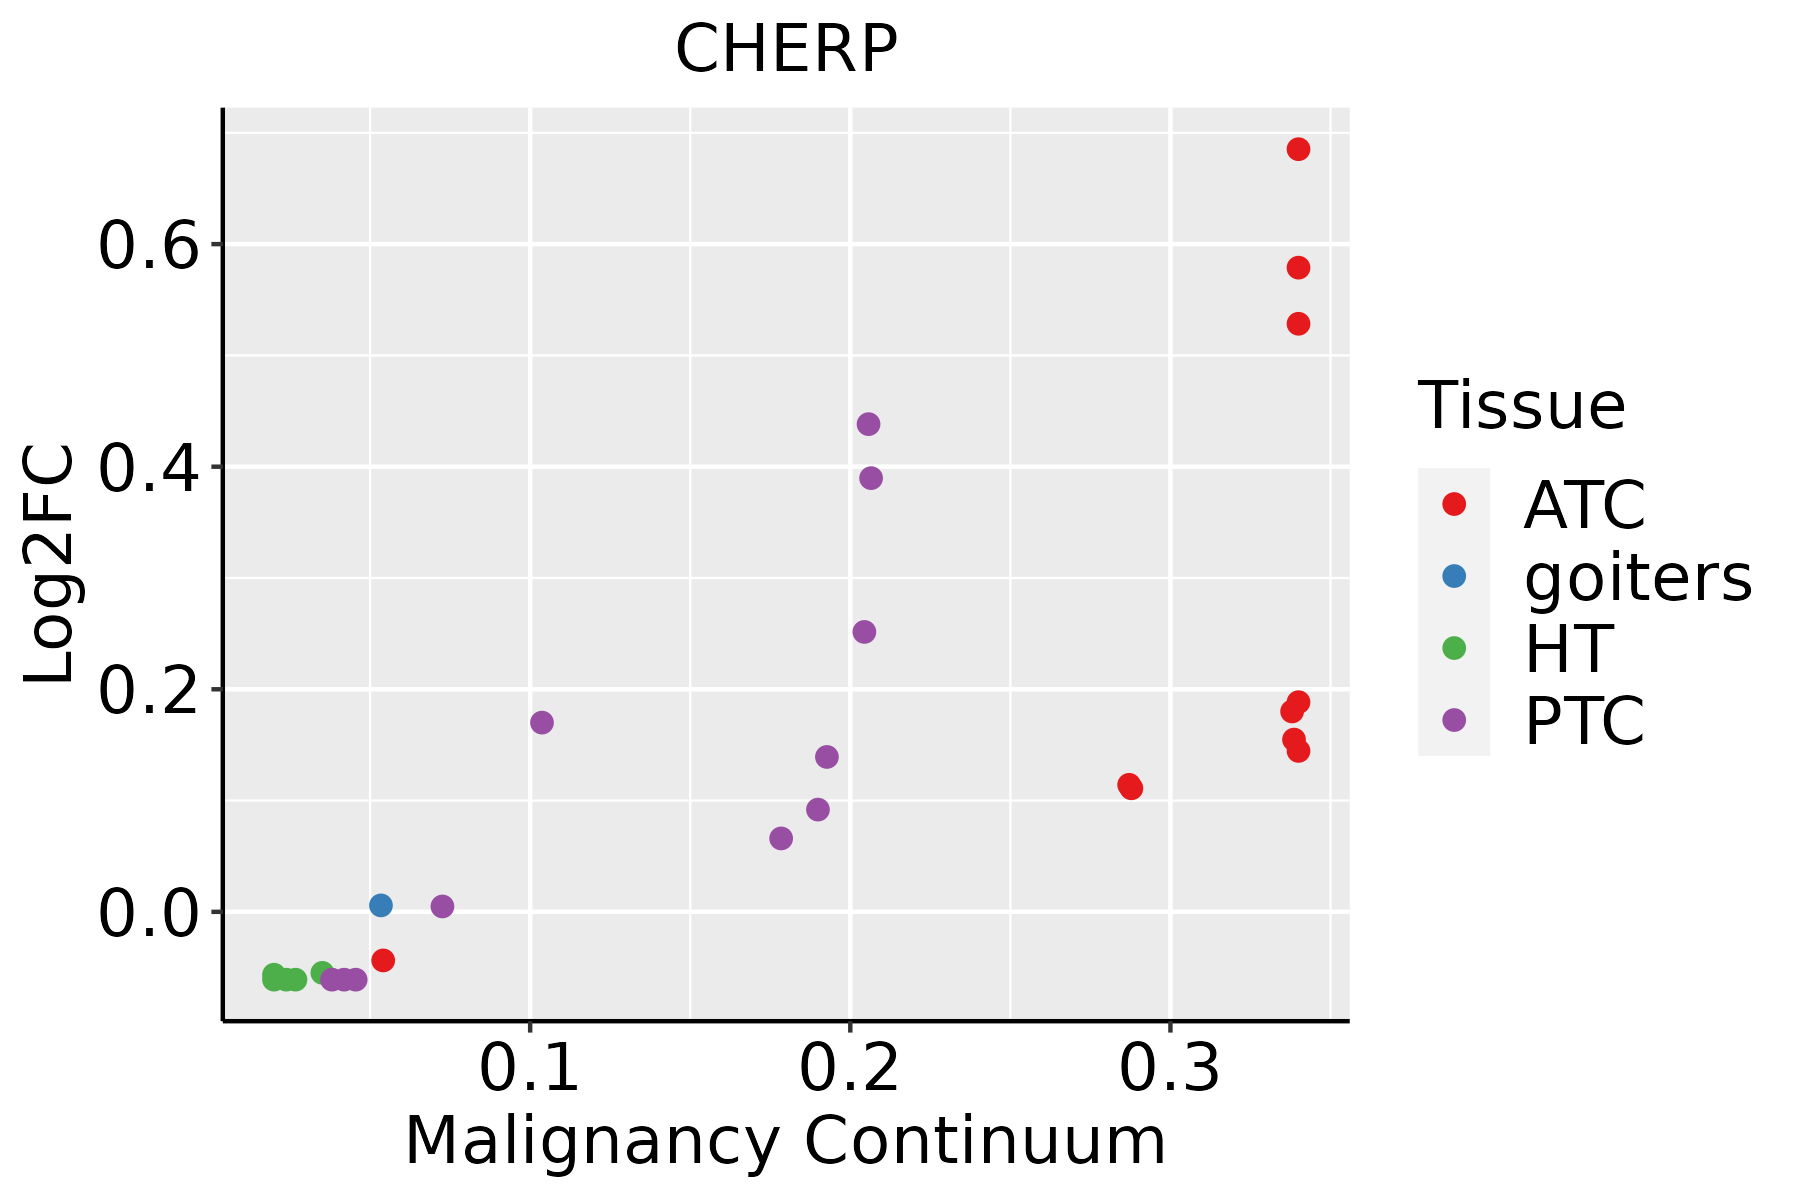 | ATC: Anaplastic thyroid cancer |
| HT: Hashimoto's thyroiditis | ||
| PTC: Papillary thyroid cancer |
| ∗log2FC in expression of this searched gene in stem-like cells from each diseased tissue sample relative to stem-like cells in normal samples in each tissue plotted against the malignancy continuum. Samples are colored based on if they are from different disease stage. |
Top |
Malignant transformation related pathway analysis |
| Find out the enriched GO biological processes and KEGG pathways involved in transition from healthy to precancer to cancer |
| Tissue | Disease Stage | Enriched GO biological Processes |
| Colorectum | CRC |  |
| Stomach | GC |  |
| Stomach | CAG with IM |  |
| Stomach | CSG |  |
| Stomach | CAG |  |
| ∗Top 15 enriched GO BP terms are showed in the bar plot of each disease state in each tissue. Each row represents a significant GO biological process which is colored according to the -log10(p.adjust). |
| Page: 1 2 3 4 5 6 7 8 9 |
| GO ID | Tissue | Disease Stage | Description | Gene Ratio | Bg Ratio | pvalue | p.adjust | Count |
| GO:0051235110 | Esophagus | ESCC | maintenance of location | 200/8552 | 327/18723 | 1.01e-08 | 2.02e-07 | 200 |
| GO:0051651111 | Esophagus | ESCC | maintenance of location in cell | 126/8552 | 214/18723 | 6.57e-05 | 5.00e-04 | 126 |
| GO:005123521 | Liver | HCC | maintenance of location | 185/7958 | 327/18723 | 1.70e-07 | 3.12e-06 | 185 |
| GO:005165112 | Liver | HCC | maintenance of location in cell | 119/7958 | 214/18723 | 7.11e-05 | 6.39e-04 | 119 |
| GO:005123518 | Oral cavity | OSCC | maintenance of location | 182/7305 | 327/18723 | 6.16e-10 | 1.58e-08 | 182 |
| GO:005165120 | Oral cavity | OSCC | maintenance of location in cell | 121/7305 | 214/18723 | 1.39e-07 | 2.32e-06 | 121 |
| GO:00331733 | Oral cavity | OSCC | calcineurin-NFAT signaling cascade | 26/7305 | 43/18723 | 3.55e-03 | 1.49e-02 | 26 |
| GO:00480164 | Oral cavity | OSCC | inositol phosphate-mediated signaling | 30/7305 | 55/18723 | 1.39e-02 | 4.59e-02 | 30 |
| GO:00708843 | Oral cavity | OSCC | regulation of calcineurin-NFAT signaling cascade | 20/7305 | 34/18723 | 1.51e-02 | 4.91e-02 | 20 |
| GO:0050850 | Oral cavity | OSCC | positive regulation of calcium-mediated signaling | 19/7305 | 32/18723 | 1.56e-02 | 5.00e-02 | 19 |
| GO:0051235112 | Thyroid | PTC | maintenance of location | 148/5968 | 327/18723 | 2.30e-07 | 4.07e-06 | 148 |
| GO:0051651113 | Thyroid | PTC | maintenance of location in cell | 100/5968 | 214/18723 | 3.65e-06 | 4.67e-05 | 100 |
| GO:005123532 | Thyroid | ATC | maintenance of location | 152/6293 | 327/18723 | 7.84e-07 | 1.04e-05 | 152 |
| GO:005165133 | Thyroid | ATC | maintenance of location in cell | 105/6293 | 214/18723 | 1.92e-06 | 2.31e-05 | 105 |
| GO:00508483 | Thyroid | ATC | regulation of calcium-mediated signaling | 36/6293 | 73/18723 | 3.91e-03 | 1.70e-02 | 36 |
| Page: 1 |
| Pathway ID | Tissue | Disease Stage | Description | Gene Ratio | Bg Ratio | pvalue | p.adjust | qvalue | Count |
| hsa0304027 | Esophagus | ESCC | Spliceosome | 128/4205 | 217/8465 | 3.31e-03 | 8.79e-03 | 4.50e-03 | 128 |
| hsa0304037 | Esophagus | ESCC | Spliceosome | 128/4205 | 217/8465 | 3.31e-03 | 8.79e-03 | 4.50e-03 | 128 |
| hsa0304022 | Liver | HCC | Spliceosome | 122/4020 | 217/8465 | 5.55e-03 | 1.60e-02 | 8.91e-03 | 122 |
| hsa0304032 | Liver | HCC | Spliceosome | 122/4020 | 217/8465 | 5.55e-03 | 1.60e-02 | 8.91e-03 | 122 |
| hsa0304016 | Oral cavity | OSCC | Spliceosome | 123/3704 | 217/8465 | 7.21e-05 | 2.74e-04 | 1.40e-04 | 123 |
| hsa0304017 | Oral cavity | OSCC | Spliceosome | 123/3704 | 217/8465 | 7.21e-05 | 2.74e-04 | 1.40e-04 | 123 |
| Page: 1 |
Top |
Cell-cell communication analysis |
| Identification of potential cell-cell interactions between two cell types and their ligand-receptor pairs for different disease states |
| Ligand | Receptor | LRpair | Pathway | Tissue | Disease Stage |
| Page: 1 |
Top |
Single-cell gene regulatory network inference analysis |
| Find out the significant the regulons (TFs) and the target genes of each regulon across cell types for different disease states |
| TF | Cell Type | Tissue | Disease Stage | Target Gene | RSS | Regulon Activity |
| ∗The dot plots of a searched regulon are shown for all cell subpopulations in each disease state of each tissue based on the regulon specific score inferred using pySCENIC and by calculating the average expression. |
| Page: 1 |
Top |
Somatic mutation of malignant transformation related genes |
| Annotation of somatic variants for genes involved in malignant transformation |
| Hugo Symbol | Variant Class | Variant Classification | dbSNP RS | HGVSc | HGVSp | HGVSp Short | SWISSPROT | BIOTYPE | SIFT | PolyPhen | Tumor Sample Barcode | Tissue | Histology | Sex | Age | Stage | Therapy Types | Drugs | Outcome |
| CHERP | SNV | Missense_Mutation | rs201274229 | c.2626G>A | p.Val876Ile | p.V876I | Q8IWX8 | protein_coding | tolerated(0.37) | benign(0) | TCGA-BH-A8G0-01 | Breast | breast invasive carcinoma | Female | <65 | I/II | Chemotherapy | taxotere | CR |
| CHERP | SNV | Missense_Mutation | c.2193G>C | p.Lys731Asn | p.K731N | Q8IWX8 | protein_coding | tolerated(0.2) | probably_damaging(0.981) | TCGA-E2-A2P6-01 | Breast | breast invasive carcinoma | Female | >=65 | I/II | Hormone Therapy | anastrozole | SD | |
| CHERP | SNV | Missense_Mutation | novel | c.91G>C | p.Glu31Gln | p.E31Q | Q8IWX8 | protein_coding | deleterious(0) | probably_damaging(0.992) | TCGA-OL-A5DA-01 | Breast | breast invasive carcinoma | Female | <65 | I/II | Unknown | Unknown | SD |
| CHERP | insertion | Frame_Shift_Ins | novel | c.925_926insACCTTTTAATTAGATACAGTAAAGA | p.Ala309AspfsTer50 | p.A309Dfs*50 | Q8IWX8 | protein_coding | TCGA-AO-A0J5-01 | Breast | breast invasive carcinoma | Female | <65 | III/IV | Other, specify in notesBisphosphonate | zoledronic | PD | ||
| CHERP | deletion | Frame_Shift_Del | novel | c.751delG | p.Ala251ProfsTer404 | p.A251Pfs*404 | Q8IWX8 | protein_coding | TCGA-E9-A3HO-01 | Breast | breast invasive carcinoma | Female | <65 | I/II | Chemotherapy | cyclophosphamide | CR | ||
| CHERP | SNV | Missense_Mutation | rs751451818 | c.2432N>A | p.Arg811His | p.R811H | Q8IWX8 | protein_coding | tolerated(0.2) | benign(0.003) | TCGA-2W-A8YY-01 | Cervix | cervical & endocervical cancer | Female | <65 | I/II | Chemotherapy | cisplatin | CR |
| CHERP | SNV | Missense_Mutation | c.1045N>C | p.Ala349Pro | p.A349P | Q8IWX8 | protein_coding | tolerated(0.19) | benign(0.278) | TCGA-C5-A1BM-01 | Cervix | cervical & endocervical cancer | Female | >=65 | I/II | Unknown | Unknown | SD | |
| CHERP | SNV | Missense_Mutation | c.1429N>A | p.Asp477Asn | p.D477N | Q8IWX8 | protein_coding | tolerated_low_confidence(0.05) | benign(0.052) | TCGA-LP-A4AU-01 | Cervix | cervical & endocervical cancer | Female | <65 | III/IV | Chemotherapy | cisplatin | CR | |
| CHERP | SNV | Missense_Mutation | novel | c.2402N>A | p.Arg801Gln | p.R801Q | Q8IWX8 | protein_coding | tolerated(0.06) | possibly_damaging(0.885) | TCGA-VS-A9V4-01 | Cervix | cervical & endocervical cancer | Female | <65 | I/II | Chemotherapy | cisplatin | PD |
| CHERP | insertion | Frame_Shift_Ins | novel | c.62_63insAGAAAGAG | p.Phe22GlufsTer15 | p.F22Efs*15 | Q8IWX8 | protein_coding | TCGA-DS-A1OB-01 | Cervix | cervical & endocervical cancer | Female | <65 | I/II | Chemotherapy | carboplatin | PD |
| Page: 1 2 3 4 5 6 7 8 9 |
Top |
Related drugs of malignant transformation related genes |
| Identification of chemicals and drugs interact with genes involved in malignant transfromation |
| (DGIdb 4.0) |
| Entrez ID | Symbol | Category | Interaction Types | Drug Claim Name | Drug Name | PMIDs |
| Page: 1 |

Copyright 2023-Present -The University of Texas Health Science Center at Houston |