
|
|||||
|
 | |
| |
| |
| |
| |
| |
|
Gene: CERT1 |
Gene summary for CERT1 |
| Gene information | Species | Human | Gene symbol | CERT1 | Gene ID | 10087 |
| Gene name | ceramide transporter 1 | |
| Gene Alias | CERT | |
| Cytomap | 5q13.3 | |
| Gene Type | protein-coding | GO ID | GO:0000902 | UniProtAcc | Q9Y5P4 |
Top |
Malignant transformation analysis |
| Identification of the aberrant gene expression in precancerous and cancerous lesions by comparing the gene expression of stem-like cells in diseased tissues with normal stem cells |
| Entrez ID | Symbol | Replicates | Species | Organ | Tissue | Adj P-value | Log2FC | Malignancy |
| 10087 | CERT1 | HTA11_3410_2000001011 | Human | Colorectum | AD | 1.92e-09 | 2.13e-01 | 0.0155 |
| 10087 | CERT1 | HTA11_2487_2000001011 | Human | Colorectum | SER | 1.32e-08 | 2.75e-01 | -0.1808 |
| 10087 | CERT1 | HTA11_2951_2000001011 | Human | Colorectum | AD | 3.40e-02 | 2.22e-01 | 0.0216 |
| 10087 | CERT1 | HTA11_1938_2000001011 | Human | Colorectum | AD | 1.06e-19 | 5.72e-01 | -0.0811 |
| 10087 | CERT1 | HTA11_78_2000001011 | Human | Colorectum | AD | 1.83e-27 | 6.13e-01 | -0.1088 |
| 10087 | CERT1 | HTA11_347_2000001011 | Human | Colorectum | AD | 1.10e-46 | 8.26e-01 | -0.1954 |
| 10087 | CERT1 | HTA11_411_2000001011 | Human | Colorectum | SER | 2.50e-11 | 6.00e-01 | -0.2602 |
| 10087 | CERT1 | HTA11_2112_2000001011 | Human | Colorectum | SER | 1.71e-03 | 3.07e-01 | -0.2196 |
| 10087 | CERT1 | HTA11_3361_2000001011 | Human | Colorectum | AD | 2.57e-07 | 2.99e-01 | -0.1207 |
| 10087 | CERT1 | HTA11_83_2000001011 | Human | Colorectum | SER | 4.13e-10 | 3.34e-01 | -0.1526 |
| 10087 | CERT1 | HTA11_696_2000001011 | Human | Colorectum | AD | 7.63e-19 | 3.37e-01 | -0.1464 |
| 10087 | CERT1 | HTA11_866_2000001011 | Human | Colorectum | AD | 9.02e-22 | 4.08e-01 | -0.1001 |
| 10087 | CERT1 | HTA11_1391_2000001011 | Human | Colorectum | AD | 2.20e-22 | 4.99e-01 | -0.059 |
| 10087 | CERT1 | HTA11_2992_2000001011 | Human | Colorectum | SER | 1.72e-05 | 3.10e-01 | -0.1706 |
| 10087 | CERT1 | HTA11_5212_2000001011 | Human | Colorectum | AD | 8.16e-07 | 3.22e-01 | -0.2061 |
| 10087 | CERT1 | HTA11_5216_2000001011 | Human | Colorectum | SER | 3.03e-06 | 3.63e-01 | -0.1462 |
| 10087 | CERT1 | HTA11_546_2000001011 | Human | Colorectum | AD | 4.83e-08 | 3.33e-01 | -0.0842 |
| 10087 | CERT1 | HTA11_866_3004761011 | Human | Colorectum | AD | 1.51e-05 | 1.77e-01 | 0.096 |
| 10087 | CERT1 | HTA11_8622_2000001021 | Human | Colorectum | SER | 1.13e-05 | 3.07e-01 | 0.0528 |
| 10087 | CERT1 | HTA11_7663_2000001011 | Human | Colorectum | SER | 6.70e-11 | 5.64e-01 | 0.0131 |
| Page: 1 2 3 4 |
| Tissue | Expression Dynamics | Abbreviation |
| Colorectum (GSE201348) |  | FAP: Familial adenomatous polyposis |
| CRC: Colorectal cancer | ||
| Colorectum (HTA11) |  | AD: Adenomas |
| SER: Sessile serrated lesions | ||
| MSI-H: Microsatellite-high colorectal cancer | ||
| MSS: Microsatellite stable colorectal cancer | ||
| Endometrium | 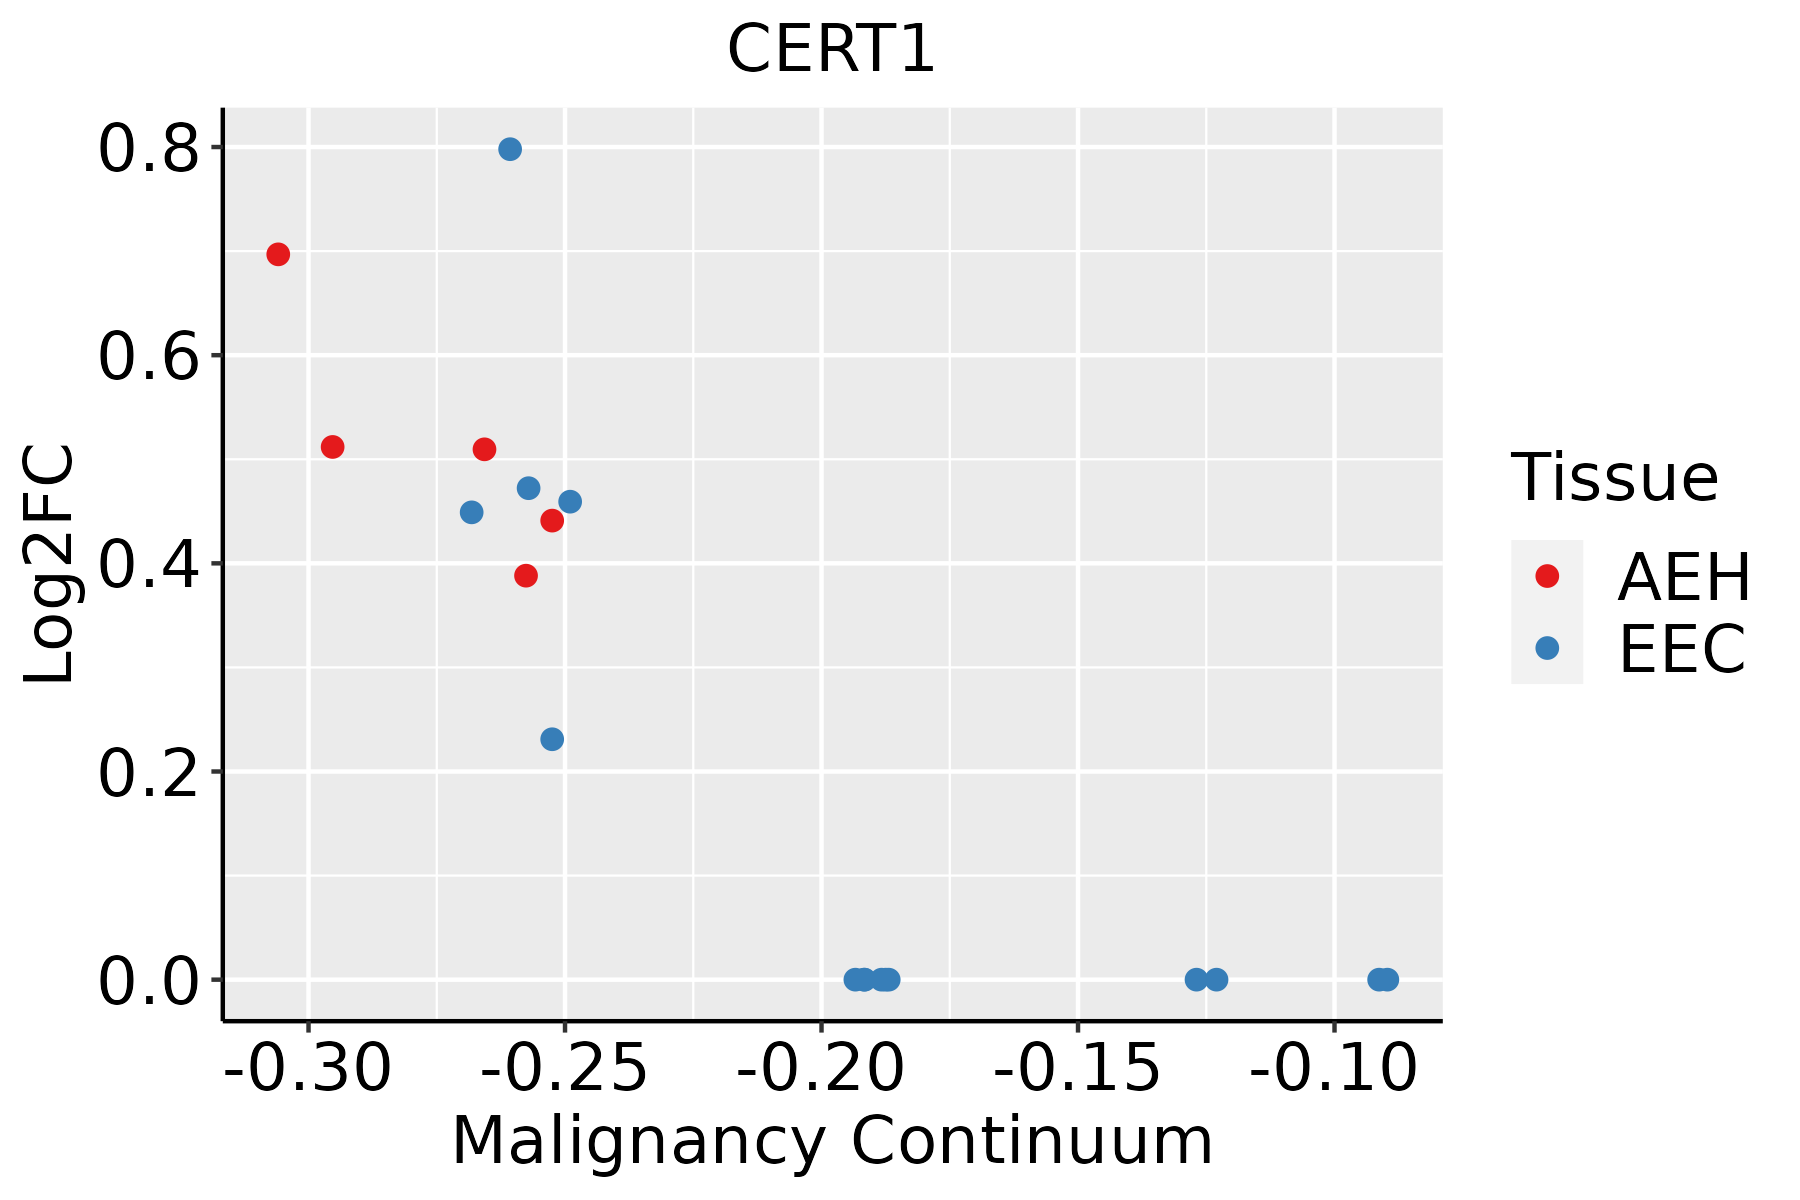 | AEH: Atypical endometrial hyperplasia |
| EEC: Endometrioid Cancer | ||
| Lung |  | AAH: Atypical adenomatous hyperplasia |
| AIS: Adenocarcinoma in situ | ||
| IAC: Invasive lung adenocarcinoma | ||
| MIA: Minimally invasive adenocarcinoma | ||
| Skin | 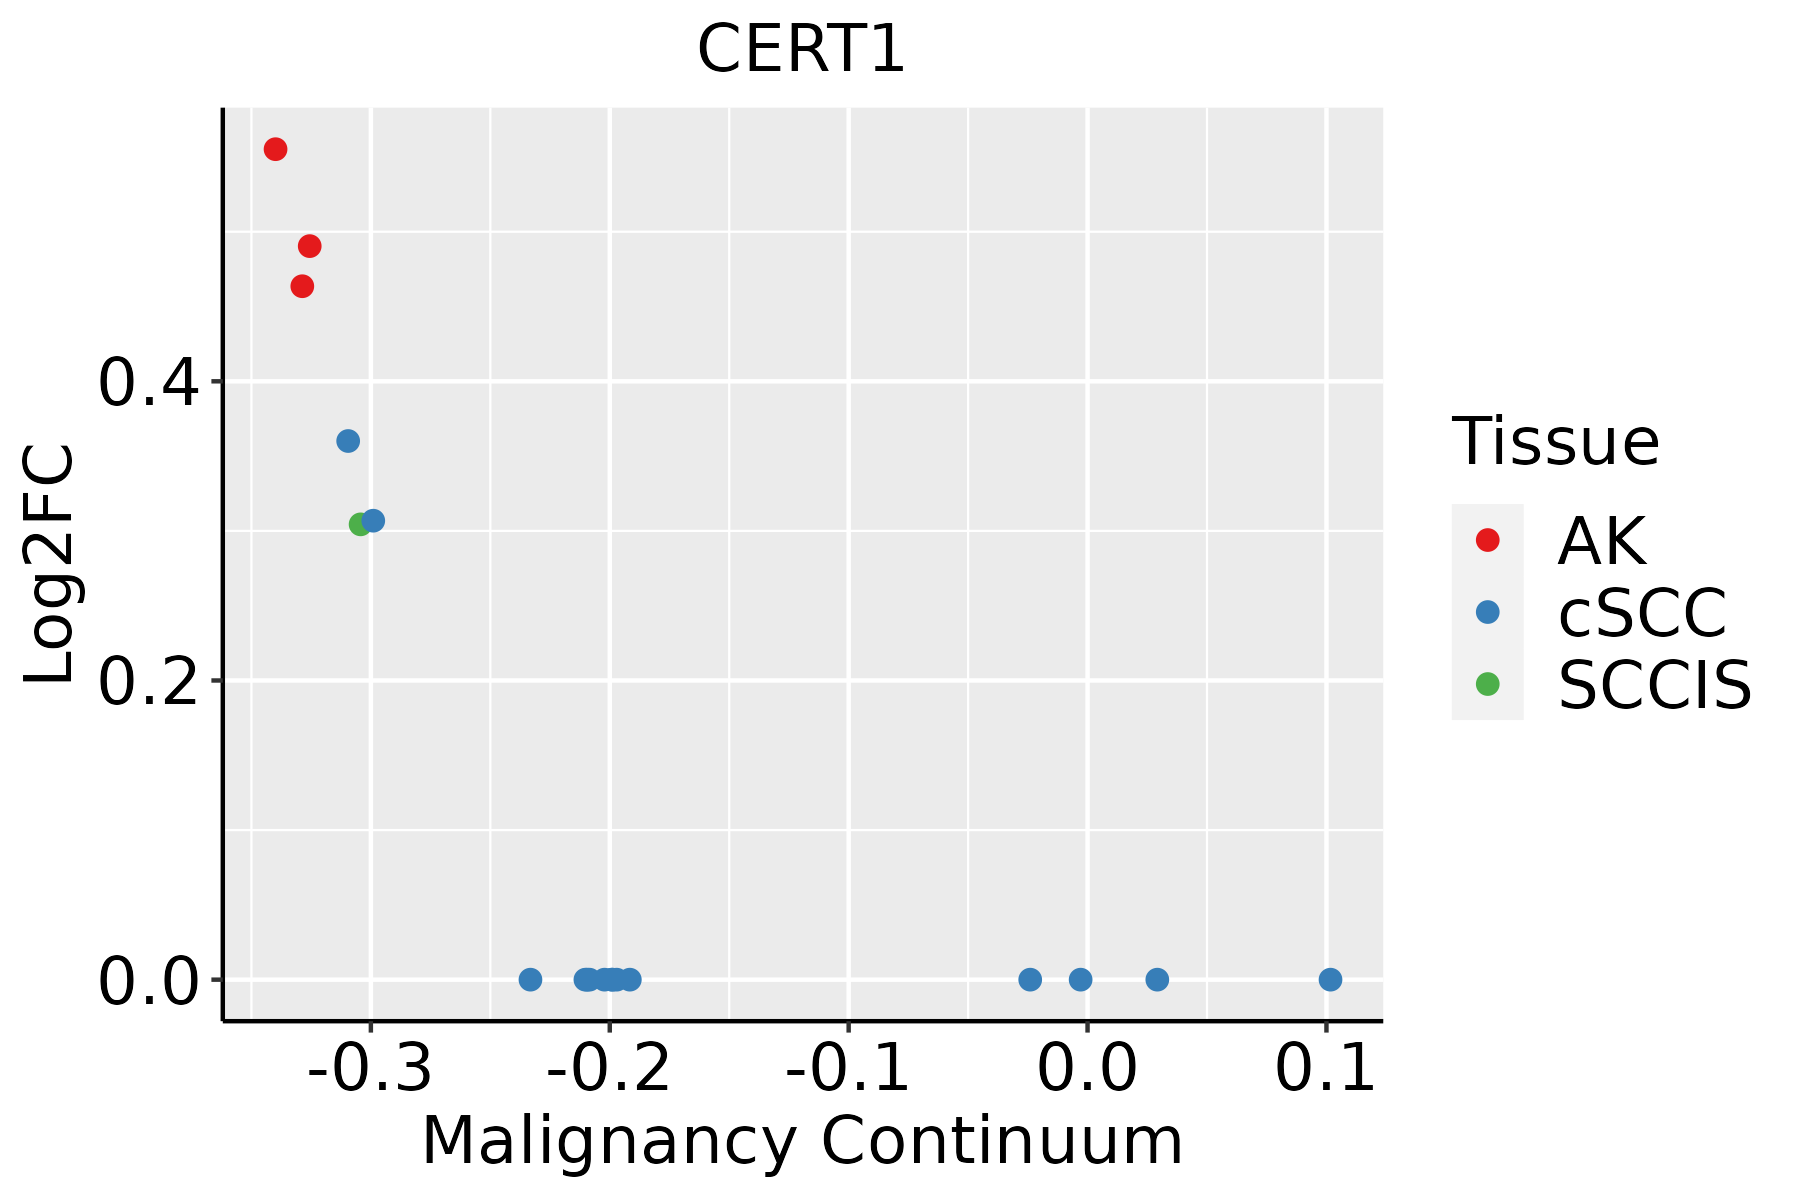 | AK: Actinic keratosis |
| cSCC: Cutaneous squamous cell carcinoma | ||
| SCCIS:squamous cell carcinoma in situ |
| ∗log2FC in expression of this searched gene in stem-like cells from each diseased tissue sample relative to stem-like cells in normal samples in each tissue plotted against the malignancy continuum. Samples are colored based on if they are from different disease stage. |
Top |
Malignant transformation related pathway analysis |
| Find out the enriched GO biological processes and KEGG pathways involved in transition from healthy to precancer to cancer |
| Tissue | Disease Stage | Enriched GO biological Processes |
| Colorectum | CRC |  |
| Stomach | GC |  |
| Stomach | CAG with IM |  |
| Stomach | CSG |  |
| Stomach | CAG |  |
| ∗Top 15 enriched GO BP terms are showed in the bar plot of each disease state in each tissue. Each row represents a significant GO biological process which is colored according to the -log10(p.adjust). |
| Page: 1 2 3 4 5 6 7 8 9 |
| GO ID | Tissue | Disease Stage | Description | Gene Ratio | Bg Ratio | pvalue | p.adjust | Count |
| GO:0034976 | Colorectum | AD | response to endoplasmic reticulum stress | 90/3918 | 256/18723 | 8.48e-08 | 4.28e-06 | 90 |
| GO:0001701 | Colorectum | AD | in utero embryonic development | 110/3918 | 367/18723 | 2.36e-05 | 4.62e-04 | 110 |
| GO:0070584 | Colorectum | AD | mitochondrion morphogenesis | 12/3918 | 21/18723 | 3.02e-04 | 3.62e-03 | 12 |
| GO:0007029 | Colorectum | AD | endoplasmic reticulum organization | 31/3918 | 87/18723 | 1.08e-03 | 1.00e-02 | 31 |
| GO:0010876 | Colorectum | AD | lipid localization | 120/3918 | 448/18723 | 1.59e-03 | 1.33e-02 | 120 |
| GO:0006869 | Colorectum | AD | lipid transport | 108/3918 | 398/18723 | 1.67e-03 | 1.39e-02 | 108 |
| GO:0042886 | Colorectum | AD | amide transport | 83/3918 | 301/18723 | 3.37e-03 | 2.46e-02 | 83 |
| GO:0015748 | Colorectum | AD | organophosphate ester transport | 42/3918 | 140/18723 | 7.04e-03 | 4.31e-02 | 42 |
| GO:00349761 | Colorectum | SER | response to endoplasmic reticulum stress | 74/2897 | 256/18723 | 3.01e-08 | 2.05e-06 | 74 |
| GO:00705841 | Colorectum | SER | mitochondrion morphogenesis | 9/2897 | 21/18723 | 2.50e-03 | 2.33e-02 | 9 |
| GO:00017011 | Colorectum | SER | in utero embryonic development | 77/2897 | 367/18723 | 2.77e-03 | 2.48e-02 | 77 |
| GO:0003012 | Colorectum | SER | muscle system process | 92/2897 | 452/18723 | 2.98e-03 | 2.63e-02 | 92 |
| GO:00070291 | Colorectum | SER | endoplasmic reticulum organization | 23/2897 | 87/18723 | 5.77e-03 | 4.23e-02 | 23 |
| GO:003497616 | Endometrium | AEH | response to endoplasmic reticulum stress | 62/2100 | 256/18723 | 2.88e-09 | 2.13e-07 | 62 |
| GO:00017019 | Endometrium | AEH | in utero embryonic development | 73/2100 | 367/18723 | 7.18e-07 | 2.63e-05 | 73 |
| GO:00030126 | Endometrium | AEH | muscle system process | 78/2100 | 452/18723 | 6.89e-05 | 1.06e-03 | 78 |
| GO:00030072 | Endometrium | AEH | heart morphogenesis | 45/2100 | 246/18723 | 6.41e-04 | 6.23e-03 | 45 |
| GO:0006936 | Endometrium | AEH | muscle contraction | 59/2100 | 347/18723 | 7.32e-04 | 6.99e-03 | 59 |
| GO:003497617 | Endometrium | EEC | response to endoplasmic reticulum stress | 63/2168 | 256/18723 | 3.84e-09 | 2.71e-07 | 63 |
| GO:000170114 | Endometrium | EEC | in utero embryonic development | 75/2168 | 367/18723 | 5.86e-07 | 2.16e-05 | 75 |
| Page: 1 2 3 |
| Pathway ID | Tissue | Disease Stage | Description | Gene Ratio | Bg Ratio | pvalue | p.adjust | qvalue | Count |
| Page: 1 |
Top |
Cell-cell communication analysis |
| Identification of potential cell-cell interactions between two cell types and their ligand-receptor pairs for different disease states |
| Ligand | Receptor | LRpair | Pathway | Tissue | Disease Stage |
| Page: 1 |
Top |
Single-cell gene regulatory network inference analysis |
| Find out the significant the regulons (TFs) and the target genes of each regulon across cell types for different disease states |
| TF | Cell Type | Tissue | Disease Stage | Target Gene | RSS | Regulon Activity |
| ∗The dot plots of a searched regulon are shown for all cell subpopulations in each disease state of each tissue based on the regulon specific score inferred using pySCENIC and by calculating the average expression. |
| Page: 1 |
Top |
Somatic mutation of malignant transformation related genes |
| Annotation of somatic variants for genes involved in malignant transformation |
| Hugo Symbol | Variant Class | Variant Classification | dbSNP RS | HGVSc | HGVSp | HGVSp Short | SWISSPROT | BIOTYPE | SIFT | PolyPhen | Tumor Sample Barcode | Tissue | Histology | Sex | Age | Stage | Therapy Types | Drugs | Outcome |
| Page: 1 |
Top |
Related drugs of malignant transformation related genes |
| Identification of chemicals and drugs interact with genes involved in malignant transfromation |
| (DGIdb 4.0) |
| Entrez ID | Symbol | Category | Interaction Types | Drug Claim Name | Drug Name | PMIDs |
| Page: 1 |

Copyright 2023-Present -The University of Texas Health Science Center at Houston |