
|
|||||
|
 | |
| |
| |
| |
| |
| |
|
Gene: CANT1 |
Gene summary for CANT1 |
| Gene information | Species | Human | Gene symbol | CANT1 | Gene ID | 124583 |
| Gene name | calcium activated nucleotidase 1 | |
| Gene Alias | DBQD | |
| Cytomap | 17q25.3 | |
| Gene Type | protein-coding | GO ID | GO:0006029 | UniProtAcc | A0A024R8U8 |
Top |
Malignant transformation analysis |
| Identification of the aberrant gene expression in precancerous and cancerous lesions by comparing the gene expression of stem-like cells in diseased tissues with normal stem cells |
| Entrez ID | Symbol | Replicates | Species | Organ | Tissue | Adj P-value | Log2FC | Malignancy |
| 124583 | CANT1 | HTA11_3410_2000001011 | Human | Colorectum | AD | 6.21e-11 | 3.77e-01 | 0.0155 |
| 124583 | CANT1 | HTA11_2487_2000001011 | Human | Colorectum | SER | 2.26e-17 | 8.00e-01 | -0.1808 |
| 124583 | CANT1 | HTA11_1938_2000001011 | Human | Colorectum | AD | 3.52e-18 | 7.81e-01 | -0.0811 |
| 124583 | CANT1 | HTA11_78_2000001011 | Human | Colorectum | AD | 3.69e-11 | 5.79e-01 | -0.1088 |
| 124583 | CANT1 | HTA11_347_2000001011 | Human | Colorectum | AD | 2.45e-44 | 1.09e+00 | -0.1954 |
| 124583 | CANT1 | HTA11_411_2000001011 | Human | Colorectum | SER | 5.06e-12 | 1.32e+00 | -0.2602 |
| 124583 | CANT1 | HTA11_2112_2000001011 | Human | Colorectum | SER | 3.71e-14 | 1.43e+00 | -0.2196 |
| 124583 | CANT1 | HTA11_3361_2000001011 | Human | Colorectum | AD | 6.13e-13 | 7.74e-01 | -0.1207 |
| 124583 | CANT1 | HTA11_83_2000001011 | Human | Colorectum | SER | 8.50e-13 | 7.78e-01 | -0.1526 |
| 124583 | CANT1 | HTA11_696_2000001011 | Human | Colorectum | AD | 1.05e-49 | 1.27e+00 | -0.1464 |
| 124583 | CANT1 | HTA11_866_2000001011 | Human | Colorectum | AD | 6.07e-17 | 5.85e-01 | -0.1001 |
| 124583 | CANT1 | HTA11_1391_2000001011 | Human | Colorectum | AD | 9.15e-25 | 9.99e-01 | -0.059 |
| 124583 | CANT1 | HTA11_2992_2000001011 | Human | Colorectum | SER | 3.81e-06 | 8.66e-01 | -0.1706 |
| 124583 | CANT1 | HTA11_5212_2000001011 | Human | Colorectum | AD | 1.43e-03 | 5.47e-01 | -0.2061 |
| 124583 | CANT1 | HTA11_5216_2000001011 | Human | Colorectum | SER | 2.88e-06 | 7.72e-01 | -0.1462 |
| 124583 | CANT1 | HTA11_546_2000001011 | Human | Colorectum | AD | 4.15e-13 | 8.75e-01 | -0.0842 |
| 124583 | CANT1 | HTA11_7862_2000001011 | Human | Colorectum | AD | 3.82e-06 | 4.49e-01 | -0.0179 |
| 124583 | CANT1 | HTA11_866_3004761011 | Human | Colorectum | AD | 4.99e-07 | 4.08e-01 | 0.096 |
| 124583 | CANT1 | HTA11_4255_2000001011 | Human | Colorectum | SER | 7.04e-05 | 8.06e-01 | 0.0446 |
| 124583 | CANT1 | HTA11_8622_2000001021 | Human | Colorectum | SER | 4.86e-10 | 9.17e-01 | 0.0528 |
| Page: 1 2 3 4 5 6 7 |
| Tissue | Expression Dynamics | Abbreviation |
| Colorectum (GSE201348) |  | FAP: Familial adenomatous polyposis |
| CRC: Colorectal cancer | ||
| Colorectum (HTA11) |  | AD: Adenomas |
| SER: Sessile serrated lesions | ||
| MSI-H: Microsatellite-high colorectal cancer | ||
| MSS: Microsatellite stable colorectal cancer | ||
| Esophagus | 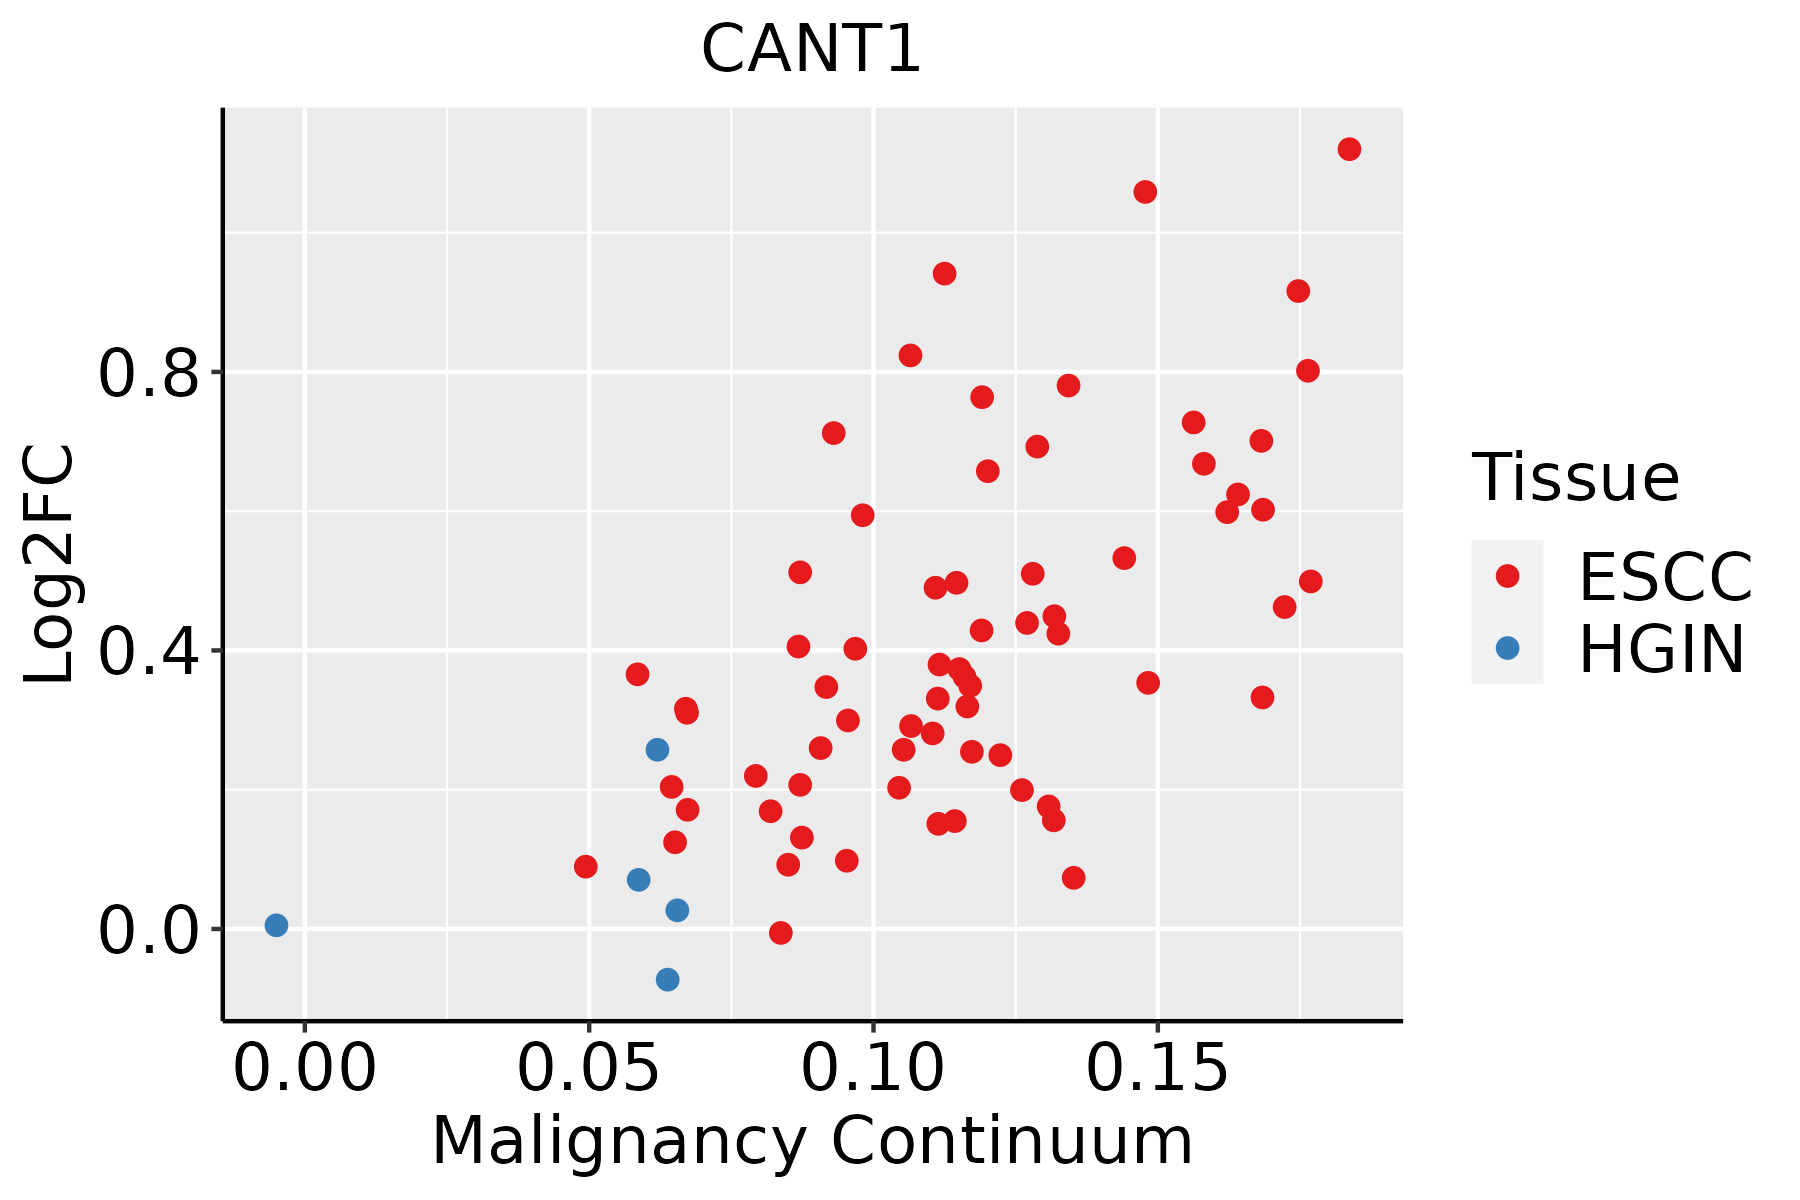 | ESCC: Esophageal squamous cell carcinoma |
| HGIN: High-grade intraepithelial neoplasias | ||
| LGIN: Low-grade intraepithelial neoplasias | ||
| Liver |  | HCC: Hepatocellular carcinoma |
| NAFLD: Non-alcoholic fatty liver disease | ||
| Oral Cavity | 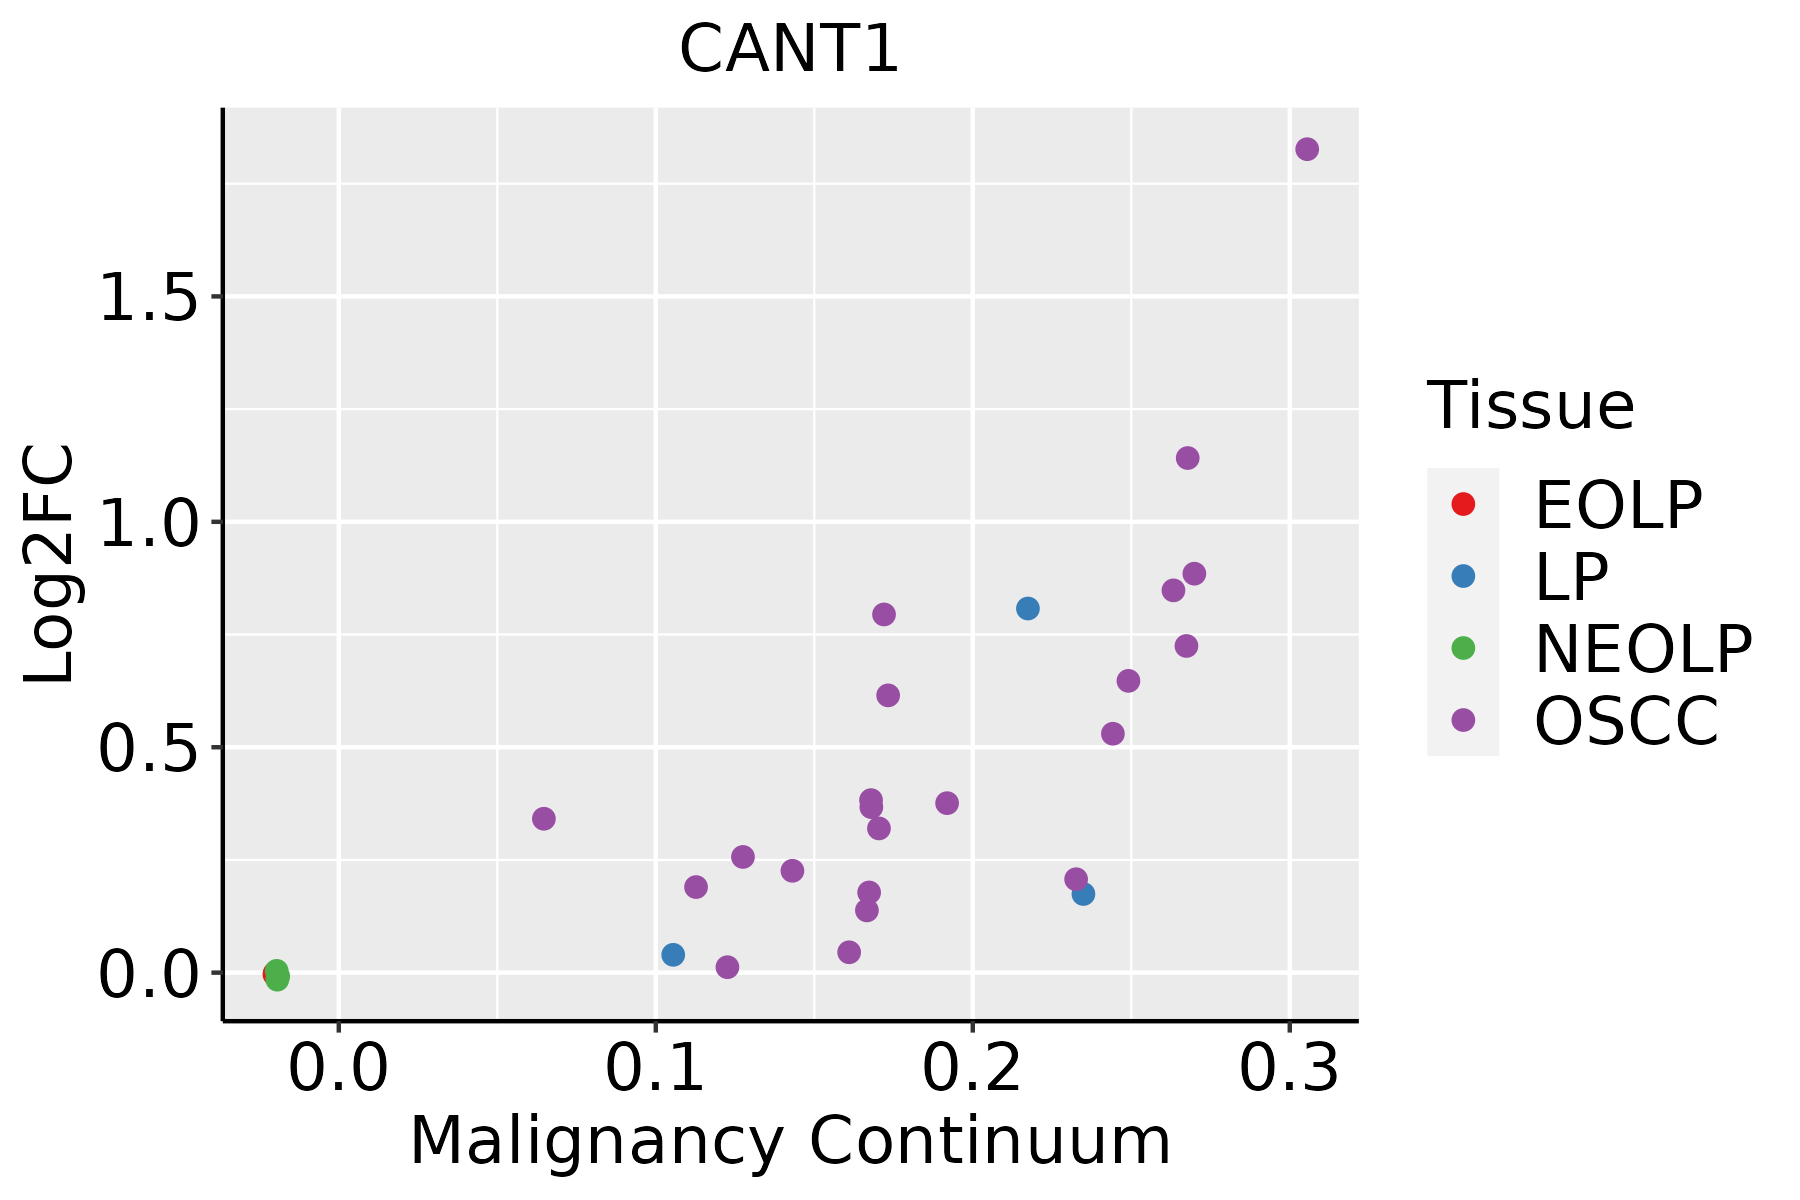 | EOLP: Erosive Oral lichen planus |
| LP: leukoplakia | ||
| NEOLP: Non-erosive oral lichen planus | ||
| OSCC: Oral squamous cell carcinoma | ||
| Prostate |  | BPH: Benign Prostatic Hyperplasia |
| Skin |  | AK: Actinic keratosis |
| cSCC: Cutaneous squamous cell carcinoma | ||
| SCCIS:squamous cell carcinoma in situ | ||
| Thyroid | 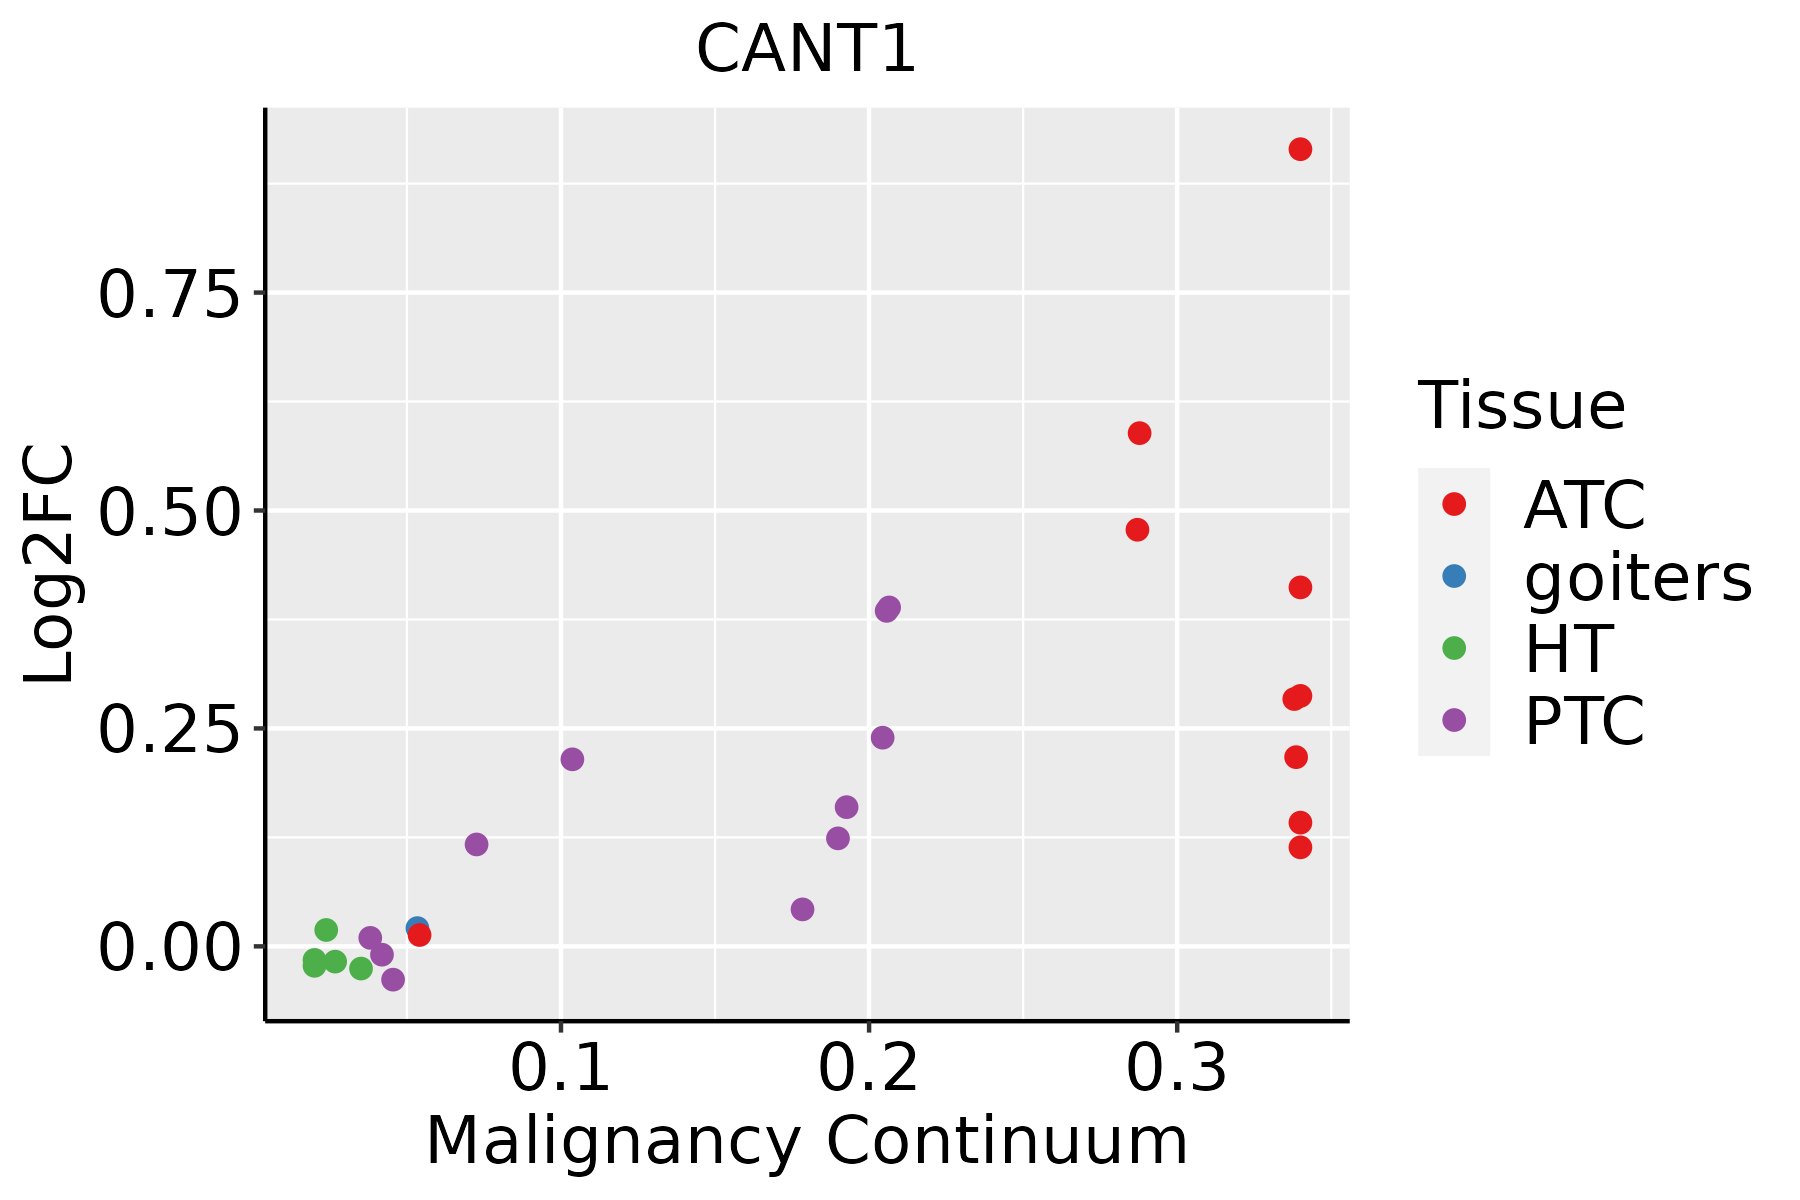 | ATC: Anaplastic thyroid cancer |
| HT: Hashimoto's thyroiditis | ||
| PTC: Papillary thyroid cancer |
| ∗log2FC in expression of this searched gene in stem-like cells from each diseased tissue sample relative to stem-like cells in normal samples in each tissue plotted against the malignancy continuum. Samples are colored based on if they are from different disease stage. |
Top |
Malignant transformation related pathway analysis |
| Find out the enriched GO biological processes and KEGG pathways involved in transition from healthy to precancer to cancer |
| Tissue | Disease Stage | Enriched GO biological Processes |
| Colorectum | CRC |  |
| Stomach | GC |  |
| Stomach | CAG with IM |  |
| Stomach | CSG |  |
| Stomach | CAG |  |
| ∗Top 15 enriched GO BP terms are showed in the bar plot of each disease state in each tissue. Each row represents a significant GO biological process which is colored according to the -log10(p.adjust). |
| Page: 1 2 3 4 5 6 7 8 9 |
| GO ID | Tissue | Disease Stage | Description | Gene Ratio | Bg Ratio | pvalue | p.adjust | Count |
| GO:0043123 | Colorectum | AD | positive regulation of I-kappaB kinase/NF-kappaB signaling | 60/3918 | 186/18723 | 1.91e-04 | 2.56e-03 | 60 |
| GO:0043122 | Colorectum | AD | regulation of I-kappaB kinase/NF-kappaB signaling | 76/3918 | 249/18723 | 2.17e-04 | 2.85e-03 | 76 |
| GO:0007249 | Colorectum | AD | I-kappaB kinase/NF-kappaB signaling | 82/3918 | 281/18723 | 6.09e-04 | 6.40e-03 | 82 |
| GO:00431221 | Colorectum | MSS | regulation of I-kappaB kinase/NF-kappaB signaling | 71/3467 | 249/18723 | 7.12e-05 | 1.21e-03 | 71 |
| GO:00072491 | Colorectum | MSS | I-kappaB kinase/NF-kappaB signaling | 77/3467 | 281/18723 | 1.51e-04 | 2.19e-03 | 77 |
| GO:00431231 | Colorectum | MSS | positive regulation of I-kappaB kinase/NF-kappaB signaling | 55/3467 | 186/18723 | 1.60e-04 | 2.29e-03 | 55 |
| GO:00431222 | Colorectum | FAP | regulation of I-kappaB kinase/NF-kappaB signaling | 56/2622 | 249/18723 | 1.82e-04 | 2.69e-03 | 56 |
| GO:00431232 | Colorectum | FAP | positive regulation of I-kappaB kinase/NF-kappaB signaling | 42/2622 | 186/18723 | 1.01e-03 | 9.89e-03 | 42 |
| GO:00072492 | Colorectum | FAP | I-kappaB kinase/NF-kappaB signaling | 58/2622 | 281/18723 | 1.37e-03 | 1.24e-02 | 58 |
| GO:0009101 | Colorectum | FAP | glycoprotein biosynthetic process | 63/2622 | 317/18723 | 2.31e-03 | 1.86e-02 | 63 |
| GO:004312318 | Esophagus | ESCC | positive regulation of I-kappaB kinase/NF-kappaB signaling | 132/8552 | 186/18723 | 2.07e-12 | 8.58e-11 | 132 |
| GO:0043122110 | Esophagus | ESCC | regulation of I-kappaB kinase/NF-kappaB signaling | 167/8552 | 249/18723 | 6.11e-12 | 2.32e-10 | 167 |
| GO:000724919 | Esophagus | ESCC | I-kappaB kinase/NF-kappaB signaling | 183/8552 | 281/18723 | 3.02e-11 | 1.01e-09 | 183 |
| GO:00091002 | Esophagus | ESCC | glycoprotein metabolic process | 226/8552 | 387/18723 | 2.64e-07 | 3.94e-06 | 226 |
| GO:00091012 | Esophagus | ESCC | glycoprotein biosynthetic process | 181/8552 | 317/18723 | 2.54e-05 | 2.15e-04 | 181 |
| GO:0006029 | Esophagus | ESCC | proteoglycan metabolic process | 48/8552 | 79/18723 | 4.93e-03 | 1.89e-02 | 48 |
| GO:0030166 | Esophagus | ESCC | proteoglycan biosynthetic process | 35/8552 | 56/18723 | 8.30e-03 | 2.94e-02 | 35 |
| GO:000724912 | Liver | HCC | I-kappaB kinase/NF-kappaB signaling | 156/7958 | 281/18723 | 6.66e-06 | 8.00e-05 | 156 |
| GO:004312312 | Liver | HCC | positive regulation of I-kappaB kinase/NF-kappaB signaling | 108/7958 | 186/18723 | 1.28e-05 | 1.43e-04 | 108 |
| GO:004312212 | Liver | HCC | regulation of I-kappaB kinase/NF-kappaB signaling | 138/7958 | 249/18723 | 2.47e-05 | 2.58e-04 | 138 |
| Page: 1 2 3 |
| Pathway ID | Tissue | Disease Stage | Description | Gene Ratio | Bg Ratio | pvalue | p.adjust | qvalue | Count |
| hsa012325 | Esophagus | ESCC | Nucleotide metabolism | 59/4205 | 85/8465 | 1.67e-04 | 6.58e-04 | 3.37e-04 | 59 |
| hsa002405 | Esophagus | ESCC | Pyrimidine metabolism | 41/4205 | 58/8465 | 9.14e-04 | 2.92e-03 | 1.49e-03 | 41 |
| hsa0123212 | Esophagus | ESCC | Nucleotide metabolism | 59/4205 | 85/8465 | 1.67e-04 | 6.58e-04 | 3.37e-04 | 59 |
| hsa0024012 | Esophagus | ESCC | Pyrimidine metabolism | 41/4205 | 58/8465 | 9.14e-04 | 2.92e-03 | 1.49e-03 | 41 |
| hsa002402 | Liver | HCC | Pyrimidine metabolism | 44/4020 | 58/8465 | 9.34e-06 | 7.11e-05 | 3.95e-05 | 44 |
| hsa012322 | Liver | HCC | Nucleotide metabolism | 59/4020 | 85/8465 | 3.30e-05 | 1.88e-04 | 1.04e-04 | 59 |
| hsa002403 | Liver | HCC | Pyrimidine metabolism | 44/4020 | 58/8465 | 9.34e-06 | 7.11e-05 | 3.95e-05 | 44 |
| hsa012323 | Liver | HCC | Nucleotide metabolism | 59/4020 | 85/8465 | 3.30e-05 | 1.88e-04 | 1.04e-04 | 59 |
| hsa012324 | Oral cavity | OSCC | Nucleotide metabolism | 54/3704 | 85/8465 | 1.78e-04 | 5.95e-04 | 3.03e-04 | 54 |
| hsa002404 | Oral cavity | OSCC | Pyrimidine metabolism | 37/3704 | 58/8465 | 1.62e-03 | 4.45e-03 | 2.26e-03 | 37 |
| hsa0123211 | Oral cavity | OSCC | Nucleotide metabolism | 54/3704 | 85/8465 | 1.78e-04 | 5.95e-04 | 3.03e-04 | 54 |
| hsa0024011 | Oral cavity | OSCC | Pyrimidine metabolism | 37/3704 | 58/8465 | 1.62e-03 | 4.45e-03 | 2.26e-03 | 37 |
| hsa0123221 | Oral cavity | LP | Nucleotide metabolism | 42/2418 | 85/8465 | 3.62e-05 | 2.36e-04 | 1.52e-04 | 42 |
| hsa0024021 | Oral cavity | LP | Pyrimidine metabolism | 28/2418 | 58/8465 | 1.12e-03 | 5.02e-03 | 3.24e-03 | 28 |
| hsa0123231 | Oral cavity | LP | Nucleotide metabolism | 42/2418 | 85/8465 | 3.62e-05 | 2.36e-04 | 1.52e-04 | 42 |
| hsa0024031 | Oral cavity | LP | Pyrimidine metabolism | 28/2418 | 58/8465 | 1.12e-03 | 5.02e-03 | 3.24e-03 | 28 |
| Page: 1 |
Top |
Cell-cell communication analysis |
| Identification of potential cell-cell interactions between two cell types and their ligand-receptor pairs for different disease states |
| Ligand | Receptor | LRpair | Pathway | Tissue | Disease Stage |
| Page: 1 |
Top |
Single-cell gene regulatory network inference analysis |
| Find out the significant the regulons (TFs) and the target genes of each regulon across cell types for different disease states |
| TF | Cell Type | Tissue | Disease Stage | Target Gene | RSS | Regulon Activity |
| ∗The dot plots of a searched regulon are shown for all cell subpopulations in each disease state of each tissue based on the regulon specific score inferred using pySCENIC and by calculating the average expression. |
| Page: 1 |
Top |
Somatic mutation of malignant transformation related genes |
| Annotation of somatic variants for genes involved in malignant transformation |
| Hugo Symbol | Variant Class | Variant Classification | dbSNP RS | HGVSc | HGVSp | HGVSp Short | SWISSPROT | BIOTYPE | SIFT | PolyPhen | Tumor Sample Barcode | Tissue | Histology | Sex | Age | Stage | Therapy Types | Drugs | Outcome |
| CANT1 | SNV | Missense_Mutation | c.812N>T | p.Ala271Val | p.A271V | Q8WVQ1 | protein_coding | tolerated(0.13) | benign(0.079) | TCGA-A1-A0SI-01 | Breast | breast invasive carcinoma | Female | <65 | I/II | Unknown | Unknown | SD | |
| CANT1 | SNV | Missense_Mutation | novel | c.1073N>G | p.Ile358Ser | p.I358S | Q8WVQ1 | protein_coding | deleterious(0) | probably_damaging(0.997) | TCGA-A8-A07L-01 | Breast | breast invasive carcinoma | Female | <65 | III/IV | Chemotherapy | CR | |
| CANT1 | SNV | Missense_Mutation | rs527465328 | c.1006G>A | p.Gly336Arg | p.G336R | Q8WVQ1 | protein_coding | deleterious(0.01) | probably_damaging(0.999) | TCGA-AC-A2BK-01 | Breast | breast invasive carcinoma | Female | >=65 | III/IV | Chemotherapy | cytoxan | CR |
| CANT1 | SNV | Missense_Mutation | c.941N>A | p.Arg314His | p.R314H | Q8WVQ1 | protein_coding | tolerated(0.78) | benign(0.003) | TCGA-AO-A128-01 | Breast | breast invasive carcinoma | Female | <65 | I/II | Chemotherapy | doxorubicin | SD | |
| CANT1 | SNV | Missense_Mutation | novel | c.888N>A | p.Phe296Leu | p.F296L | Q8WVQ1 | protein_coding | deleterious(0.02) | possibly_damaging(0.836) | TCGA-JL-A3YX-01 | Breast | breast invasive carcinoma | Female | <65 | I/II | Unknown | Unknown | SD |
| CANT1 | insertion | Frame_Shift_Ins | novel | c.1070_1071insATGTCAGGCCCTATGCCTCACCCTGAGAACG | p.Ile358CysfsTer103 | p.I358Cfs*103 | Q8WVQ1 | protein_coding | TCGA-A8-A07L-01 | Breast | breast invasive carcinoma | Female | <65 | III/IV | Chemotherapy | CR | |||
| CANT1 | insertion | Frame_Shift_Ins | novel | c.960_961insT | p.Leu321SerfsTer6 | p.L321Sfs*6 | Q8WVQ1 | protein_coding | TCGA-BH-A0AY-01 | Breast | breast invasive carcinoma | Female | <65 | I/II | Chemotherapy | SD | |||
| CANT1 | insertion | Frame_Shift_Ins | novel | c.958_959insAGGTCACCCCCTTTTCTTCCTACTCTGTGCCTGGAGCATCA | p.Leu320GlnfsTer16 | p.L320Qfs*16 | Q8WVQ1 | protein_coding | TCGA-BH-A0AY-01 | Breast | breast invasive carcinoma | Female | <65 | I/II | Chemotherapy | SD | |||
| CANT1 | deletion | Frame_Shift_Del | novel | c.955delC | p.Leu319CysfsTer3 | p.L319Cfs*3 | Q8WVQ1 | protein_coding | TCGA-EW-A2FV-01 | Breast | breast invasive carcinoma | Female | <65 | III/IV | Chemotherapy | docetaxel | SD | ||
| CANT1 | SNV | Missense_Mutation | rs776518004 | c.808N>T | p.Arg270Trp | p.R270W | Q8WVQ1 | protein_coding | deleterious(0) | probably_damaging(0.999) | TCGA-2W-A8YY-01 | Cervix | cervical & endocervical cancer | Female | <65 | I/II | Chemotherapy | cisplatin | CR |
| Page: 1 2 3 4 |
Top |
Related drugs of malignant transformation related genes |
| Identification of chemicals and drugs interact with genes involved in malignant transfromation |
| (DGIdb 4.0) |
| Entrez ID | Symbol | Category | Interaction Types | Drug Claim Name | Drug Name | PMIDs |
| Page: 1 |

Copyright 2023-Present -The University of Texas Health Science Center at Houston |