
|
|||||
|
 | |
| |
| |
| |
| |
| |
|
Gene: ATF4 |
Gene summary for ATF4 |
| Gene information | Species | Human | Gene symbol | ATF4 | Gene ID | 468 |
| Gene name | activating transcription factor 4 | |
| Gene Alias | CREB-2 | |
| Cytomap | 22q13.1 | |
| Gene Type | protein-coding | GO ID | GO:0000122 | UniProtAcc | P18848 |
Top |
Malignant transformation analysis |
| Identification of the aberrant gene expression in precancerous and cancerous lesions by comparing the gene expression of stem-like cells in diseased tissues with normal stem cells |
| Entrez ID | Symbol | Replicates | Species | Organ | Tissue | Adj P-value | Log2FC | Malignancy |
| 468 | ATF4 | GSM4909277 | Human | Breast | Precancer | 4.75e-02 | 8.18e-02 | 0.0177 |
| 468 | ATF4 | GSM4909280 | Human | Breast | Precancer | 6.69e-05 | 3.40e-01 | 0.0305 |
| 468 | ATF4 | GSM4909286 | Human | Breast | IDC | 2.22e-04 | -1.43e-01 | 0.1081 |
| 468 | ATF4 | GSM4909287 | Human | Breast | IDC | 4.27e-12 | -4.06e-01 | 0.2057 |
| 468 | ATF4 | GSM4909288 | Human | Breast | IDC | 3.21e-05 | -3.96e-01 | 0.0988 |
| 468 | ATF4 | GSM4909290 | Human | Breast | IDC | 2.19e-03 | -2.60e-01 | 0.2096 |
| 468 | ATF4 | GSM4909292 | Human | Breast | IDC | 4.62e-02 | 2.65e-01 | 0.1236 |
| 468 | ATF4 | GSM4909293 | Human | Breast | IDC | 3.10e-19 | -4.46e-01 | 0.1581 |
| 468 | ATF4 | GSM4909294 | Human | Breast | IDC | 1.26e-17 | -5.33e-01 | 0.2022 |
| 468 | ATF4 | GSM4909296 | Human | Breast | IDC | 6.18e-14 | -3.87e-01 | 0.1524 |
| 468 | ATF4 | GSM4909297 | Human | Breast | IDC | 1.72e-22 | -3.00e-01 | 0.1517 |
| 468 | ATF4 | GSM4909298 | Human | Breast | IDC | 1.68e-10 | -3.08e-01 | 0.1551 |
| 468 | ATF4 | GSM4909301 | Human | Breast | IDC | 1.36e-24 | -6.88e-01 | 0.1577 |
| 468 | ATF4 | GSM4909302 | Human | Breast | IDC | 7.67e-27 | -6.33e-01 | 0.1545 |
| 468 | ATF4 | GSM4909304 | Human | Breast | IDC | 1.61e-03 | -3.33e-01 | 0.1636 |
| 468 | ATF4 | GSM4909305 | Human | Breast | IDC | 2.10e-03 | -2.43e-01 | 0.0436 |
| 468 | ATF4 | GSM4909306 | Human | Breast | IDC | 1.95e-12 | -4.24e-01 | 0.1564 |
| 468 | ATF4 | GSM4909307 | Human | Breast | IDC | 7.96e-17 | -5.59e-01 | 0.1569 |
| 468 | ATF4 | GSM4909308 | Human | Breast | IDC | 7.96e-26 | -6.05e-01 | 0.158 |
| 468 | ATF4 | GSM4909309 | Human | Breast | IDC | 4.51e-07 | -2.47e-01 | 0.0483 |
| Page: 1 2 3 4 5 6 7 8 9 10 11 12 13 |
| Tissue | Expression Dynamics | Abbreviation |
| Breast | 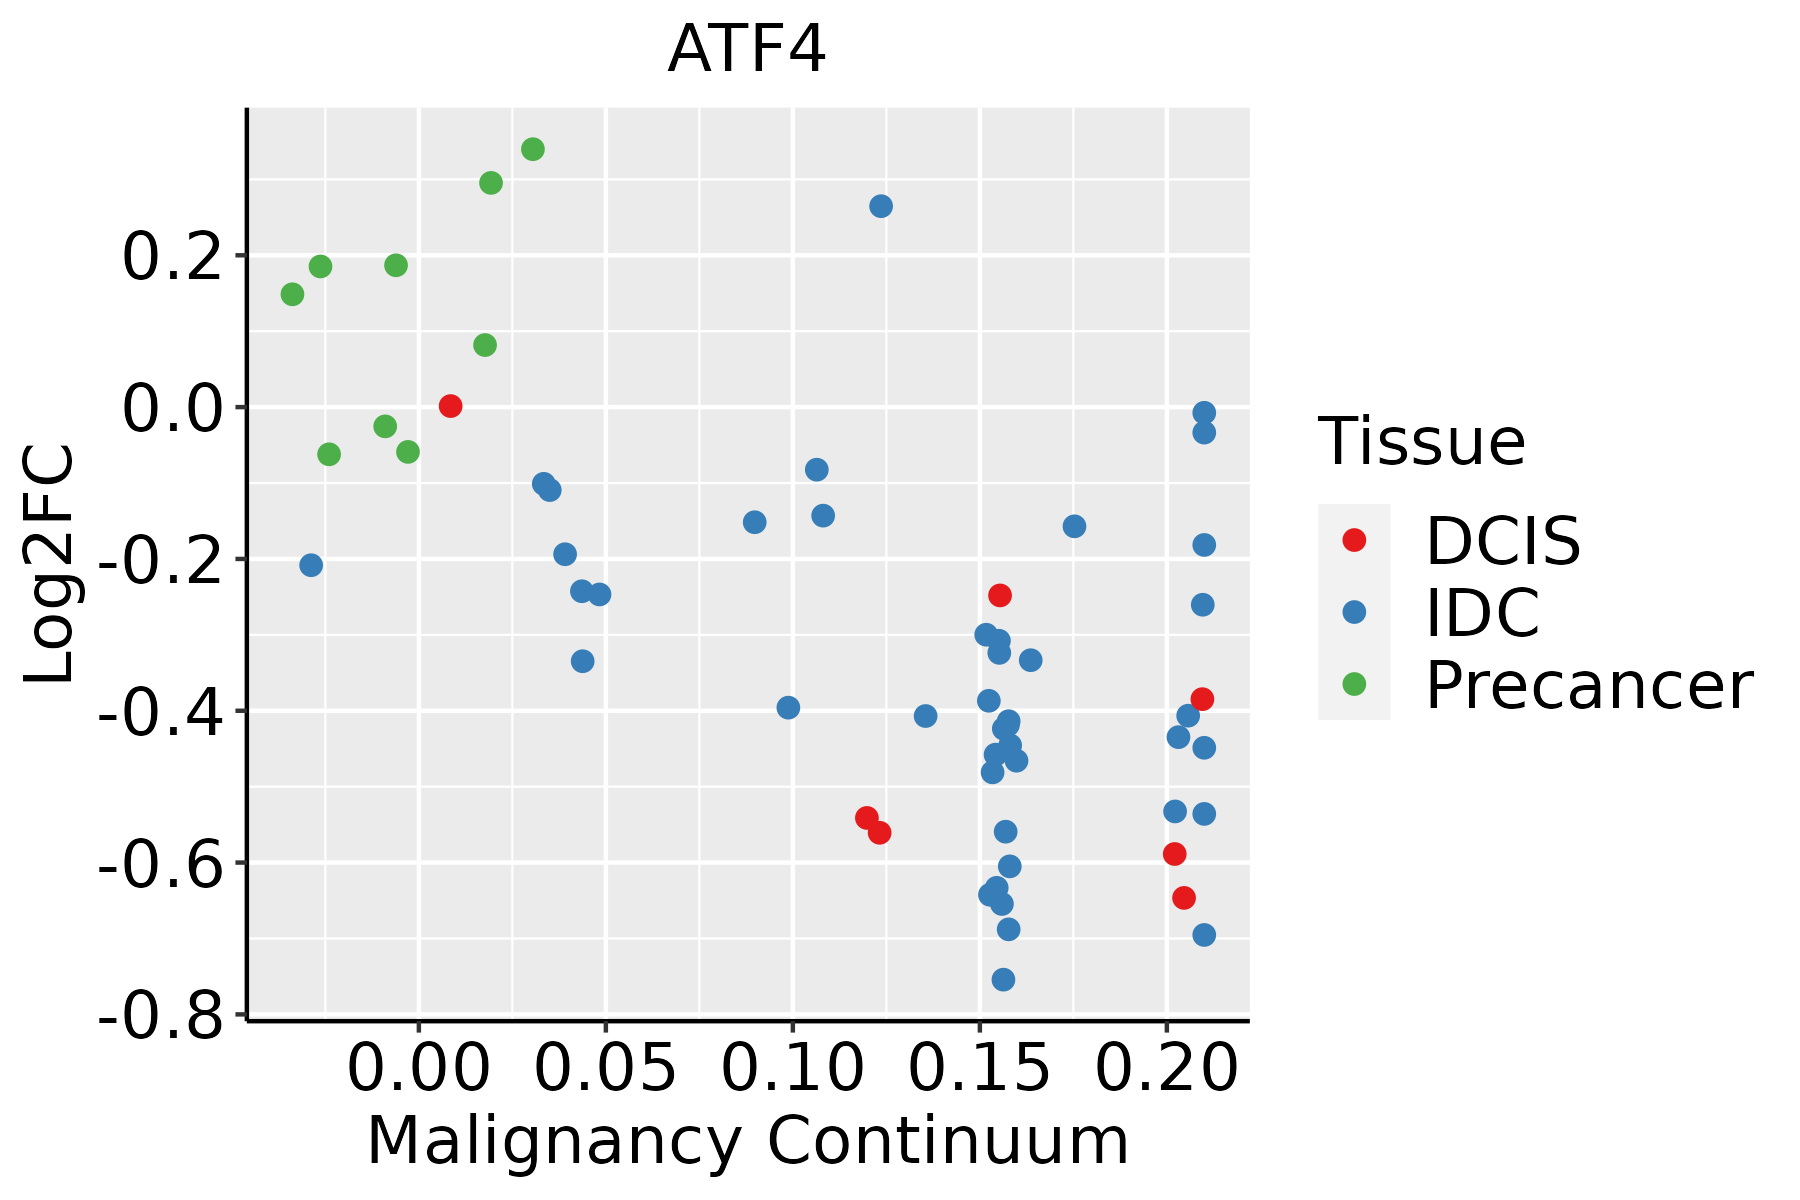 | IDC: Invasive ductal carcinoma |
| DCIS: Ductal carcinoma in situ | ||
| Precancer(BRCA1-mut): Precancerous lesion from BRCA1 mutation carriers | ||
| Colorectum (GSE201348) |  | FAP: Familial adenomatous polyposis |
| CRC: Colorectal cancer | ||
| Colorectum (HTA11) |  | AD: Adenomas |
| SER: Sessile serrated lesions | ||
| MSI-H: Microsatellite-high colorectal cancer | ||
| MSS: Microsatellite stable colorectal cancer | ||
| Endometrium |  | AEH: Atypical endometrial hyperplasia |
| EEC: Endometrioid Cancer | ||
| Esophagus |  | ESCC: Esophageal squamous cell carcinoma |
| HGIN: High-grade intraepithelial neoplasias | ||
| LGIN: Low-grade intraepithelial neoplasias | ||
| Liver | 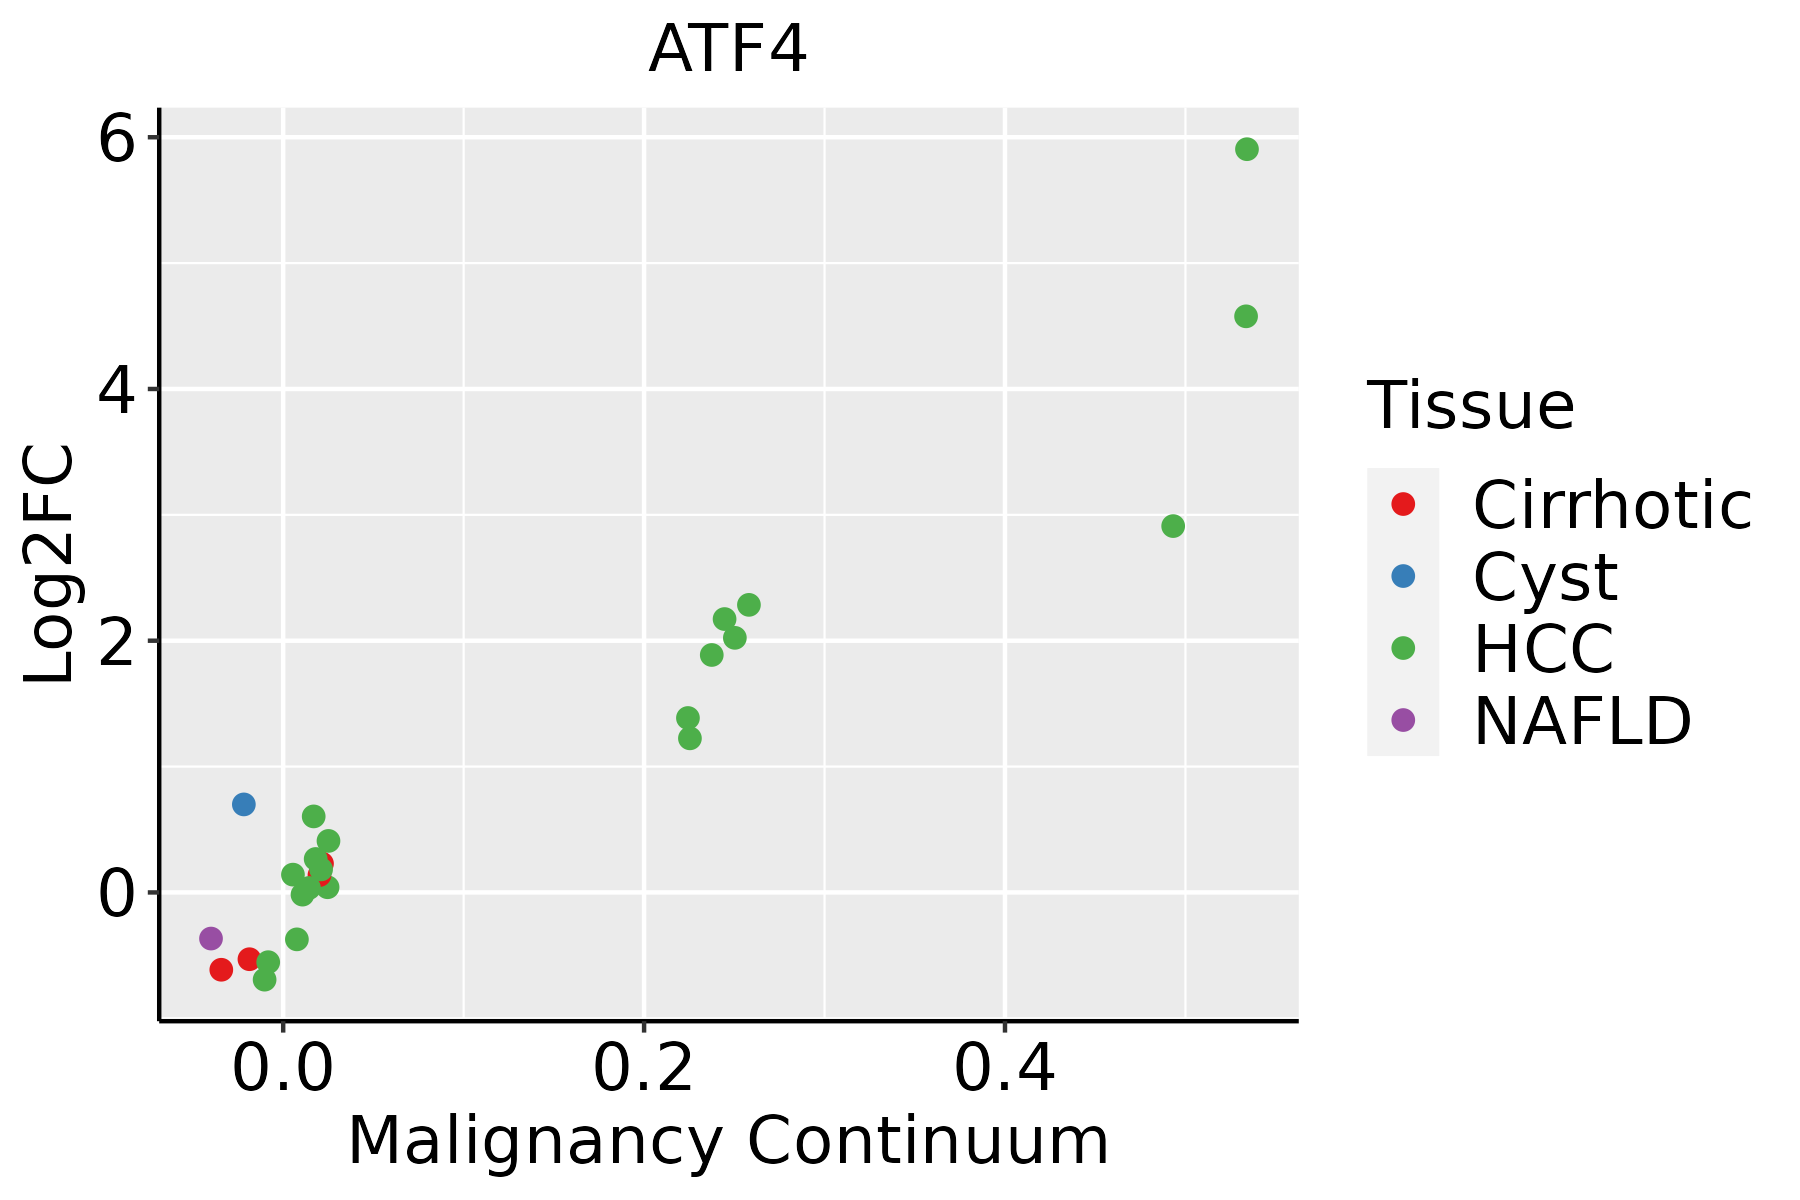 | HCC: Hepatocellular carcinoma |
| NAFLD: Non-alcoholic fatty liver disease | ||
| Oral Cavity | 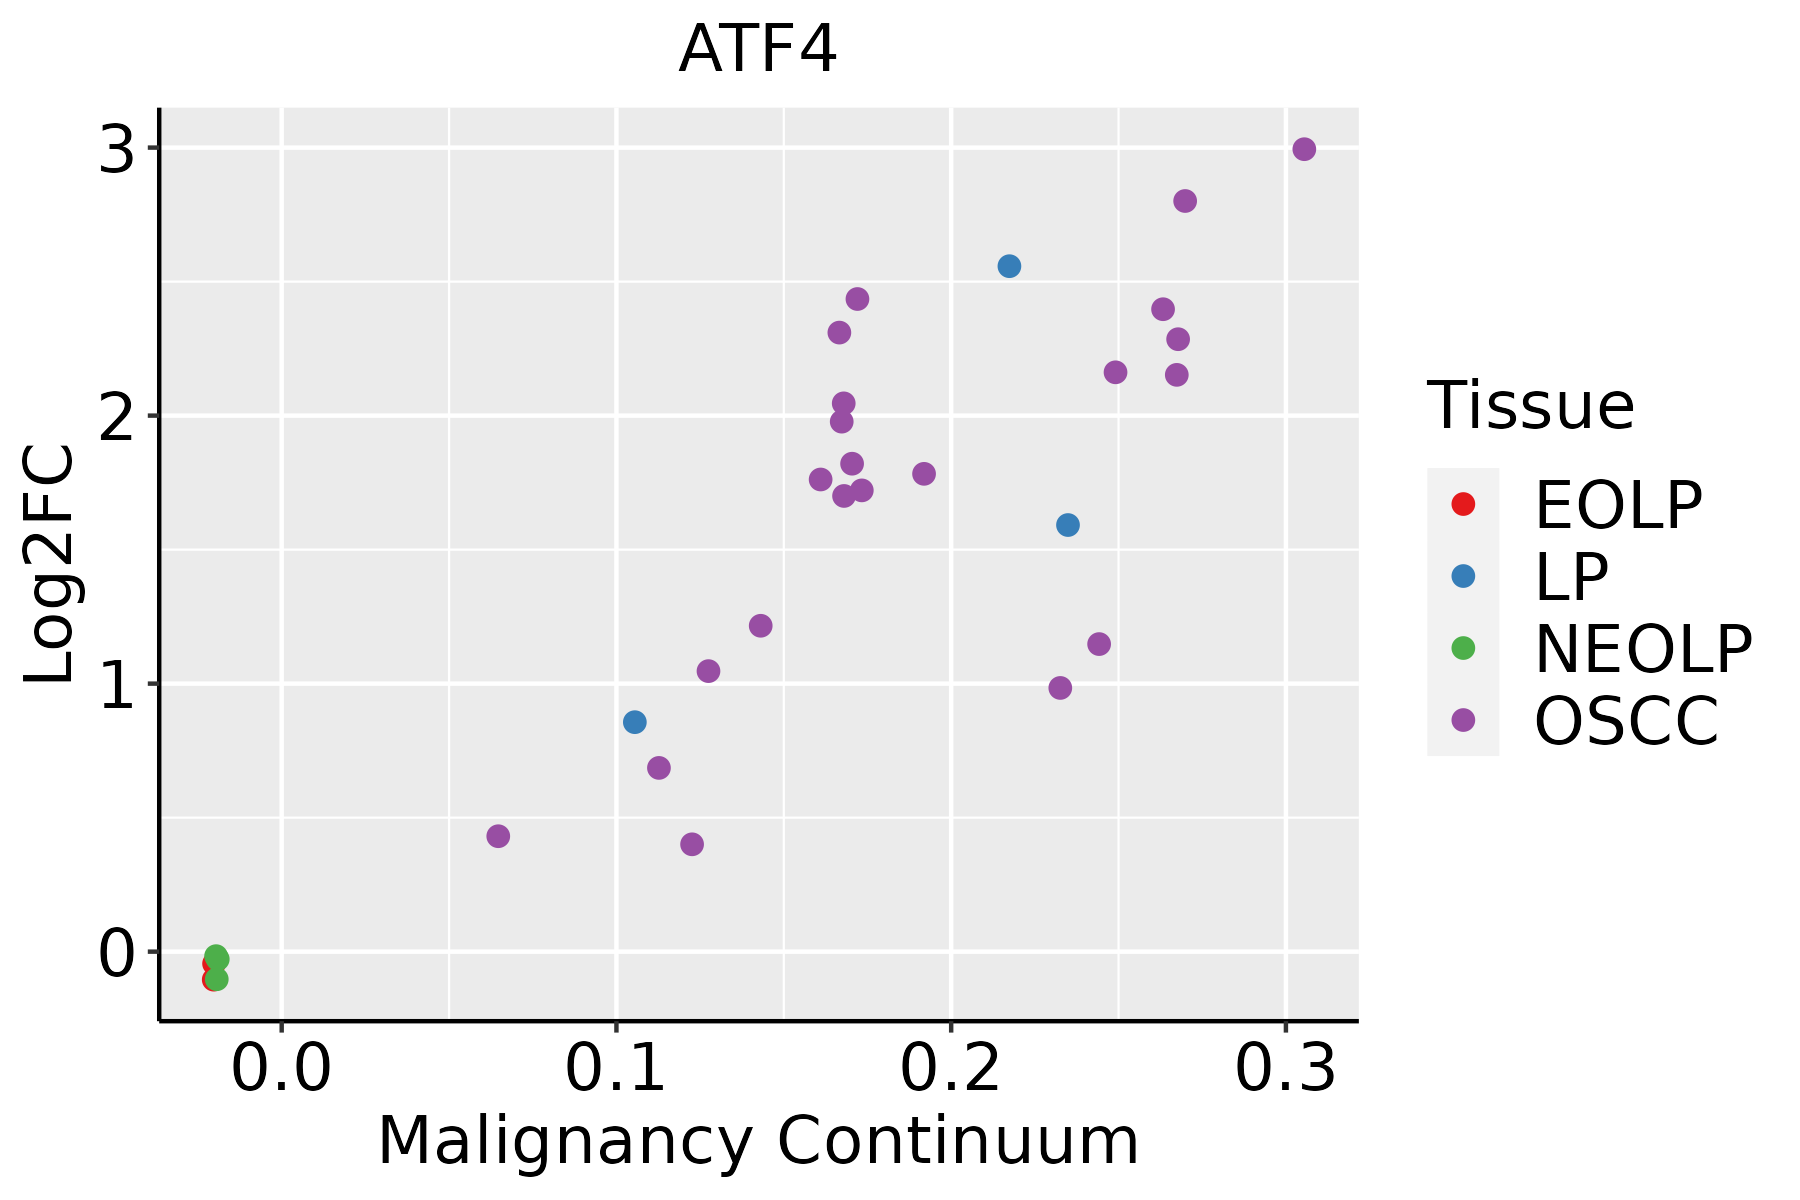 | EOLP: Erosive Oral lichen planus |
| LP: leukoplakia | ||
| NEOLP: Non-erosive oral lichen planus | ||
| OSCC: Oral squamous cell carcinoma | ||
| Prostate |  | BPH: Benign Prostatic Hyperplasia |
| Skin | 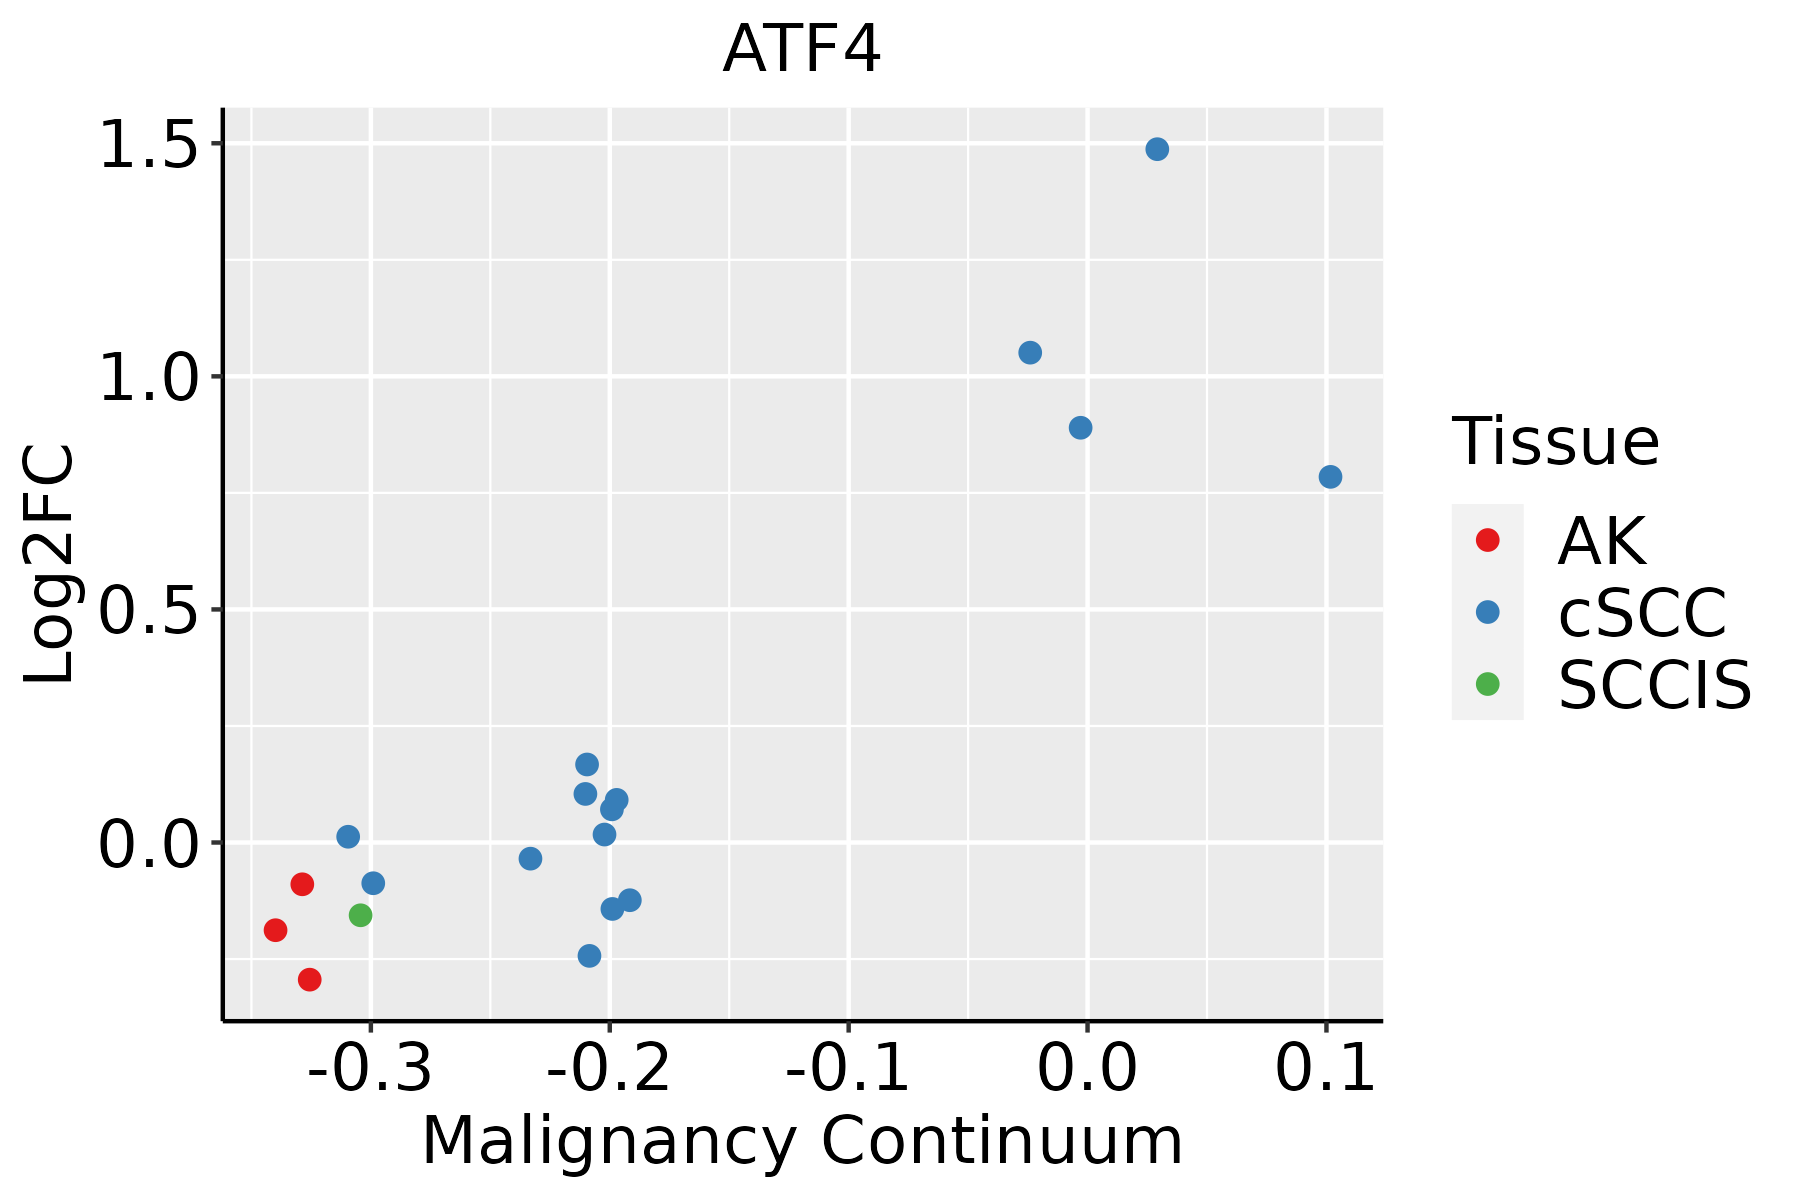 | AK: Actinic keratosis |
| cSCC: Cutaneous squamous cell carcinoma | ||
| SCCIS:squamous cell carcinoma in situ | ||
| Thyroid | 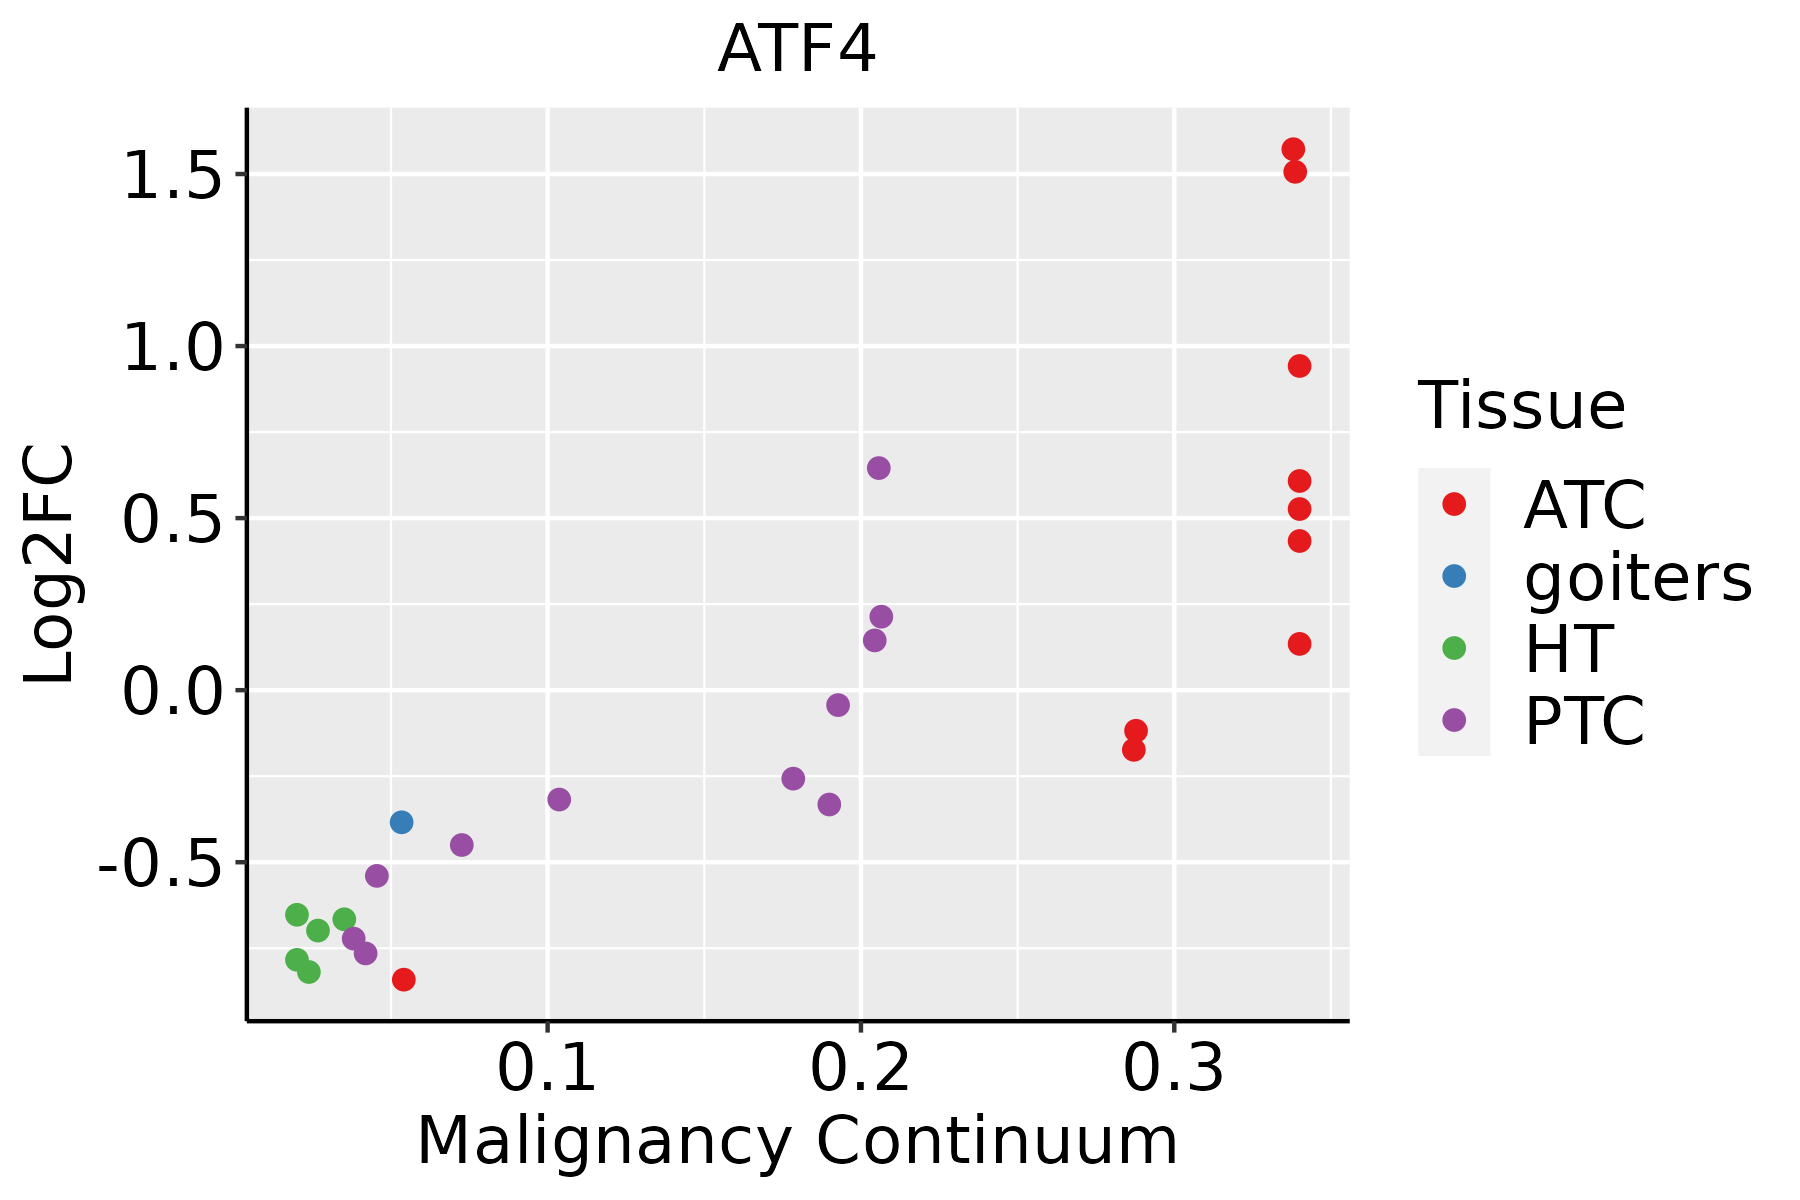 | ATC: Anaplastic thyroid cancer |
| HT: Hashimoto's thyroiditis | ||
| PTC: Papillary thyroid cancer |
| ∗log2FC in expression of this searched gene in stem-like cells from each diseased tissue sample relative to stem-like cells in normal samples in each tissue plotted against the malignancy continuum. Samples are colored based on if they are from different disease stage. |
Top |
Malignant transformation related pathway analysis |
| Find out the enriched GO biological processes and KEGG pathways involved in transition from healthy to precancer to cancer |
| Tissue | Disease Stage | Enriched GO biological Processes |
| Colorectum | CRC |  |
| Stomach | GC |  |
| Stomach | CAG with IM |  |
| Stomach | CSG |  |
| Stomach | CAG |  |
| ∗Top 15 enriched GO BP terms are showed in the bar plot of each disease state in each tissue. Each row represents a significant GO biological process which is colored according to the -log10(p.adjust). |
| Page: 1 2 3 4 5 6 7 8 9 |
| GO ID | Tissue | Disease Stage | Description | Gene Ratio | Bg Ratio | pvalue | p.adjust | Count |
| GO:00971939 | Breast | Precancer | intrinsic apoptotic signaling pathway | 59/1080 | 288/18723 | 8.07e-18 | 3.60e-15 | 59 |
| GO:00069799 | Breast | Precancer | response to oxidative stress | 70/1080 | 446/18723 | 1.59e-14 | 4.26e-12 | 70 |
| GO:00064138 | Breast | Precancer | translational initiation | 30/1080 | 118/18723 | 3.23e-12 | 5.58e-10 | 30 |
| GO:00064179 | Breast | Precancer | regulation of translation | 67/1080 | 468/18723 | 4.71e-12 | 7.64e-10 | 67 |
| GO:00621979 | Breast | Precancer | cellular response to chemical stress | 51/1080 | 337/18723 | 2.40e-10 | 2.34e-08 | 51 |
| GO:00069869 | Breast | Precancer | response to unfolded protein | 28/1080 | 137/18723 | 3.81e-09 | 3.00e-07 | 28 |
| GO:00709979 | Breast | Precancer | neuron death | 50/1080 | 361/18723 | 7.75e-09 | 5.70e-07 | 50 |
| GO:00514029 | Breast | Precancer | neuron apoptotic process | 38/1080 | 246/18723 | 2.68e-08 | 1.75e-06 | 38 |
| GO:00345999 | Breast | Precancer | cellular response to oxidative stress | 42/1080 | 288/18723 | 2.78e-08 | 1.79e-06 | 42 |
| GO:00359669 | Breast | Precancer | response to topologically incorrect protein | 29/1080 | 159/18723 | 3.00e-08 | 1.89e-06 | 29 |
| GO:00349769 | Breast | Precancer | response to endoplasmic reticulum stress | 38/1080 | 256/18723 | 7.89e-08 | 4.60e-06 | 38 |
| GO:00064466 | Breast | Precancer | regulation of translational initiation | 19/1080 | 79/18723 | 7.99e-08 | 4.60e-06 | 19 |
| GO:00346209 | Breast | Precancer | cellular response to unfolded protein | 21/1080 | 96/18723 | 9.80e-08 | 5.46e-06 | 21 |
| GO:00359679 | Breast | Precancer | cellular response to topologically incorrect protein | 22/1080 | 116/18723 | 6.84e-07 | 2.80e-05 | 22 |
| GO:19012149 | Breast | Precancer | regulation of neuron death | 41/1080 | 319/18723 | 1.27e-06 | 4.80e-05 | 41 |
| GO:00435237 | Breast | Precancer | regulation of neuron apoptotic process | 31/1080 | 212/18723 | 1.69e-06 | 6.08e-05 | 31 |
| GO:19032019 | Breast | Precancer | regulation of oxidative stress-induced cell death | 16/1080 | 74/18723 | 3.80e-06 | 1.20e-04 | 16 |
| GO:00018196 | Breast | Precancer | positive regulation of cytokine production | 52/1080 | 467/18723 | 4.18e-06 | 1.29e-04 | 52 |
| GO:00436209 | Breast | Precancer | regulation of DNA-templated transcription in response to stress | 13/1080 | 53/18723 | 7.06e-06 | 1.95e-04 | 13 |
| GO:00436189 | Breast | Precancer | regulation of transcription from RNA polymerase II promoter in response to stress | 12/1080 | 47/18723 | 1.02e-05 | 2.67e-04 | 12 |
| Page: 1 2 3 4 5 6 7 8 9 10 11 12 13 14 15 16 17 18 19 20 21 22 23 24 25 26 27 28 29 30 31 32 33 34 35 36 37 38 39 40 41 42 43 44 45 46 47 48 49 50 51 52 53 54 55 56 57 58 59 60 61 62 63 64 65 66 |
| Pathway ID | Tissue | Disease Stage | Description | Gene Ratio | Bg Ratio | pvalue | p.adjust | qvalue | Count |
| hsa0501224 | Breast | IDC | Parkinson disease | 107/867 | 266/8465 | 2.57e-39 | 8.36e-37 | 6.26e-37 | 107 |
| hsa0502023 | Breast | IDC | Prion disease | 102/867 | 273/8465 | 3.70e-34 | 4.01e-32 | 3.00e-32 | 102 |
| hsa0501023 | Breast | IDC | Alzheimer disease | 107/867 | 384/8465 | 1.70e-23 | 7.88e-22 | 5.90e-22 | 107 |
| hsa0501423 | Breast | IDC | Amyotrophic lateral sclerosis | 102/867 | 364/8465 | 1.29e-22 | 5.22e-21 | 3.91e-21 | 102 |
| hsa0502223 | Breast | IDC | Pathways of neurodegeneration - multiple diseases | 116/867 | 476/8465 | 3.63e-20 | 1.18e-18 | 8.82e-19 | 116 |
| hsa0493223 | Breast | IDC | Non-alcoholic fatty liver disease | 50/867 | 155/8465 | 3.48e-14 | 8.08e-13 | 6.05e-13 | 50 |
| hsa0491523 | Breast | IDC | Estrogen signaling pathway | 35/867 | 138/8465 | 2.55e-07 | 5.18e-06 | 3.88e-06 | 35 |
| hsa0421022 | Breast | IDC | Apoptosis | 31/867 | 136/8465 | 1.34e-05 | 1.61e-04 | 1.20e-04 | 31 |
| hsa0414124 | Breast | IDC | Protein processing in endoplasmic reticulum | 36/867 | 174/8465 | 2.73e-05 | 2.86e-04 | 2.14e-04 | 36 |
| hsa050312 | Breast | IDC | Amphetamine addiction | 18/867 | 69/8465 | 1.42e-04 | 1.36e-03 | 1.01e-03 | 18 |
| hsa0516624 | Breast | IDC | Human T-cell leukemia virus 1 infection | 40/867 | 222/8465 | 2.52e-04 | 2.21e-03 | 1.66e-03 | 40 |
| hsa0516324 | Breast | IDC | Human cytomegalovirus infection | 39/867 | 225/8465 | 6.66e-04 | 5.41e-03 | 4.05e-03 | 39 |
| hsa0413723 | Breast | IDC | Mitophagy - animal | 17/867 | 72/8465 | 7.61e-04 | 6.04e-03 | 4.52e-03 | 17 |
| hsa0520322 | Breast | IDC | Viral carcinogenesis | 34/867 | 204/8465 | 2.82e-03 | 1.86e-02 | 1.39e-02 | 34 |
| hsa0541724 | Breast | IDC | Lipid and atherosclerosis | 35/867 | 215/8465 | 3.67e-03 | 2.29e-02 | 1.71e-02 | 35 |
| hsa0501234 | Breast | IDC | Parkinson disease | 107/867 | 266/8465 | 2.57e-39 | 8.36e-37 | 6.26e-37 | 107 |
| hsa0502033 | Breast | IDC | Prion disease | 102/867 | 273/8465 | 3.70e-34 | 4.01e-32 | 3.00e-32 | 102 |
| hsa0501033 | Breast | IDC | Alzheimer disease | 107/867 | 384/8465 | 1.70e-23 | 7.88e-22 | 5.90e-22 | 107 |
| hsa0501433 | Breast | IDC | Amyotrophic lateral sclerosis | 102/867 | 364/8465 | 1.29e-22 | 5.22e-21 | 3.91e-21 | 102 |
| hsa0502233 | Breast | IDC | Pathways of neurodegeneration - multiple diseases | 116/867 | 476/8465 | 3.63e-20 | 1.18e-18 | 8.82e-19 | 116 |
| Page: 1 2 3 4 5 6 7 8 9 10 11 12 13 14 15 16 17 18 19 20 21 |
Top |
Cell-cell communication analysis |
| Identification of potential cell-cell interactions between two cell types and their ligand-receptor pairs for different disease states |
| Ligand | Receptor | LRpair | Pathway | Tissue | Disease Stage |
| Page: 1 |
Top |
Single-cell gene regulatory network inference analysis |
| Find out the significant the regulons (TFs) and the target genes of each regulon across cell types for different disease states |
| TF | Cell Type | Tissue | Disease Stage | Target Gene | RSS | Regulon Activity |
| ATF4 | PLA | Colorectum | AD | RNF157,HERPUD1,EIF1, etc. | 5.18e-01 |  |
| ATF4 | PLA | Colorectum | ADJ | RNF157,HERPUD1,EIF1, etc. | 2.95e-01 |  |
| ATF4 | PLA | Colorectum | CRC | RNF157,HERPUD1,EIF1, etc. | 2.78e-01 |  |
| ATF4 | PLA | Colorectum | FAP | RNF157,HERPUD1,EIF1, etc. | 2.93e-01 |  |
| ATF4 | PLA | Colorectum | Healthy | RNF157,HERPUD1,EIF1, etc. | 3.81e-01 |  |
| ATF4 | PLA | Colorectum | MSI-H | RNF157,HERPUD1,EIF1, etc. | 3.02e-01 |  |
| ATF4 | PLA | Colorectum | MSS | RNF157,HERPUD1,EIF1, etc. | 2.09e-01 |  |
| ATF4 | PLA | Colorectum | SER | RNF157,HERPUD1,EIF1, etc. | 5.22e-01 |  |
| ATF4 | CD8TEFF | Endometrium | EEC | HPRT1,EIF1,ENPP4, etc. | 1.50e-01 |  |
| ATF4 | PLA | Liver | Healthy | CD9,EIF1,CD36, etc. | 5.61e-01 |  |
| ∗The dot plots of a searched regulon are shown for all cell subpopulations in each disease state of each tissue based on the regulon specific score inferred using pySCENIC and by calculating the average expression. |
| Page: 1 2 |
Top |
Somatic mutation of malignant transformation related genes |
| Annotation of somatic variants for genes involved in malignant transformation |
| Hugo Symbol | Variant Class | Variant Classification | dbSNP RS | HGVSc | HGVSp | HGVSp Short | SWISSPROT | BIOTYPE | SIFT | PolyPhen | Tumor Sample Barcode | Tissue | Histology | Sex | Age | Stage | Therapy Types | Drugs | Outcome |
| ATF4 | SNV | Missense_Mutation | c.60C>G | p.Phe20Leu | p.F20L | P18848 | protein_coding | tolerated(0.15) | benign(0.294) | TCGA-A2-A04P-01 | Breast | breast invasive carcinoma | Female | <65 | III/IV | Chemotherapy | taxol | PD | |
| ATF4 | SNV | Missense_Mutation | novel | c.697N>G | p.Gln233Glu | p.Q233E | P18848 | protein_coding | tolerated(0.14) | possibly_damaging(0.528) | TCGA-AC-A3W6-01 | Breast | breast invasive carcinoma | Female | >=65 | III/IV | Unknown | Unknown | SD |
| ATF4 | SNV | Missense_Mutation | c.790N>G | p.Pro264Ala | p.P264A | P18848 | protein_coding | deleterious(0.04) | benign(0.251) | TCGA-D8-A27G-01 | Breast | breast invasive carcinoma | Female | >=65 | I/II | Unknown | Unknown | SD | |
| ATF4 | insertion | Frame_Shift_Ins | novel | c.846_847insA | p.Met285AsnfsTer10 | p.M285Nfs*10 | P18848 | protein_coding | TCGA-OL-A5D7-01 | Breast | breast invasive carcinoma | Female | >=65 | I/II | Chemotherapy | cytoxan | CR | ||
| ATF4 | SNV | Missense_Mutation | rs547982920 | c.685N>G | p.Leu229Val | p.L229V | P18848 | protein_coding | tolerated(0.34) | benign(0.003) | TCGA-C5-A1MK-01 | Cervix | cervical & endocervical cancer | Female | >=65 | III/IV | Chemotherapy | carboplatin | PD |
| ATF4 | SNV | Missense_Mutation | novel | c.922N>T | p.Gly308Cys | p.G308C | P18848 | protein_coding | deleterious(0) | probably_damaging(0.996) | TCGA-DS-A1OB-01 | Cervix | cervical & endocervical cancer | Female | <65 | I/II | Chemotherapy | carboplatin | PD |
| ATF4 | SNV | Missense_Mutation | c.430N>G | p.Leu144Val | p.L144V | P18848 | protein_coding | tolerated(0.19) | benign(0.275) | TCGA-EK-A2R8-01 | Cervix | cervical & endocervical cancer | Female | <65 | I/II | Unknown | Unknown | SD | |
| ATF4 | SNV | Missense_Mutation | c.305N>C | p.Ile102Thr | p.I102T | P18848 | protein_coding | tolerated(0.47) | benign(0) | TCGA-AA-3663-01 | Colorectum | colon adenocarcinoma | Male | <65 | I/II | Unknown | Unknown | SD | |
| ATF4 | SNV | Missense_Mutation | c.335N>G | p.Leu112Arg | p.L112R | P18848 | protein_coding | deleterious(0) | probably_damaging(0.929) | TCGA-AA-3811-01 | Colorectum | colon adenocarcinoma | Female | >=65 | III/IV | Unknown | Unknown | PD | |
| ATF4 | SNV | Missense_Mutation | novel | c.617N>G | p.Gln206Arg | p.Q206R | P18848 | protein_coding | tolerated(0.24) | benign(0.015) | TCGA-CA-6717-01 | Colorectum | colon adenocarcinoma | Male | <65 | I/II | Chemotherapy | oxaliplatin | CR |
| Page: 1 2 3 4 5 |
Top |
Related drugs of malignant transformation related genes |
| Identification of chemicals and drugs interact with genes involved in malignant transfromation |
| (DGIdb 4.0) |
| Entrez ID | Symbol | Category | Interaction Types | Drug Claim Name | Drug Name | PMIDs |
| 468 | ATF4 | TRANSPORTER, TRANSCRIPTION FACTOR | VITAMIN E | 11043924 |
| Page: 1 |

Copyright 2023-Present -The University of Texas Health Science Center at Houston |