
|
|||||
|
 | |
| |
| |
| |
| |
| |
|
Gene: ALDH1B1 |
Gene summary for ALDH1B1 |
| Gene information | Species | Human | Gene symbol | ALDH1B1 | Gene ID | 219 |
| Gene name | aldehyde dehydrogenase 1 family member B1 | |
| Gene Alias | ALDH5 | |
| Cytomap | 9p13.1 | |
| Gene Type | protein-coding | GO ID | GO:0005975 | UniProtAcc | P30837 |
Top |
Malignant transformation analysis |
| Identification of the aberrant gene expression in precancerous and cancerous lesions by comparing the gene expression of stem-like cells in diseased tissues with normal stem cells |
| Entrez ID | Symbol | Replicates | Species | Organ | Tissue | Adj P-value | Log2FC | Malignancy |
| 219 | ALDH1B1 | HTA11_3410_2000001011 | Human | Colorectum | AD | 2.63e-09 | 2.82e-01 | 0.0155 |
| 219 | ALDH1B1 | HTA11_2951_2000001011 | Human | Colorectum | AD | 3.56e-09 | 6.76e-01 | 0.0216 |
| 219 | ALDH1B1 | HTA11_1938_2000001011 | Human | Colorectum | AD | 1.55e-05 | 4.02e-01 | -0.0811 |
| 219 | ALDH1B1 | HTA11_347_2000001011 | Human | Colorectum | AD | 7.76e-03 | 1.63e-01 | -0.1954 |
| 219 | ALDH1B1 | HTA11_696_2000001011 | Human | Colorectum | AD | 2.77e-04 | 2.35e-01 | -0.1464 |
| 219 | ALDH1B1 | HTA11_1391_2000001011 | Human | Colorectum | AD | 3.63e-17 | 6.10e-01 | -0.059 |
| 219 | ALDH1B1 | HTA11_866_3004761011 | Human | Colorectum | AD | 8.94e-19 | 4.94e-01 | 0.096 |
| 219 | ALDH1B1 | HTA11_9408_2000001011 | Human | Colorectum | AD | 1.29e-03 | 5.93e-01 | 0.0451 |
| 219 | ALDH1B1 | HTA11_8622_2000001021 | Human | Colorectum | SER | 8.06e-04 | 3.07e-01 | 0.0528 |
| 219 | ALDH1B1 | HTA11_7663_2000001011 | Human | Colorectum | SER | 1.19e-16 | 9.00e-01 | 0.0131 |
| 219 | ALDH1B1 | HTA11_6801_2000001011 | Human | Colorectum | SER | 5.33e-03 | 5.78e-01 | 0.0171 |
| 219 | ALDH1B1 | HTA11_10711_2000001011 | Human | Colorectum | AD | 6.90e-10 | 3.85e-01 | 0.0338 |
| 219 | ALDH1B1 | HTA11_7696_3000711011 | Human | Colorectum | AD | 8.22e-17 | 4.46e-01 | 0.0674 |
| 219 | ALDH1B1 | HTA11_6818_2000001021 | Human | Colorectum | AD | 3.29e-07 | 3.24e-01 | 0.0588 |
| 219 | ALDH1B1 | HTA11_99999970781_79442 | Human | Colorectum | MSS | 3.76e-26 | 6.95e-01 | 0.294 |
| 219 | ALDH1B1 | HTA11_99999965104_69814 | Human | Colorectum | MSS | 1.09e-27 | 9.22e-01 | 0.281 |
| 219 | ALDH1B1 | HTA11_99999971662_82457 | Human | Colorectum | MSS | 1.41e-05 | 2.77e-01 | 0.3859 |
| 219 | ALDH1B1 | HTA11_99999974143_84620 | Human | Colorectum | MSS | 4.20e-08 | 3.10e-01 | 0.3005 |
| 219 | ALDH1B1 | HCC1_Meng | Human | Liver | HCC | 1.28e-56 | -4.53e-02 | 0.0246 |
| 219 | ALDH1B1 | HCC2_Meng | Human | Liver | HCC | 1.72e-09 | -1.37e-01 | 0.0107 |
| Page: 1 2 |
| Tissue | Expression Dynamics | Abbreviation |
| Colorectum (GSE201348) |  | FAP: Familial adenomatous polyposis |
| CRC: Colorectal cancer | ||
| Colorectum (HTA11) |  | AD: Adenomas |
| SER: Sessile serrated lesions | ||
| MSI-H: Microsatellite-high colorectal cancer | ||
| MSS: Microsatellite stable colorectal cancer | ||
| Liver | 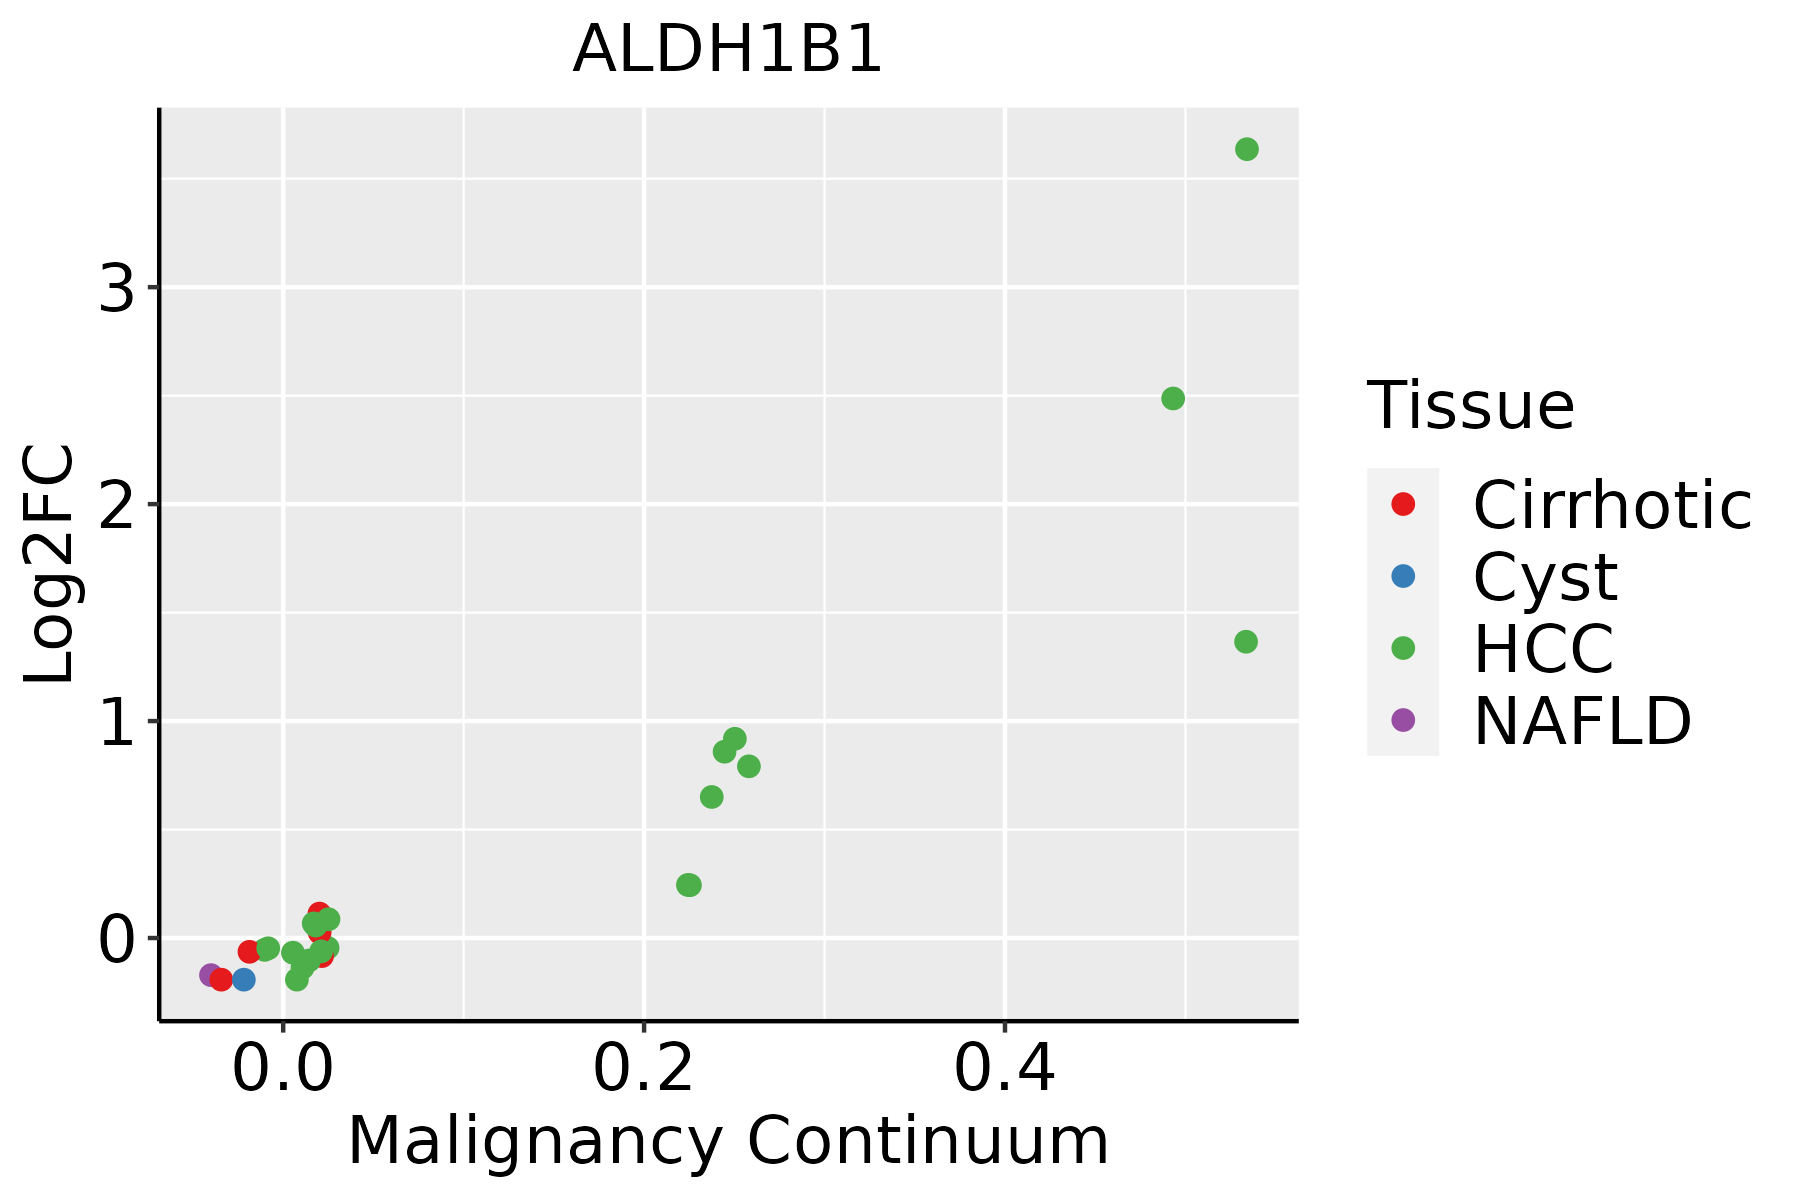 | HCC: Hepatocellular carcinoma |
| NAFLD: Non-alcoholic fatty liver disease |
| ∗log2FC in expression of this searched gene in stem-like cells from each diseased tissue sample relative to stem-like cells in normal samples in each tissue plotted against the malignancy continuum. Samples are colored based on if they are from different disease stage. |
Top |
Malignant transformation related pathway analysis |
| Find out the enriched GO biological processes and KEGG pathways involved in transition from healthy to precancer to cancer |
| Tissue | Disease Stage | Enriched GO biological Processes |
| Colorectum | CRC |  |
| Stomach | GC |  |
| Stomach | CAG with IM |  |
| Stomach | CSG |  |
| Stomach | CAG |  |
| ∗Top 15 enriched GO BP terms are showed in the bar plot of each disease state in each tissue. Each row represents a significant GO biological process which is colored according to the -log10(p.adjust). |
| Page: 1 2 3 4 5 6 7 8 9 |
| GO ID | Tissue | Disease Stage | Description | Gene Ratio | Bg Ratio | pvalue | p.adjust | Count |
| GO:0044282 | Colorectum | AD | small molecule catabolic process | 118/3918 | 376/18723 | 1.05e-06 | 3.55e-05 | 118 |
| GO:0006066 | Colorectum | AD | alcohol metabolic process | 106/3918 | 353/18723 | 3.02e-05 | 5.57e-04 | 106 |
| GO:0034310 | Colorectum | AD | primary alcohol catabolic process | 9/3918 | 15/18723 | 1.11e-03 | 1.01e-02 | 9 |
| GO:0034308 | Colorectum | AD | primary alcohol metabolic process | 35/3918 | 102/18723 | 1.16e-03 | 1.05e-02 | 35 |
| GO:0006067 | Colorectum | AD | ethanol metabolic process | 11/3918 | 21/18723 | 1.43e-03 | 1.22e-02 | 11 |
| GO:0006068 | Colorectum | AD | ethanol catabolic process | 7/3918 | 12/18723 | 5.09e-03 | 3.38e-02 | 7 |
| GO:0046164 | Colorectum | AD | alcohol catabolic process | 20/3918 | 55/18723 | 6.03e-03 | 3.78e-02 | 20 |
| GO:00442821 | Colorectum | SER | small molecule catabolic process | 87/2897 | 376/18723 | 5.31e-05 | 1.27e-03 | 87 |
| GO:00060661 | Colorectum | SER | alcohol metabolic process | 79/2897 | 353/18723 | 3.50e-04 | 5.50e-03 | 79 |
| GO:00343101 | Colorectum | SER | primary alcohol catabolic process | 8/2897 | 15/18723 | 7.51e-04 | 9.68e-03 | 8 |
| GO:00461641 | Colorectum | SER | alcohol catabolic process | 17/2897 | 55/18723 | 3.00e-03 | 2.65e-02 | 17 |
| GO:00060681 | Colorectum | SER | ethanol catabolic process | 6/2897 | 12/18723 | 5.42e-03 | 4.03e-02 | 6 |
| GO:00343081 | Colorectum | SER | primary alcohol metabolic process | 26/2897 | 102/18723 | 5.87e-03 | 4.29e-02 | 26 |
| GO:00060662 | Colorectum | MSS | alcohol metabolic process | 92/3467 | 353/18723 | 2.57e-04 | 3.46e-03 | 92 |
| GO:00442822 | Colorectum | MSS | small molecule catabolic process | 94/3467 | 376/18723 | 9.85e-04 | 9.86e-03 | 94 |
| GO:004428211 | Liver | Cirrhotic | small molecule catabolic process | 151/4634 | 376/18723 | 2.20e-11 | 1.34e-09 | 151 |
| GO:000606612 | Liver | Cirrhotic | alcohol metabolic process | 141/4634 | 353/18723 | 1.57e-10 | 8.03e-09 | 141 |
| GO:00343085 | Liver | Cirrhotic | primary alcohol metabolic process | 37/4634 | 102/18723 | 6.17e-03 | 3.07e-02 | 37 |
| GO:004428221 | Liver | HCC | small molecule catabolic process | 225/7958 | 376/18723 | 6.50e-12 | 2.80e-10 | 225 |
| GO:000606621 | Liver | HCC | alcohol metabolic process | 208/7958 | 353/18723 | 2.80e-10 | 9.50e-09 | 208 |
| Page: 1 2 |
| Pathway ID | Tissue | Disease Stage | Description | Gene Ratio | Bg Ratio | pvalue | p.adjust | qvalue | Count |
| hsa00620 | Colorectum | AD | Pyruvate metabolism | 28/2092 | 47/8465 | 3.71e-07 | 5.41e-06 | 3.45e-06 | 28 |
| hsa00010 | Colorectum | AD | Glycolysis / Gluconeogenesis | 34/2092 | 67/8465 | 3.63e-06 | 4.34e-05 | 2.77e-05 | 34 |
| hsa00280 | Colorectum | AD | Valine, leucine and isoleucine degradation | 25/2092 | 48/8465 | 3.97e-05 | 3.41e-04 | 2.18e-04 | 25 |
| hsa00071 | Colorectum | AD | Fatty acid degradation | 20/2092 | 43/8465 | 1.50e-03 | 8.69e-03 | 5.54e-03 | 20 |
| hsa00561 | Colorectum | AD | Glycerolipid metabolism | 24/2092 | 63/8465 | 1.25e-02 | 4.54e-02 | 2.90e-02 | 24 |
| hsa006201 | Colorectum | AD | Pyruvate metabolism | 28/2092 | 47/8465 | 3.71e-07 | 5.41e-06 | 3.45e-06 | 28 |
| hsa000101 | Colorectum | AD | Glycolysis / Gluconeogenesis | 34/2092 | 67/8465 | 3.63e-06 | 4.34e-05 | 2.77e-05 | 34 |
| hsa002801 | Colorectum | AD | Valine, leucine and isoleucine degradation | 25/2092 | 48/8465 | 3.97e-05 | 3.41e-04 | 2.18e-04 | 25 |
| hsa000711 | Colorectum | AD | Fatty acid degradation | 20/2092 | 43/8465 | 1.50e-03 | 8.69e-03 | 5.54e-03 | 20 |
| hsa005611 | Colorectum | AD | Glycerolipid metabolism | 24/2092 | 63/8465 | 1.25e-02 | 4.54e-02 | 2.90e-02 | 24 |
| hsa006202 | Colorectum | SER | Pyruvate metabolism | 22/1580 | 47/8465 | 9.62e-06 | 1.33e-04 | 9.67e-05 | 22 |
| hsa000102 | Colorectum | SER | Glycolysis / Gluconeogenesis | 24/1580 | 67/8465 | 6.62e-04 | 5.36e-03 | 3.89e-03 | 24 |
| hsa003302 | Colorectum | SER | Arginine and proline metabolism | 17/1580 | 50/8465 | 7.12e-03 | 3.77e-02 | 2.74e-02 | 17 |
| hsa000712 | Colorectum | SER | Fatty acid degradation | 15/1580 | 43/8465 | 8.60e-03 | 4.26e-02 | 3.09e-02 | 15 |
| hsa006203 | Colorectum | SER | Pyruvate metabolism | 22/1580 | 47/8465 | 9.62e-06 | 1.33e-04 | 9.67e-05 | 22 |
| hsa000103 | Colorectum | SER | Glycolysis / Gluconeogenesis | 24/1580 | 67/8465 | 6.62e-04 | 5.36e-03 | 3.89e-03 | 24 |
| hsa003303 | Colorectum | SER | Arginine and proline metabolism | 17/1580 | 50/8465 | 7.12e-03 | 3.77e-02 | 2.74e-02 | 17 |
| hsa000713 | Colorectum | SER | Fatty acid degradation | 15/1580 | 43/8465 | 8.60e-03 | 4.26e-02 | 3.09e-02 | 15 |
| hsa006204 | Colorectum | MSS | Pyruvate metabolism | 24/1875 | 47/8465 | 1.25e-05 | 1.35e-04 | 8.27e-05 | 24 |
| hsa000104 | Colorectum | MSS | Glycolysis / Gluconeogenesis | 28/1875 | 67/8465 | 2.36e-04 | 1.81e-03 | 1.11e-03 | 28 |
| Page: 1 2 3 4 |
Top |
Cell-cell communication analysis |
| Identification of potential cell-cell interactions between two cell types and their ligand-receptor pairs for different disease states |
| Ligand | Receptor | LRpair | Pathway | Tissue | Disease Stage |
| Page: 1 |
Top |
Single-cell gene regulatory network inference analysis |
| Find out the significant the regulons (TFs) and the target genes of each regulon across cell types for different disease states |
| TF | Cell Type | Tissue | Disease Stage | Target Gene | RSS | Regulon Activity |
| ∗The dot plots of a searched regulon are shown for all cell subpopulations in each disease state of each tissue based on the regulon specific score inferred using pySCENIC and by calculating the average expression. |
| Page: 1 |
Top |
Somatic mutation of malignant transformation related genes |
| Annotation of somatic variants for genes involved in malignant transformation |
| Hugo Symbol | Variant Class | Variant Classification | dbSNP RS | HGVSc | HGVSp | HGVSp Short | SWISSPROT | BIOTYPE | SIFT | PolyPhen | Tumor Sample Barcode | Tissue | Histology | Sex | Age | Stage | Therapy Types | Drugs | Outcome |
| ALDH1B1 | SNV | Missense_Mutation | c.169N>T | p.Val57Phe | p.V57F | P30837 | protein_coding | tolerated(0.35) | benign(0.011) | TCGA-A8-A07I-01 | Breast | breast invasive carcinoma | Female | >=65 | III/IV | Chemotherapy | 5-fluorouracil | CR | |
| ALDH1B1 | insertion | Frame_Shift_Ins | novel | c.774_775insGATG | p.Ala259AspfsTer32 | p.A259Dfs*32 | P30837 | protein_coding | TCGA-A8-A07L-01 | Breast | breast invasive carcinoma | Female | <65 | III/IV | Chemotherapy | CR | |||
| ALDH1B1 | insertion | Frame_Shift_Ins | novel | c.776_777insCAGCATTTCTG | p.Phe260SerfsTer14 | p.F260Sfs*14 | P30837 | protein_coding | TCGA-A8-A07L-01 | Breast | breast invasive carcinoma | Female | <65 | III/IV | Chemotherapy | CR | |||
| ALDH1B1 | SNV | Missense_Mutation | novel | c.886N>A | p.Ala296Thr | p.A296T | P30837 | protein_coding | deleterious(0.04) | probably_damaging(0.999) | TCGA-2W-A8YY-01 | Cervix | cervical & endocervical cancer | Female | <65 | I/II | Chemotherapy | cisplatin | CR |
| ALDH1B1 | SNV | Missense_Mutation | novel | c.88C>G | p.Leu30Val | p.L30V | P30837 | protein_coding | tolerated(0.39) | benign(0.015) | TCGA-JW-A5VL-01 | Cervix | cervical & endocervical cancer | Female | <65 | I/II | Unknown | Unknown | SD |
| ALDH1B1 | SNV | Missense_Mutation | novel | c.1232G>T | p.Arg411Ile | p.R411I | P30837 | protein_coding | tolerated(0.06) | possibly_damaging(0.526) | TCGA-AA-A00N-01 | Colorectum | colon adenocarcinoma | Male | >=65 | I/II | Unknown | Unknown | PD |
| ALDH1B1 | SNV | Missense_Mutation | c.139G>A | p.Asp47Asn | p.D47N | P30837 | protein_coding | tolerated(0.31) | benign(0.001) | TCGA-AA-A010-01 | Colorectum | colon adenocarcinoma | Female | <65 | I/II | Chemotherapy | folinic | CR | |
| ALDH1B1 | SNV | Missense_Mutation | rs779633928 | c.716C>T | p.Thr239Met | p.T239M | P30837 | protein_coding | deleterious(0) | possibly_damaging(0.759) | TCGA-AA-A010-01 | Colorectum | colon adenocarcinoma | Female | <65 | I/II | Chemotherapy | folinic | CR |
| ALDH1B1 | SNV | Missense_Mutation | c.1130G>A | p.Gly377Asp | p.G377D | P30837 | protein_coding | deleterious(0.01) | benign(0.223) | TCGA-AA-A010-01 | Colorectum | colon adenocarcinoma | Female | <65 | I/II | Chemotherapy | folinic | CR | |
| ALDH1B1 | SNV | Missense_Mutation | c.242N>G | p.Lys81Arg | p.K81R | P30837 | protein_coding | tolerated(0.17) | benign(0.003) | TCGA-AA-A01K-01 | Colorectum | colon adenocarcinoma | Female | >=65 | III/IV | Chemotherapy | folinic | CR |
| Page: 1 2 3 4 5 6 7 |
Top |
Related drugs of malignant transformation related genes |
| Identification of chemicals and drugs interact with genes involved in malignant transfromation |
| (DGIdb 4.0) |
| Entrez ID | Symbol | Category | Interaction Types | Drug Claim Name | Drug Name | PMIDs |
| Page: 1 |

Copyright 2023-Present -The University of Texas Health Science Center at Houston |