
|
|||||
|
 | |
| |
| |
| |
| |
| |
|
Gene: ADA2 |
Gene summary for ADA2 |
| Gene information | Species | Human | Gene symbol | ADA2 | Gene ID | 51816 |
| Gene name | adenosine deaminase 2 | |
| Gene Alias | ADGF | |
| Cytomap | 22q11.1 | |
| Gene Type | protein-coding | GO ID | GO:0006139 | UniProtAcc | Q9NZK5 |
Top |
Malignant transformation analysis |
| Identification of the aberrant gene expression in precancerous and cancerous lesions by comparing the gene expression of stem-like cells in diseased tissues with normal stem cells |
| Entrez ID | Symbol | Replicates | Species | Organ | Tissue | Adj P-value | Log2FC | Malignancy |
| 51816 | ADA2 | S014 | Human | Liver | HCC | 4.08e-23 | 6.09e-01 | 0.2254 |
| 51816 | ADA2 | S015 | Human | Liver | HCC | 7.14e-27 | 9.53e-01 | 0.2375 |
| 51816 | ADA2 | S016 | Human | Liver | HCC | 3.46e-30 | 7.51e-01 | 0.2243 |
| Page: 1 |
| Tissue | Expression Dynamics | Abbreviation |
| Liver | 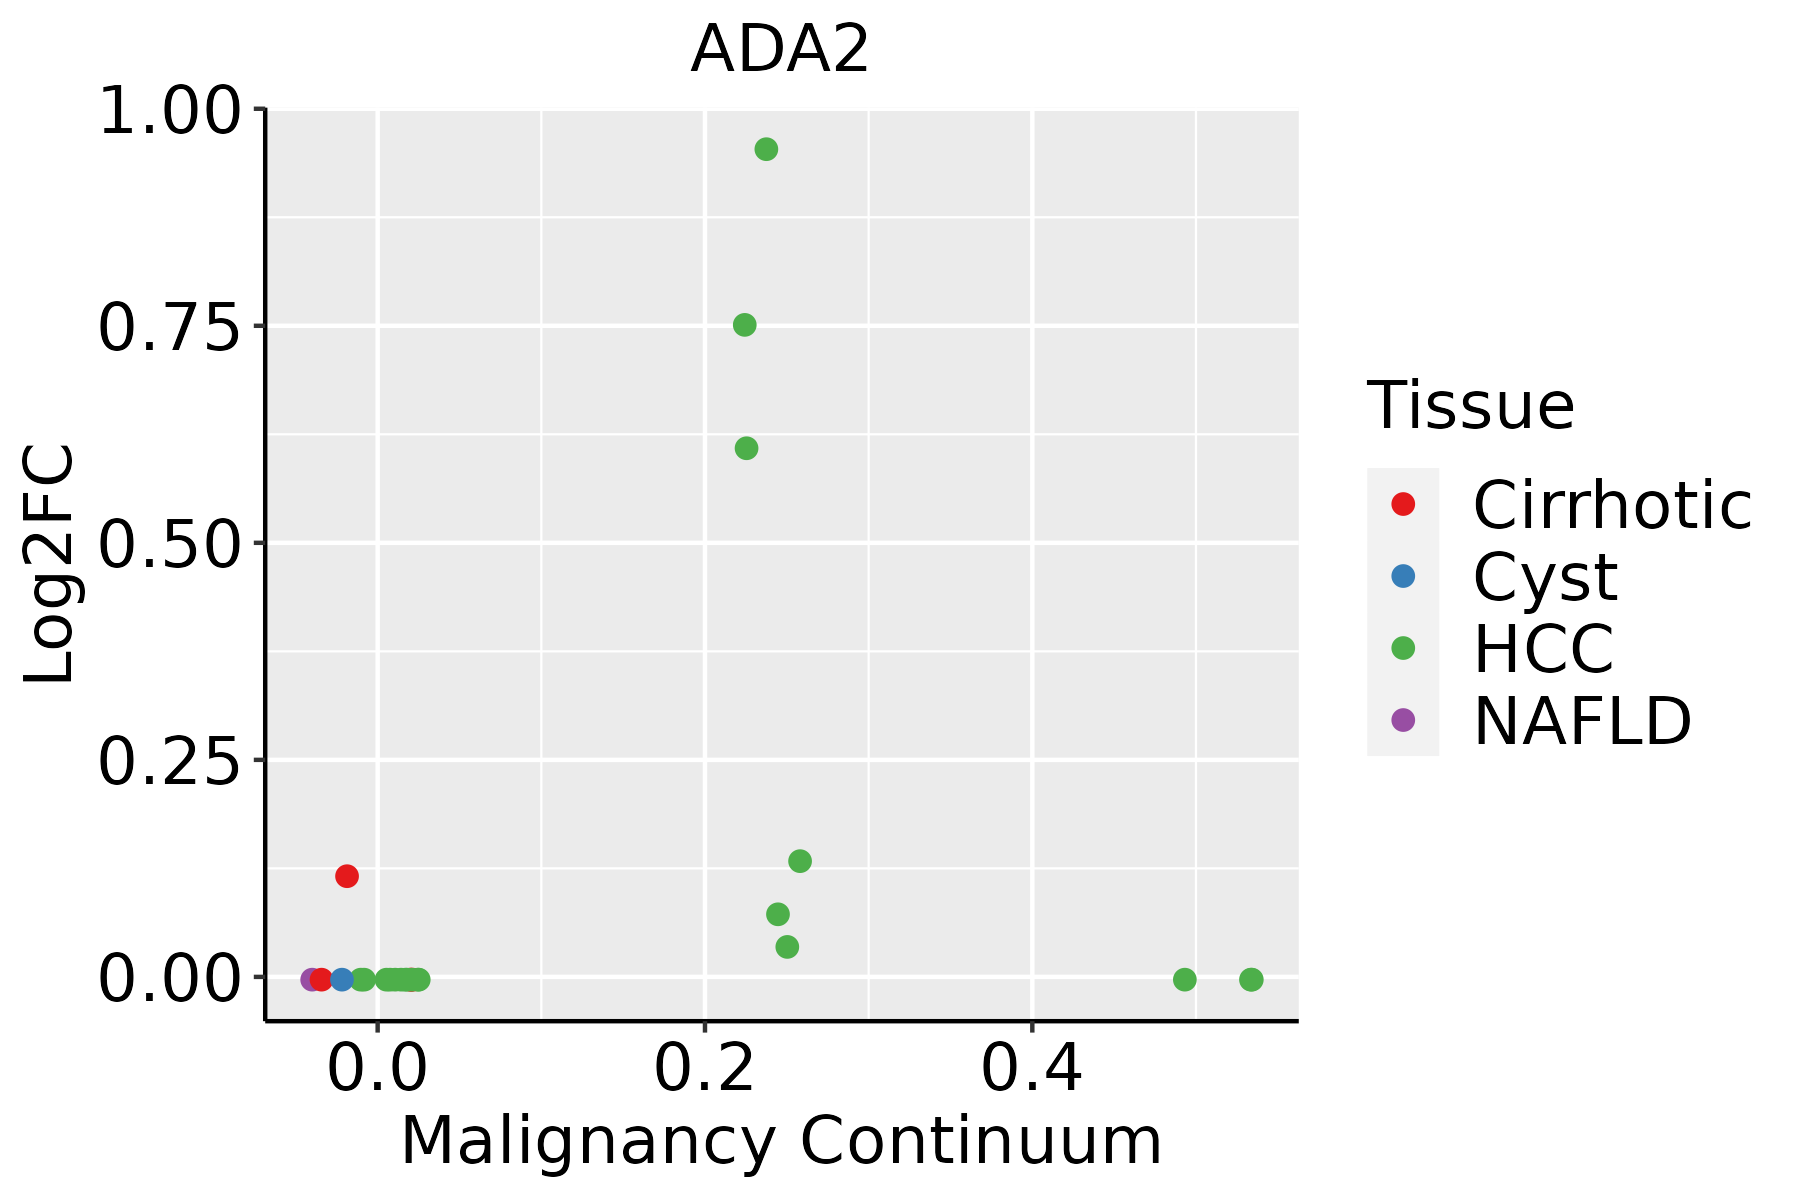 | HCC: Hepatocellular carcinoma |
| NAFLD: Non-alcoholic fatty liver disease |
| ∗log2FC in expression of this searched gene in stem-like cells from each diseased tissue sample relative to stem-like cells in normal samples in each tissue plotted against the malignancy continuum. Samples are colored based on if they are from different disease stage. |
Top |
Malignant transformation related pathway analysis |
| Find out the enriched GO biological processes and KEGG pathways involved in transition from healthy to precancer to cancer |
| Tissue | Disease Stage | Enriched GO biological Processes |
| Colorectum | CRC |  |
| Stomach | GC |  |
| Stomach | CAG with IM |  |
| Stomach | CSG |  |
| Stomach | CAG |  |
| ∗Top 15 enriched GO BP terms are showed in the bar plot of each disease state in each tissue. Each row represents a significant GO biological process which is colored according to the -log10(p.adjust). |
| Page: 1 2 3 4 5 6 7 8 9 |
| GO ID | Tissue | Disease Stage | Description | Gene Ratio | Bg Ratio | pvalue | p.adjust | Count |
| GO:004427021 | Liver | HCC | cellular nitrogen compound catabolic process | 303/7958 | 451/18723 | 9.76e-27 | 3.64e-24 | 303 |
| GO:004670021 | Liver | HCC | heterocycle catabolic process | 299/7958 | 445/18723 | 2.07e-26 | 7.29e-24 | 299 |
| GO:190136121 | Liver | HCC | organic cyclic compound catabolic process | 325/7958 | 495/18723 | 6.52e-26 | 2.18e-23 | 325 |
| GO:001943921 | Liver | HCC | aromatic compound catabolic process | 309/7958 | 467/18723 | 1.56e-25 | 4.94e-23 | 309 |
| GO:003465521 | Liver | HCC | nucleobase-containing compound catabolic process | 273/7958 | 407/18723 | 4.84e-24 | 1.23e-21 | 273 |
| GO:001657021 | Liver | HCC | histone modification | 283/7958 | 463/18723 | 2.68e-16 | 2.33e-14 | 283 |
| GO:00182052 | Liver | HCC | peptidyl-lysine modification | 230/7958 | 376/18723 | 1.51e-13 | 8.32e-12 | 230 |
| GO:007252122 | Liver | HCC | purine-containing compound metabolic process | 250/7958 | 416/18723 | 2.26e-13 | 1.24e-11 | 250 |
| GO:00064732 | Liver | HCC | protein acetylation | 135/7958 | 201/18723 | 1.20e-12 | 5.92e-11 | 135 |
| GO:00435432 | Liver | HCC | protein acylation | 157/7958 | 243/18723 | 2.40e-12 | 1.12e-10 | 157 |
| GO:00183942 | Liver | HCC | peptidyl-lysine acetylation | 116/7958 | 169/18723 | 5.11e-12 | 2.23e-10 | 116 |
| GO:004428221 | Liver | HCC | small molecule catabolic process | 225/7958 | 376/18723 | 6.50e-12 | 2.80e-10 | 225 |
| GO:00064752 | Liver | HCC | internal protein amino acid acetylation | 107/7958 | 160/18723 | 3.77e-10 | 1.23e-08 | 107 |
| GO:00183932 | Liver | HCC | internal peptidyl-lysine acetylation | 105/7958 | 158/18723 | 9.48e-10 | 2.90e-08 | 105 |
| GO:00165732 | Liver | HCC | histone acetylation | 101/7958 | 152/18723 | 1.99e-09 | 5.63e-08 | 101 |
| GO:003105621 | Liver | HCC | regulation of histone modification | 99/7958 | 152/18723 | 1.40e-08 | 3.40e-07 | 99 |
| GO:007252212 | Liver | HCC | purine-containing compound biosynthetic process | 114/7958 | 200/18723 | 2.36e-05 | 2.49e-04 | 114 |
| GO:0031058 | Liver | HCC | positive regulation of histone modification | 58/7958 | 92/18723 | 5.55e-05 | 5.21e-04 | 58 |
| GO:1901136 | Liver | HCC | carbohydrate derivative catabolic process | 98/7958 | 172/18723 | 8.71e-05 | 7.62e-04 | 98 |
| GO:19016571 | Liver | HCC | glycosyl compound metabolic process | 55/7958 | 88/18723 | 1.20e-04 | 1.01e-03 | 55 |
| Page: 1 2 |
| Pathway ID | Tissue | Disease Stage | Description | Gene Ratio | Bg Ratio | pvalue | p.adjust | qvalue | Count |
| Page: 1 |
Top |
Cell-cell communication analysis |
| Identification of potential cell-cell interactions between two cell types and their ligand-receptor pairs for different disease states |
| Ligand | Receptor | LRpair | Pathway | Tissue | Disease Stage |
| Page: 1 |
Top |
Single-cell gene regulatory network inference analysis |
| Find out the significant the regulons (TFs) and the target genes of each regulon across cell types for different disease states |
| TF | Cell Type | Tissue | Disease Stage | Target Gene | RSS | Regulon Activity |
| ∗The dot plots of a searched regulon are shown for all cell subpopulations in each disease state of each tissue based on the regulon specific score inferred using pySCENIC and by calculating the average expression. |
| Page: 1 |
Top |
Somatic mutation of malignant transformation related genes |
| Annotation of somatic variants for genes involved in malignant transformation |
| Hugo Symbol | Variant Class | Variant Classification | dbSNP RS | HGVSc | HGVSp | HGVSp Short | SWISSPROT | BIOTYPE | SIFT | PolyPhen | Tumor Sample Barcode | Tissue | Histology | Sex | Age | Stage | Therapy Types | Drugs | Outcome |
| Page: 1 |
Top |
Related drugs of malignant transformation related genes |
| Identification of chemicals and drugs interact with genes involved in malignant transfromation |
| (DGIdb 4.0) |
| Entrez ID | Symbol | Category | Interaction Types | Drug Claim Name | Drug Name | PMIDs |
| Page: 1 |

Copyright 2023-Present -The University of Texas Health Science Center at Houston |