
|
|||||
|
 | |
| |
| |
| |
| |
| |
|
Gene: ENO3 |
Gene summary for ENO3 |
| Gene information | Species | Human | Gene symbol | ENO3 | Gene ID | 2027 |
| Gene name | enolase 3 | |
| Gene Alias | GSD13 | |
| Cytomap | 17p13.2 | |
| Gene Type | protein-coding | GO ID | GO:0005975 | UniProtAcc | P13929 |
Top |
Malignant transformation analysis |
| Identification of the aberrant gene expression in precancerous and cancerous lesions by comparing the gene expression of stem-like cells in diseased tissues with normal stem cells |
| Entrez ID | Symbol | Replicates | Species | Organ | Tissue | Adj P-value | Log2FC | Malignancy |
| 2027 | ENO3 | HCC1_Meng | Human | Liver | HCC | 2.32e-05 | -1.74e-02 | 0.0246 |
| 2027 | ENO3 | HCC2 | Human | Liver | HCC | 1.58e-23 | 4.60e+00 | 0.5341 |
| 2027 | ENO3 | Pt14.b | Human | Liver | HCC | 4.22e-07 | 2.45e-01 | 0.018 |
| 2027 | ENO3 | S014 | Human | Liver | HCC | 4.70e-31 | 8.55e-01 | 0.2254 |
| 2027 | ENO3 | S015 | Human | Liver | HCC | 7.20e-21 | 9.61e-01 | 0.2375 |
| 2027 | ENO3 | S016 | Human | Liver | HCC | 5.56e-32 | 1.01e+00 | 0.2243 |
| 2027 | ENO3 | S029 | Human | Liver | HCC | 2.13e-03 | 1.02e-01 | 0.2581 |
| Page: 1 |
| Tissue | Expression Dynamics | Abbreviation |
| Liver | 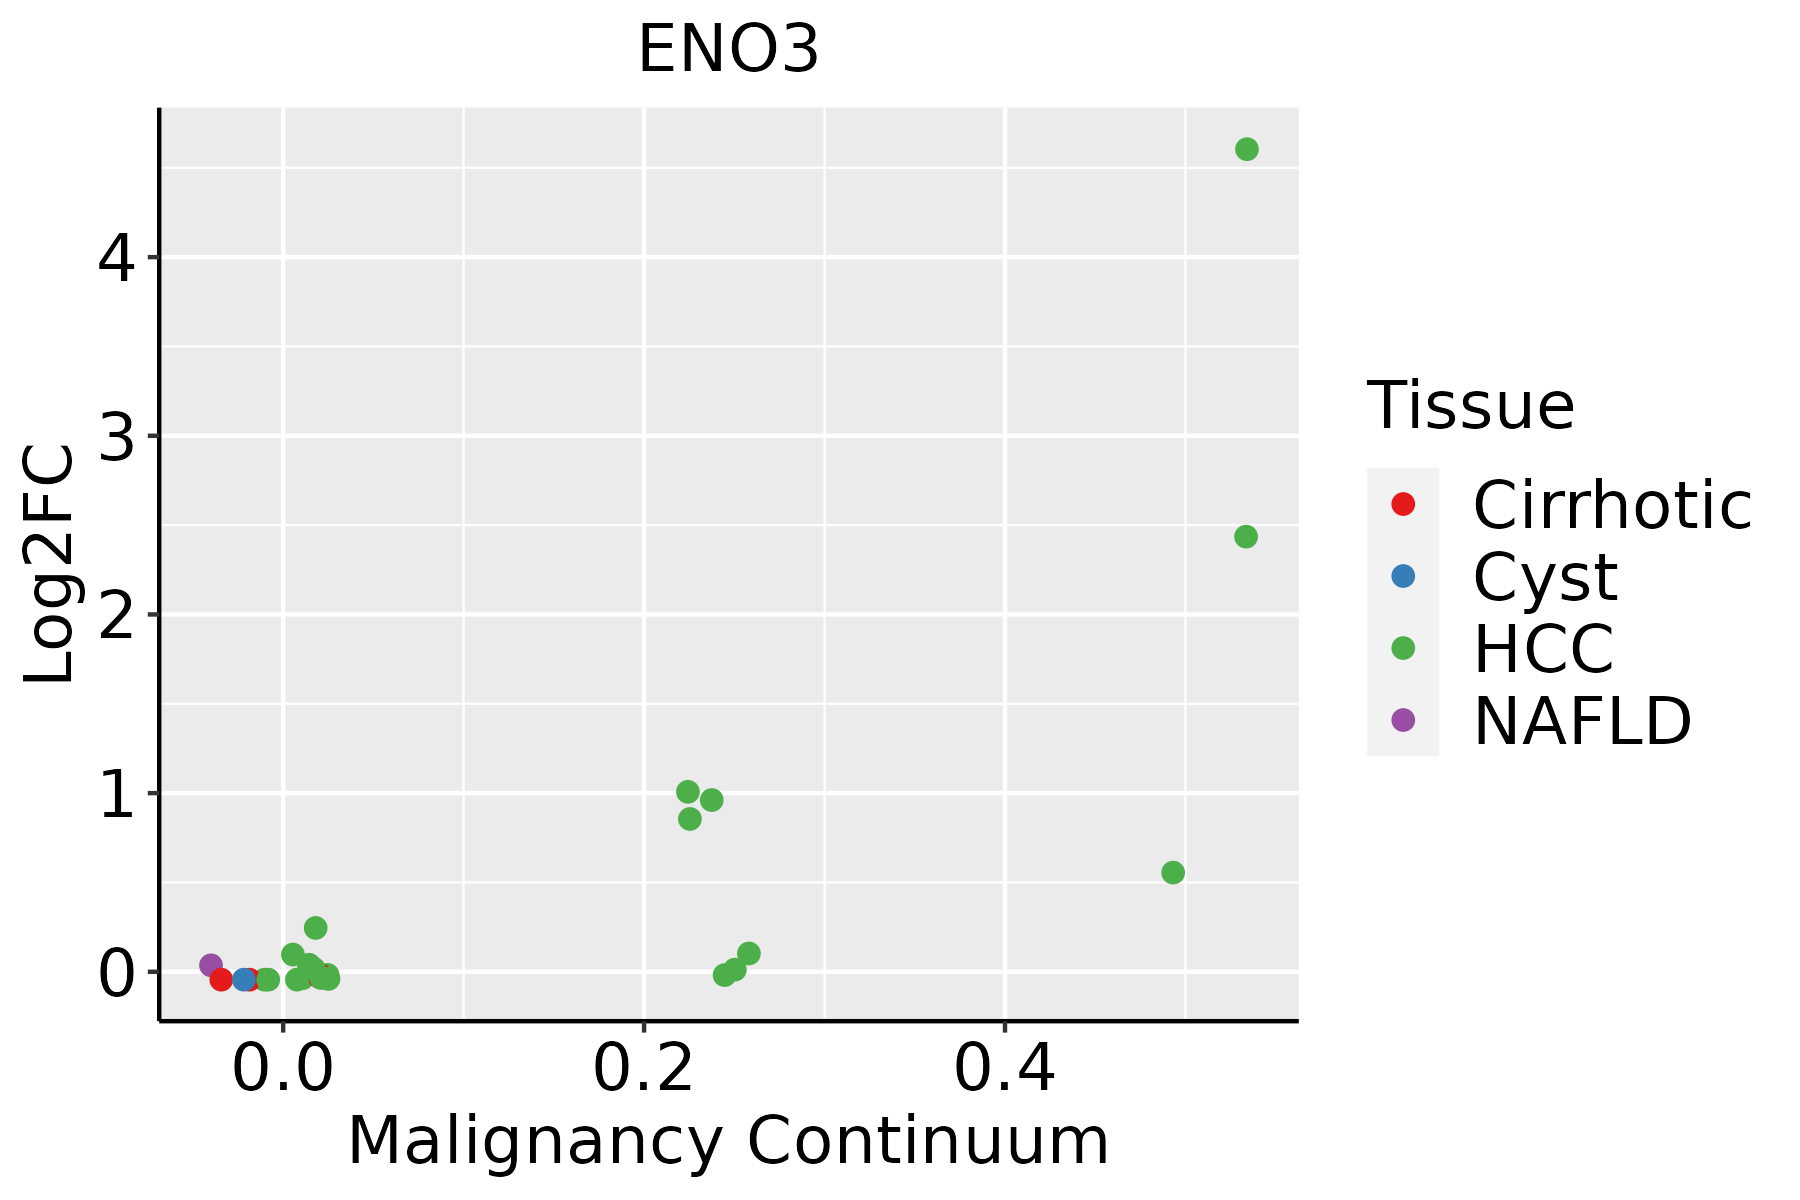 | HCC: Hepatocellular carcinoma |
| NAFLD: Non-alcoholic fatty liver disease |
| ∗log2FC in expression of this searched gene in stem-like cells from each diseased tissue sample relative to stem-like cells in normal samples in each tissue plotted against the malignancy continuum. Samples are colored based on if they are from different disease stage. |
Top |
Malignant transformation related pathway analysis |
| Find out the enriched GO biological processes and KEGG pathways involved in transition from healthy to precancer to cancer |
| Tissue | Disease Stage | Enriched GO biological Processes |
| Colorectum | AD |  |
| Colorectum | SER |  |
| Colorectum | MSS |  |
| Colorectum | MSI-H |  |
| Colorectum | FAP |  |
| ∗Top 15 enriched GO BP terms are showed in the bar plot of each disease state in each tissue. Each row represents a significant GO biological process which is colored according to the -log10(p.adjust). |
| Page: 1 2 3 4 5 6 7 8 9 |
| GO ID | Tissue | Disease Stage | Description | Gene Ratio | Bg Ratio | pvalue | p.adjust | Count |
| GO:000609122 | Liver | HCC | generation of precursor metabolites and energy | 340/7958 | 490/18723 | 4.04e-34 | 2.85e-31 | 340 |
| GO:004603422 | Liver | HCC | ATP metabolic process | 198/7958 | 277/18723 | 8.30e-23 | 1.55e-20 | 198 |
| GO:000911722 | Liver | HCC | nucleotide metabolic process | 300/7958 | 489/18723 | 1.61e-17 | 1.71e-15 | 300 |
| GO:000675322 | Liver | HCC | nucleoside phosphate metabolic process | 304/7958 | 497/18723 | 1.78e-17 | 1.85e-15 | 304 |
| GO:001969322 | Liver | HCC | ribose phosphate metabolic process | 248/7958 | 396/18723 | 3.15e-16 | 2.70e-14 | 248 |
| GO:000925922 | Liver | HCC | ribonucleotide metabolic process | 240/7958 | 385/18723 | 2.07e-15 | 1.51e-13 | 240 |
| GO:000915022 | Liver | HCC | purine ribonucleotide metabolic process | 226/7958 | 368/18723 | 1.36e-13 | 7.69e-12 | 226 |
| GO:007252122 | Liver | HCC | purine-containing compound metabolic process | 250/7958 | 416/18723 | 2.26e-13 | 1.24e-11 | 250 |
| GO:000616322 | Liver | HCC | purine nucleotide metabolic process | 236/7958 | 396/18723 | 3.59e-12 | 1.62e-10 | 236 |
| GO:000609022 | Liver | HCC | pyruvate metabolic process | 73/7958 | 106/18723 | 3.52e-08 | 7.82e-07 | 73 |
| GO:001605222 | Liver | HCC | carbohydrate catabolic process | 99/7958 | 154/18723 | 3.79e-08 | 8.30e-07 | 99 |
| GO:000918522 | Liver | HCC | ribonucleoside diphosphate metabolic process | 72/7958 | 106/18723 | 1.05e-07 | 2.03e-06 | 72 |
| GO:004603122 | Liver | HCC | ADP metabolic process | 63/7958 | 90/18723 | 1.17e-07 | 2.25e-06 | 63 |
| GO:000913522 | Liver | HCC | purine nucleoside diphosphate metabolic process | 70/7958 | 103/18723 | 1.52e-07 | 2.82e-06 | 70 |
| GO:000917922 | Liver | HCC | purine ribonucleoside diphosphate metabolic process | 70/7958 | 103/18723 | 1.52e-07 | 2.82e-06 | 70 |
| GO:000913222 | Liver | HCC | nucleoside diphosphate metabolic process | 81/7958 | 124/18723 | 2.34e-07 | 4.17e-06 | 81 |
| GO:004693922 | Liver | HCC | nucleotide phosphorylation | 68/7958 | 101/18723 | 3.95e-07 | 6.70e-06 | 68 |
| GO:000941022 | Liver | HCC | response to xenobiotic stimulus | 248/7958 | 462/18723 | 6.47e-07 | 1.02e-05 | 248 |
| GO:000616522 | Liver | HCC | nucleoside diphosphate phosphorylation | 66/7958 | 99/18723 | 1.01e-06 | 1.52e-05 | 66 |
| GO:000609622 | Liver | HCC | glycolytic process | 56/7958 | 81/18723 | 1.11e-06 | 1.65e-05 | 56 |
| Page: 1 2 |
| Pathway ID | Tissue | Disease Stage | Description | Gene Ratio | Bg Ratio | pvalue | p.adjust | qvalue | Count |
| hsa0120041 | Liver | HCC | Carbon metabolism | 89/4020 | 115/8465 | 3.92e-11 | 6.56e-10 | 3.65e-10 | 89 |
| hsa030182 | Liver | HCC | RNA degradation | 58/4020 | 79/8465 | 2.29e-06 | 2.19e-05 | 1.22e-05 | 58 |
| hsa0123021 | Liver | HCC | Biosynthesis of amino acids | 53/4020 | 75/8465 | 3.79e-05 | 2.11e-04 | 1.18e-04 | 53 |
| hsa0406622 | Liver | HCC | HIF-1 signaling pathway | 70/4020 | 109/8465 | 2.96e-04 | 1.36e-03 | 7.57e-04 | 70 |
| hsa0001022 | Liver | HCC | Glycolysis / Gluconeogenesis | 43/4020 | 67/8465 | 4.26e-03 | 1.29e-02 | 7.15e-03 | 43 |
| hsa0120051 | Liver | HCC | Carbon metabolism | 89/4020 | 115/8465 | 3.92e-11 | 6.56e-10 | 3.65e-10 | 89 |
| hsa030183 | Liver | HCC | RNA degradation | 58/4020 | 79/8465 | 2.29e-06 | 2.19e-05 | 1.22e-05 | 58 |
| hsa0123031 | Liver | HCC | Biosynthesis of amino acids | 53/4020 | 75/8465 | 3.79e-05 | 2.11e-04 | 1.18e-04 | 53 |
| hsa0406632 | Liver | HCC | HIF-1 signaling pathway | 70/4020 | 109/8465 | 2.96e-04 | 1.36e-03 | 7.57e-04 | 70 |
| hsa0001032 | Liver | HCC | Glycolysis / Gluconeogenesis | 43/4020 | 67/8465 | 4.26e-03 | 1.29e-02 | 7.15e-03 | 43 |
| Page: 1 |
Top |
Cell-cell communication analysis |
| Identification of potential cell-cell interactions between two cell types and their ligand-receptor pairs for different disease states |
| Ligand | Receptor | LRpair | Pathway | Tissue | Disease Stage |
| Page: 1 |
Top |
Single-cell gene regulatory network inference analysis |
| Find out the significant the regulons (TFs) and the target genes of each regulon across cell types for different disease states |
| TF | Cell Type | Tissue | Disease Stage | Target Gene | RSS | Regulon Activity |
| ∗The dot plots of a searched regulon are shown for all cell subpopulations in each disease state of each tissue based on the regulon specific score inferred using pySCENIC and by calculating the average expression. |
| Page: 1 |
Top |
Somatic mutation of malignant transformation related genes |
| Annotation of somatic variants for genes involved in malignant transformation |
| Hugo Symbol | Variant Class | Variant Classification | dbSNP RS | HGVSc | HGVSp | HGVSp Short | SWISSPROT | BIOTYPE | SIFT | PolyPhen | Tumor Sample Barcode | Tissue | Histology | Sex | Age | Stage | Therapy Types | Drugs | Outcome |
| ENO3 | SNV | Missense_Mutation | c.437N>T | p.Pro146Leu | p.P146L | P13929 | protein_coding | deleterious_low_confidence(0) | possibly_damaging(0.792) | TCGA-AR-A1AR-01 | Breast | breast invasive carcinoma | Female | <65 | III/IV | Unspecific | Docetaxel | PD | |
| ENO3 | SNV | Missense_Mutation | rs373988255 | c.697N>A | p.Ala233Thr | p.A233T | P13929 | protein_coding | deleterious_low_confidence(0.04) | benign(0.033) | TCGA-BH-A18G-01 | Breast | breast invasive carcinoma | Female | >=65 | I/II | Unknown | Unknown | SD |
| ENO3 | SNV | Missense_Mutation | rs778244316 | c.322N>A | p.Ala108Thr | p.A108T | P13929 | protein_coding | deleterious_low_confidence(0.01) | possibly_damaging(0.791) | TCGA-2W-A8YY-01 | Cervix | cervical & endocervical cancer | Female | <65 | I/II | Chemotherapy | cisplatin | CR |
| ENO3 | SNV | Missense_Mutation | novel | c.736G>T | p.Val246Leu | p.V246L | P13929 | protein_coding | deleterious_low_confidence(0) | benign(0.149) | TCGA-C5-A902-01 | Cervix | cervical & endocervical cancer | Female | <65 | I/II | Chemotherapy | cisplatin | SD |
| ENO3 | SNV | Missense_Mutation | c.155N>A | p.Gly52Glu | p.G52E | P13929 | protein_coding | deleterious_low_confidence(0.01) | benign(0.235) | TCGA-EK-A2RK-01 | Cervix | cervical & endocervical cancer | Female | >=65 | I/II | Unknown | Unknown | SD | |
| ENO3 | SNV | Missense_Mutation | rs757279282 | c.301N>A | p.Glu101Lys | p.E101K | P13929 | protein_coding | tolerated_low_confidence(0.18) | possibly_damaging(0.872) | TCGA-EK-A2RK-01 | Cervix | cervical & endocervical cancer | Female | >=65 | I/II | Unknown | Unknown | SD |
| ENO3 | SNV | Missense_Mutation | c.770N>G | p.Tyr257Cys | p.Y257C | P13929 | protein_coding | deleterious_low_confidence(0) | probably_damaging(0.998) | TCGA-A6-2686-01 | Colorectum | colon adenocarcinoma | Female | >=65 | I/II | Unknown | Unknown | SD | |
| ENO3 | SNV | Missense_Mutation | rs755474025 | c.1030N>A | p.Val344Ile | p.V344I | P13929 | protein_coding | tolerated_low_confidence(0.07) | possibly_damaging(0.826) | TCGA-AA-3864-01 | Colorectum | colon adenocarcinoma | Male | >=65 | I/II | Unknown | Unknown | SD |
| ENO3 | SNV | Missense_Mutation | novel | c.377A>G | p.Lys126Arg | p.K126R | P13929 | protein_coding | tolerated_low_confidence(0.06) | benign(0.117) | TCGA-AD-A5EJ-01 | Colorectum | colon adenocarcinoma | Female | >=65 | I/II | Unknown | Unknown | SD |
| ENO3 | SNV | Missense_Mutation | c.602G>T | p.Gly201Val | p.G201V | P13929 | protein_coding | deleterious_low_confidence(0) | probably_damaging(0.972) | TCGA-G4-6588-01 | Colorectum | colon adenocarcinoma | Female | <65 | I/II | Unknown | Unknown | SD |
| Page: 1 2 3 4 5 |
Top |
Related drugs of malignant transformation related genes |
| Identification of chemicals and drugs interact with genes involved in malignant transfromation |
| (DGIdb 4.0) |
| Entrez ID | Symbol | Category | Interaction Types | Drug Claim Name | Drug Name | PMIDs |
| Page: 1 |

Copyright 2023-Present -The University of Texas Health Science Center at Houston |