| Entrez ID | Symbol | Replicates | Species | Organ | Tissue | Adj P-value | Log2FC | Malignancy |
| 54832 | VPS13C | 052097_1595-all-cells | Human | Prostate | BPH | 5.15e-18 | 4.66e-01 | 0.0972 |
| 54832 | VPS13C | 052099_1652-all-cells | Human | Prostate | BPH | 9.33e-11 | 3.40e-01 | 0.1038 |
| 54832 | VPS13C | Dong_P1 | Human | Prostate | Tumor | 1.63e-11 | 1.03e-01 | 0.035 |
| 54832 | VPS13C | Dong_P3 | Human | Prostate | Tumor | 8.71e-17 | 1.93e-01 | 0.0278 |
| 54832 | VPS13C | Dong_P4 | Human | Prostate | Tumor | 8.50e-10 | 2.95e-01 | 0.0292 |
| 54832 | VPS13C | Dong_P5 | Human | Prostate | Tumor | 1.43e-11 | -4.00e-02 | 0.053 |
| 54832 | VPS13C | GSM5353215_PA_AUG_PB_1B_S2 | Human | Prostate | Tumor | 8.92e-03 | 6.45e-01 | 0.1557 |
| 54832 | VPS13C | GSM5353216_PA_PB1A_Pool_1_3_S50_L002 | Human | Prostate | Tumor | 1.35e-05 | 7.71e-01 | 0.159 |
| 54832 | VPS13C | GSM5353221_PA_PB2A_Pool_1_3_S25_L001 | Human | Prostate | Tumor | 2.31e-27 | 9.99e-01 | 0.1633 |
| 54832 | VPS13C | GSM5353222_PA_PB2B_Pool_1_3_S52_L002 | Human | Prostate | Tumor | 2.22e-20 | 7.74e-01 | 0.1608 |
| 54832 | VPS13C | GSM5353223_PA_PB2B_Pool_2_S26_L001 | Human | Prostate | Tumor | 2.70e-08 | 6.30e-01 | 0.1604 |
| 54832 | VPS13C | GSM5353224_PA_PR5186_Pool_1_2_3_S27_L001 | Human | Prostate | Tumor | 1.29e-10 | 6.57e-01 | 0.1621 |
| 54832 | VPS13C | GSM5353225_PA_PR5196-1_Pool_1_2_3_S53_L002 | Human | Prostate | Tumor | 4.65e-10 | 7.72e-01 | 0.1619 |
| 54832 | VPS13C | GSM5353226_PA_PR5196-2_Pool_1_2_3_S54_L002 | Human | Prostate | Tumor | 3.47e-06 | 7.79e-01 | 0.159 |
| 54832 | VPS13C | GSM5353227_PA_PR5199-193K_Pool_1_2_3_S55_L002 | Human | Prostate | Tumor | 2.89e-06 | 5.32e-01 | 0.1602 |
| 54832 | VPS13C | GSM5353236_PA_PR5251_T1_S7_L001 | Human | Prostate | Tumor | 8.87e-03 | 5.03e-01 | 0.1608 |
| 54832 | VPS13C | GSM5353240_PA_PR5254_T1_S15_L001 | Human | Prostate | Tumor | 4.38e-06 | 4.12e-01 | 0.1575 |
| 54832 | VPS13C | GSM5353243_PA_PR5261_T1_S23_L002 | Human | Prostate | Tumor | 3.55e-04 | 3.48e-01 | 0.1545 |
| 54832 | VPS13C | GSM5353244_PA_PR5261_T2_S24_L002 | Human | Prostate | Tumor | 1.98e-05 | 4.03e-01 | 0.1569 |
| 54832 | VPS13C | male-WTA | Human | Thyroid | PTC | 2.34e-29 | 2.95e-01 | 0.1037 |
| Tissue | Expression Dynamics | Abbreviation |
| Colorectum (GSE201348) |  | FAP: Familial adenomatous polyposis |
| CRC: Colorectal cancer |
| Colorectum (HTA11) |  | AD: Adenomas |
| SER: Sessile serrated lesions |
| MSI-H: Microsatellite-high colorectal cancer |
| MSS: Microsatellite stable colorectal cancer |
| Esophagus | 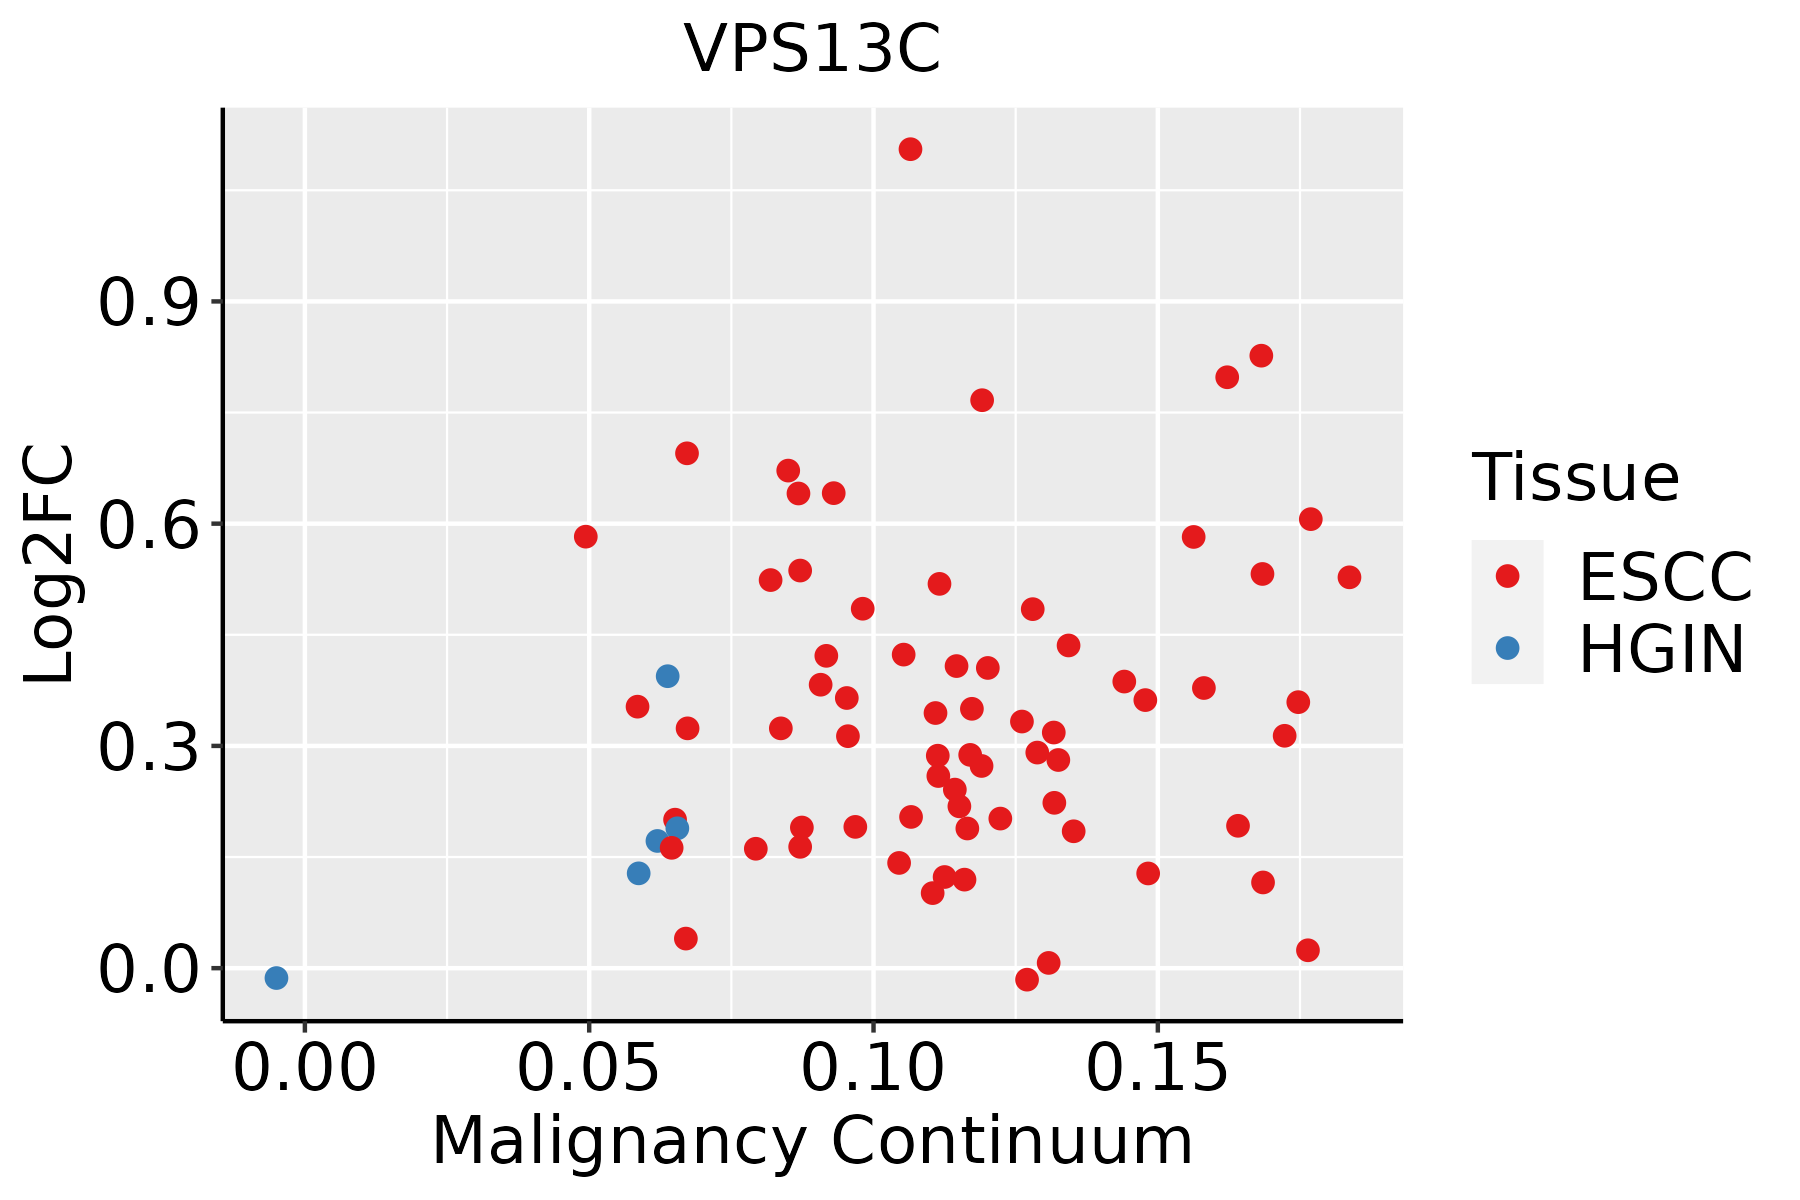 | ESCC: Esophageal squamous cell carcinoma |
| HGIN: High-grade intraepithelial neoplasias |
| LGIN: Low-grade intraepithelial neoplasias |
| Liver | 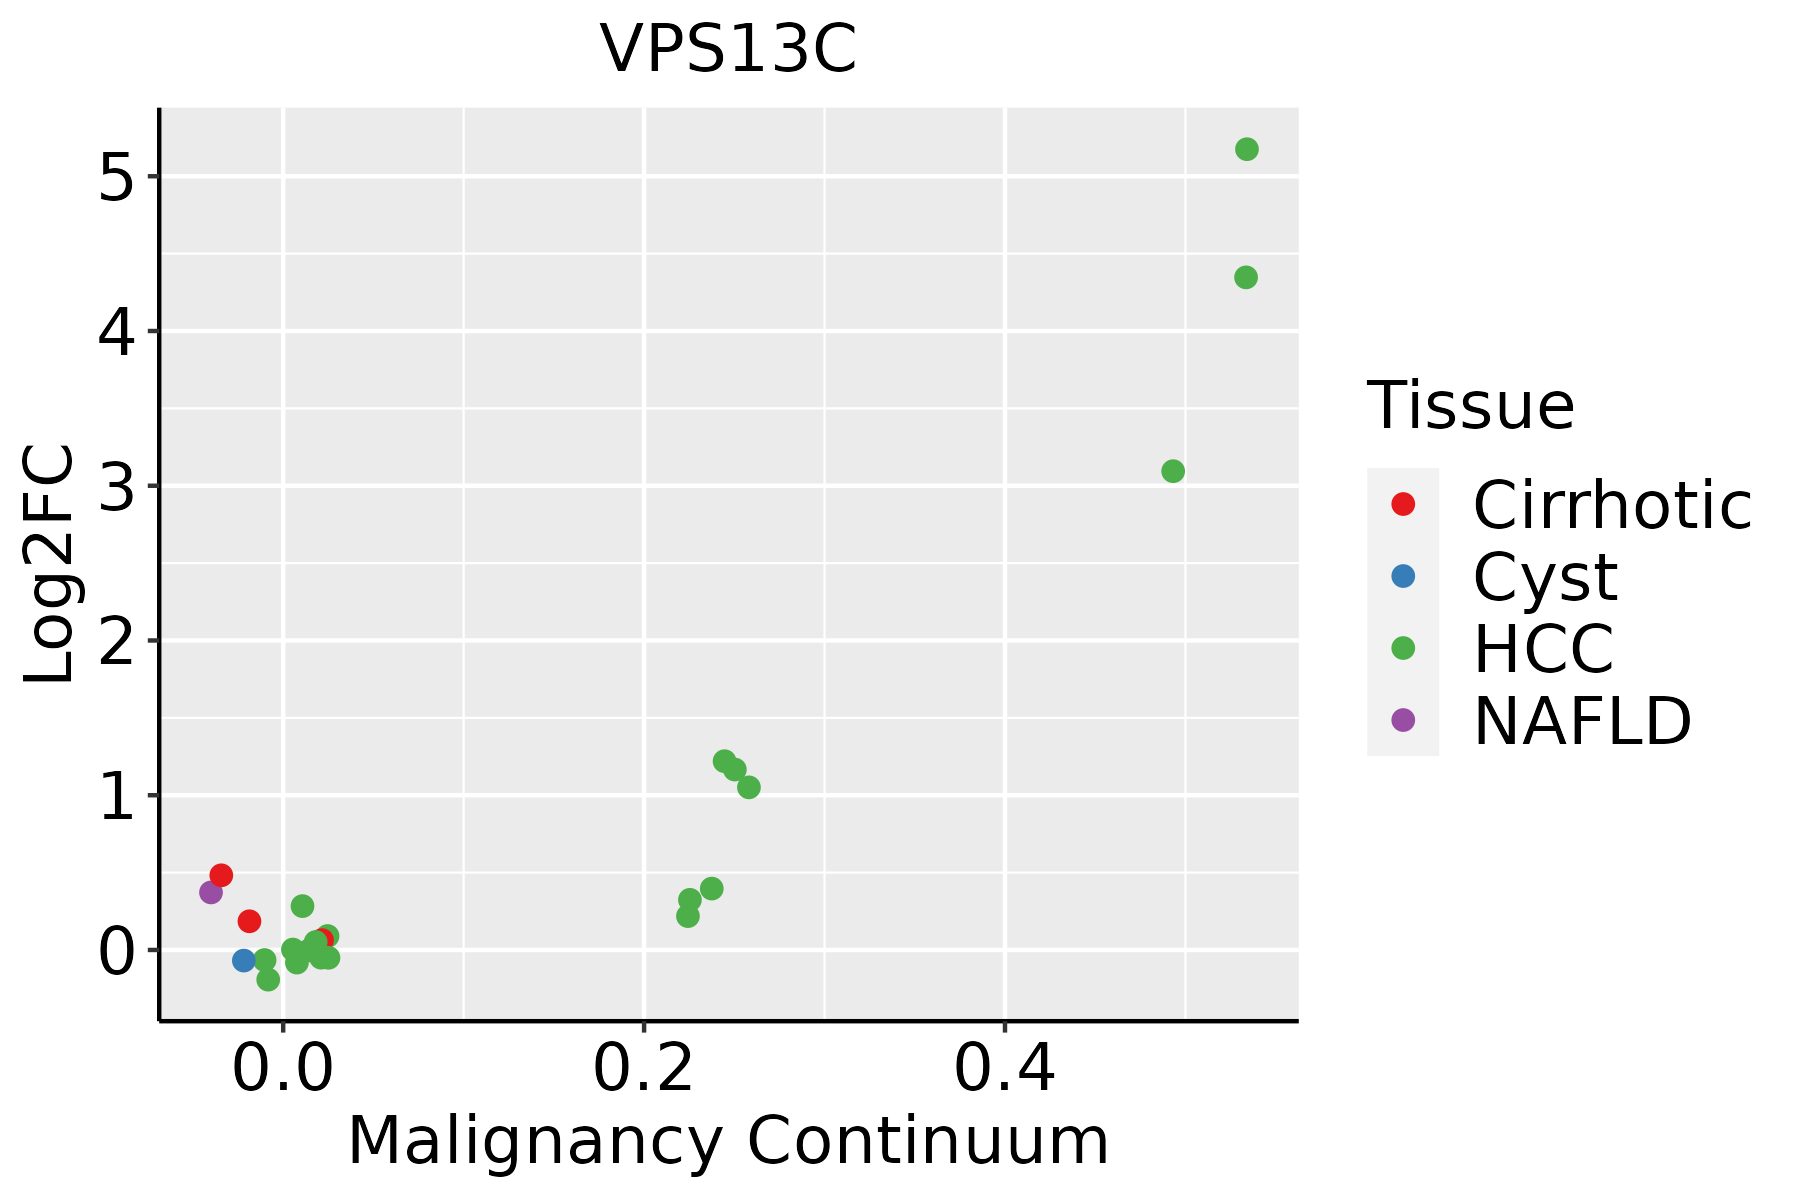 | HCC: Hepatocellular carcinoma |
| NAFLD: Non-alcoholic fatty liver disease |
| Lung |  | AAH: Atypical adenomatous hyperplasia |
| AIS: Adenocarcinoma in situ |
| IAC: Invasive lung adenocarcinoma |
| MIA: Minimally invasive adenocarcinoma |
| Oral Cavity | 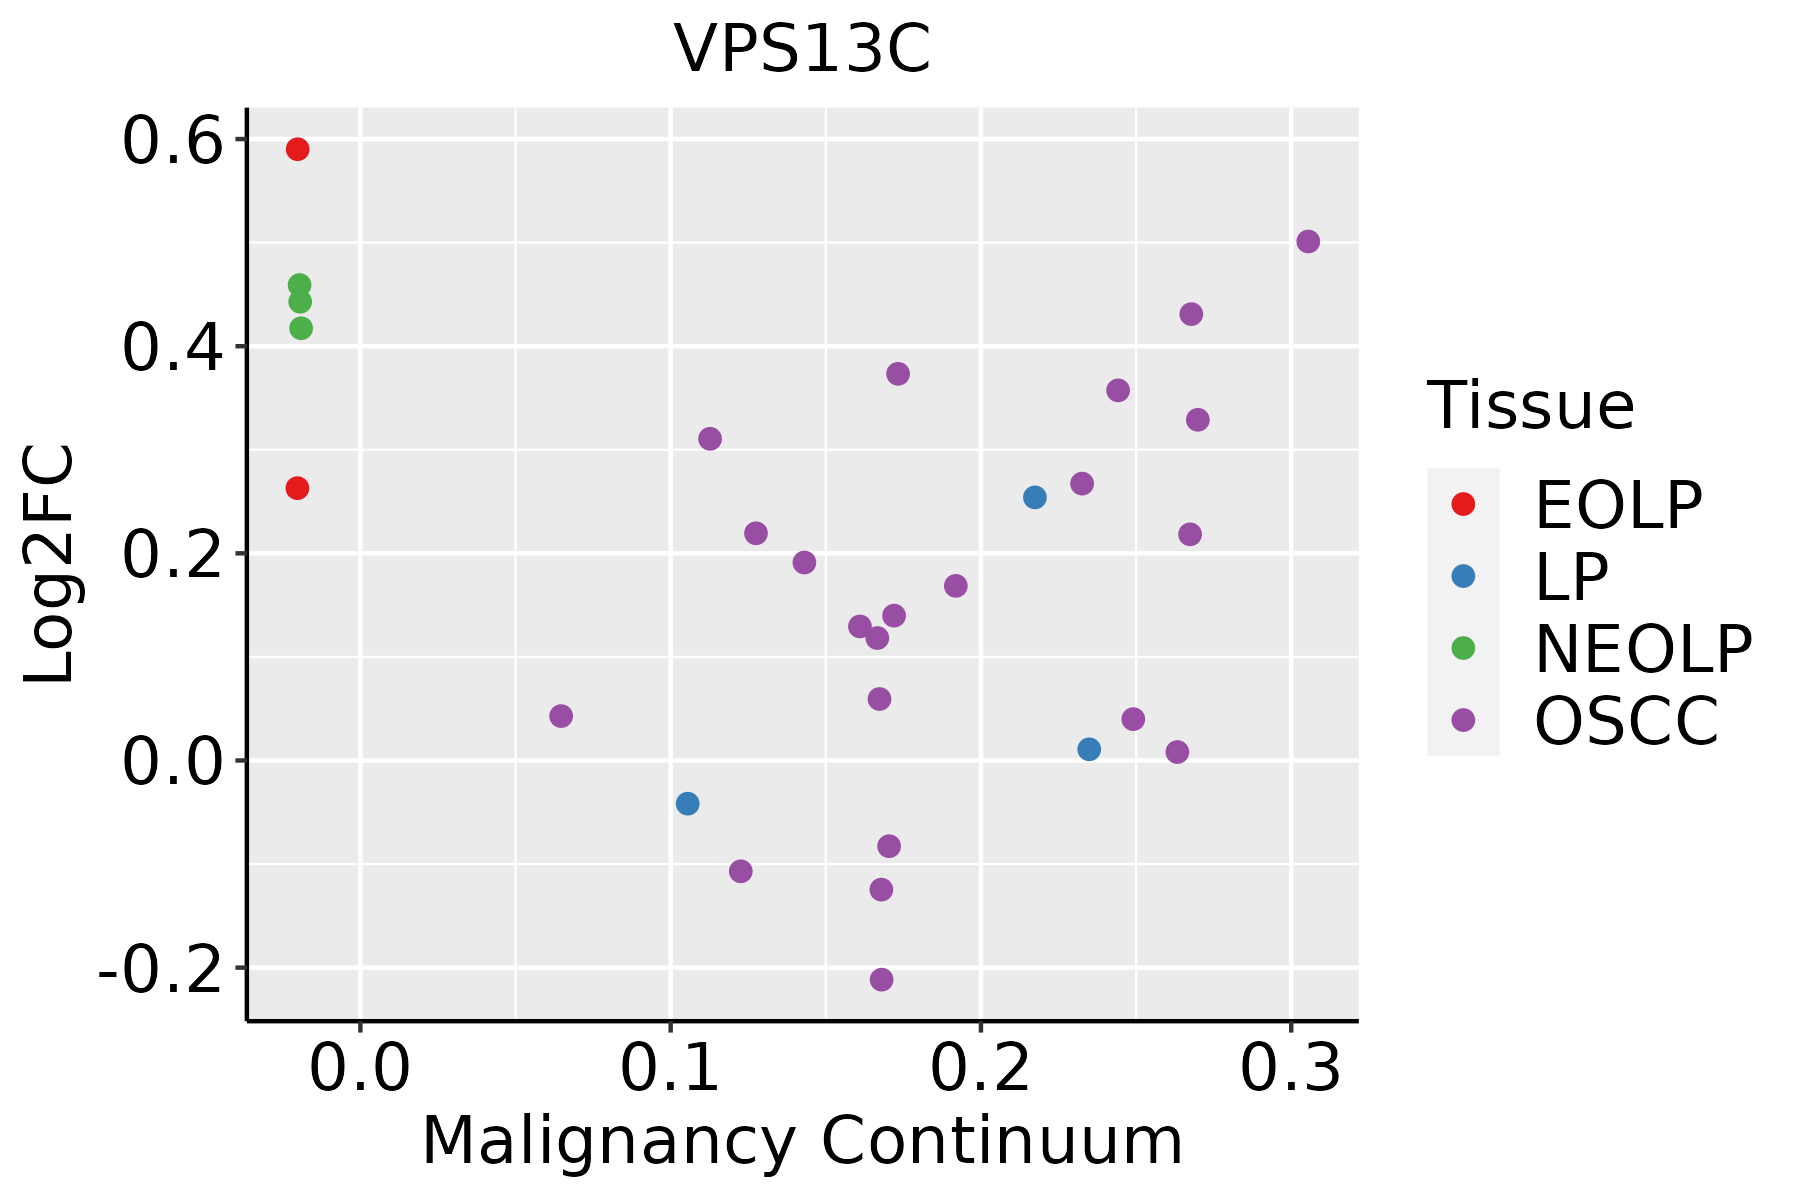 | EOLP: Erosive Oral lichen planus |
| LP: leukoplakia |
| NEOLP: Non-erosive oral lichen planus |
| OSCC: Oral squamous cell carcinoma |
| Prostate | 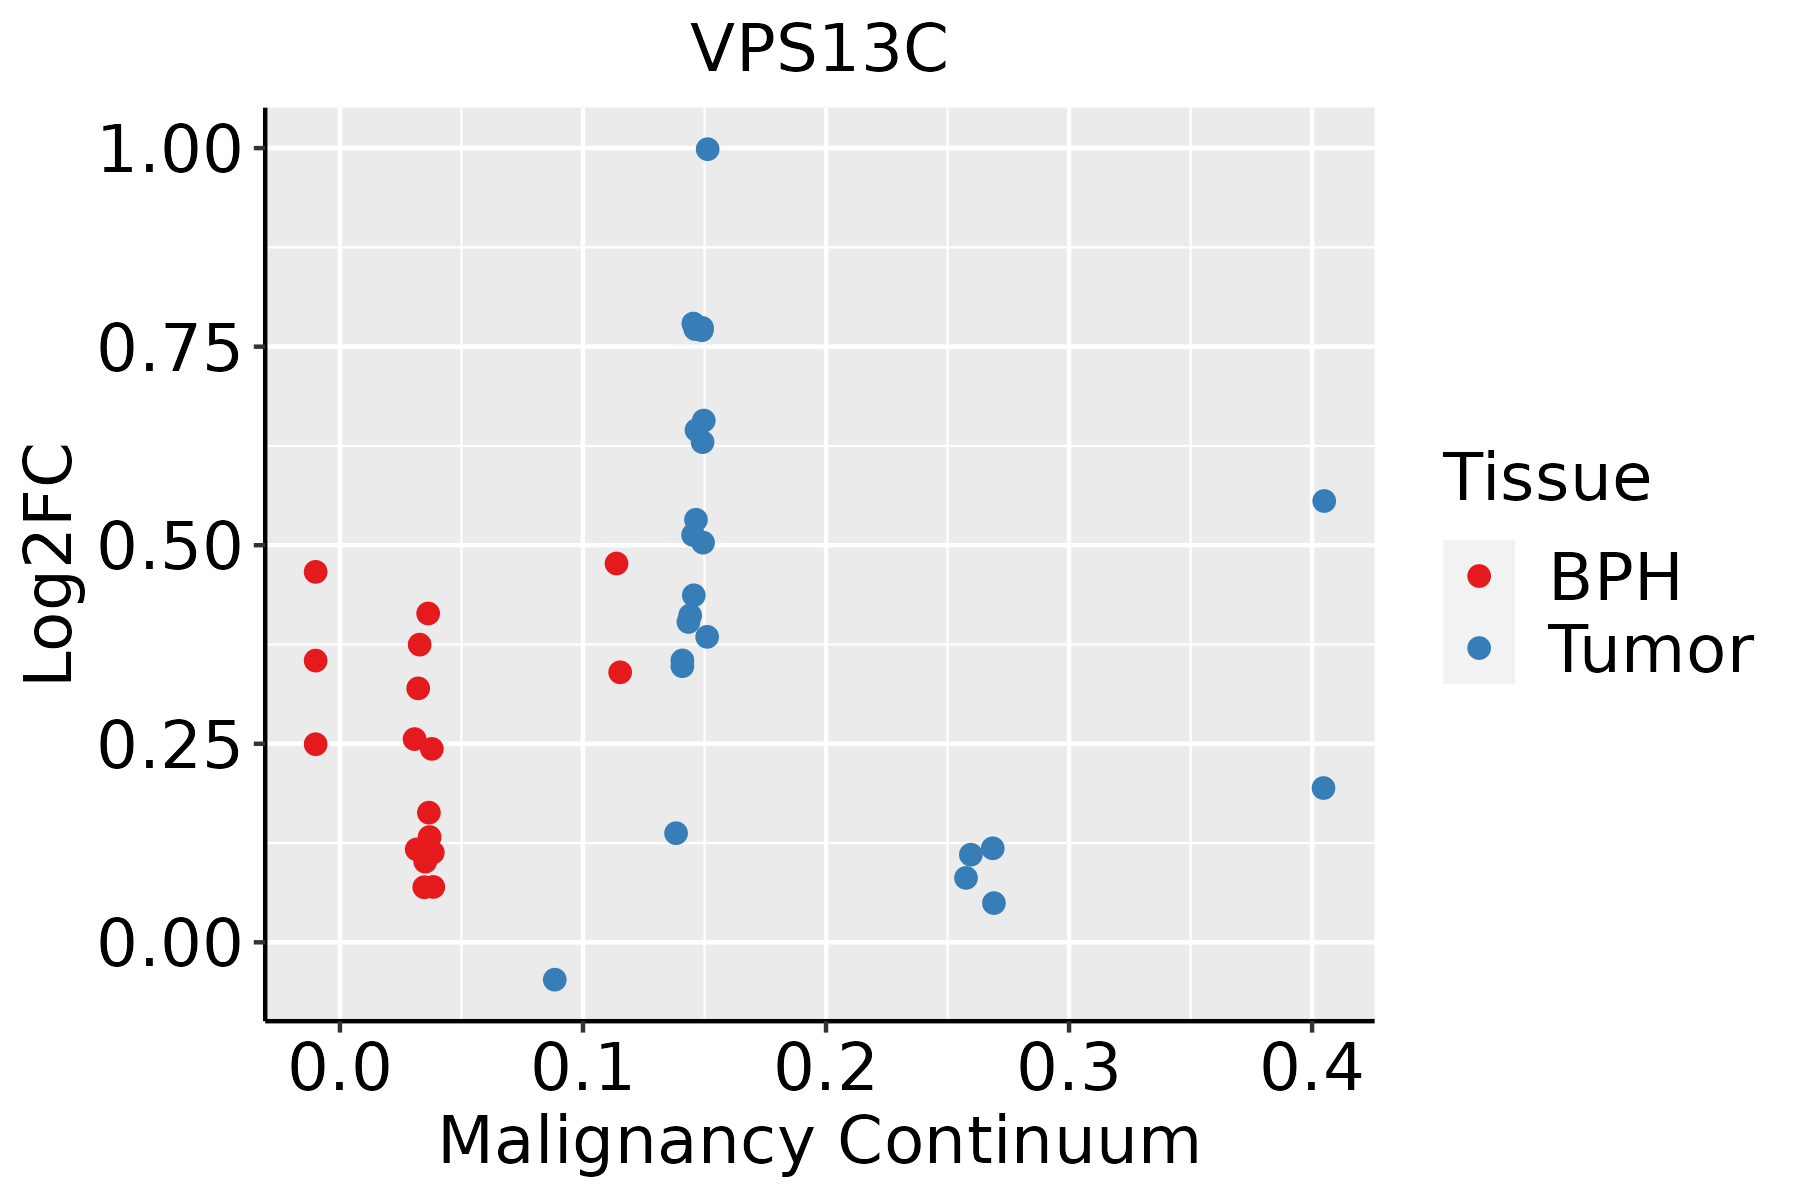 | BPH: Benign Prostatic Hyperplasia |
| Thyroid |  | ATC: Anaplastic thyroid cancer |
| HT: Hashimoto's thyroiditis |
| PTC: Papillary thyroid cancer |
| GO ID | Tissue | Disease Stage | Description | Gene Ratio | Bg Ratio | pvalue | p.adjust | Count |
| GO:0072594 | Colorectum | AD | establishment of protein localization to organelle | 148/3918 | 422/18723 | 7.95e-12 | 1.04e-09 | 148 |
| GO:0048193 | Colorectum | AD | Golgi vesicle transport | 109/3918 | 296/18723 | 1.80e-10 | 1.68e-08 | 109 |
| GO:0022411 | Colorectum | AD | cellular component disassembly | 147/3918 | 443/18723 | 8.53e-10 | 6.76e-08 | 147 |
| GO:0010506 | Colorectum | AD | regulation of autophagy | 111/3918 | 317/18723 | 3.57e-09 | 2.35e-07 | 111 |
| GO:0016482 | Colorectum | AD | cytosolic transport | 68/3918 | 168/18723 | 6.00e-09 | 3.72e-07 | 68 |
| GO:0016236 | Colorectum | AD | macroautophagy | 103/3918 | 291/18723 | 6.76e-09 | 4.15e-07 | 103 |
| GO:0006605 | Colorectum | AD | protein targeting | 105/3918 | 314/18723 | 1.39e-07 | 6.44e-06 | 105 |
| GO:0032868 | Colorectum | AD | response to insulin | 91/3918 | 264/18723 | 2.02e-07 | 8.48e-06 | 91 |
| GO:0006892 | Colorectum | AD | post-Golgi vesicle-mediated transport | 45/3918 | 104/18723 | 2.22e-07 | 9.26e-06 | 45 |
| GO:0010821 | Colorectum | AD | regulation of mitochondrion organization | 57/3918 | 144/18723 | 2.43e-07 | 9.92e-06 | 57 |
| GO:0007034 | Colorectum | AD | vacuolar transport | 60/3918 | 157/18723 | 4.97e-07 | 1.85e-05 | 60 |
| GO:1903008 | Colorectum | AD | organelle disassembly | 46/3918 | 114/18723 | 1.81e-06 | 5.48e-05 | 46 |
| GO:0043434 | Colorectum | AD | response to peptide hormone | 126/3918 | 414/18723 | 2.70e-06 | 7.86e-05 | 126 |
| GO:1903146 | Colorectum | AD | regulation of autophagy of mitochondrion | 19/3918 | 33/18723 | 4.52e-06 | 1.21e-04 | 19 |
| GO:0000422 | Colorectum | AD | autophagy of mitochondrion | 35/3918 | 81/18723 | 4.94e-06 | 1.29e-04 | 35 |
| GO:0061726 | Colorectum | AD | mitochondrion disassembly | 35/3918 | 81/18723 | 4.94e-06 | 1.29e-04 | 35 |
| GO:0061912 | Colorectum | AD | selective autophagy | 29/3918 | 68/18723 | 4.20e-05 | 7.39e-04 | 29 |
| GO:0016241 | Colorectum | AD | regulation of macroautophagy | 50/3918 | 141/18723 | 4.55e-05 | 7.92e-04 | 50 |
| GO:0072665 | Colorectum | AD | protein localization to vacuole | 27/3918 | 67/18723 | 2.40e-04 | 3.04e-03 | 27 |
| GO:0000423 | Colorectum | AD | mitophagy | 14/3918 | 28/18723 | 6.01e-04 | 6.33e-03 | 14 |
| Hugo Symbol | Variant Class | Variant Classification | dbSNP RS | HGVSc | HGVSp | HGVSp Short | SWISSPROT | BIOTYPE | SIFT | PolyPhen | Tumor Sample Barcode | Tissue | Histology | Sex | Age | Stage | Therapy Types | Drugs | Outcome |
| VPS13C | SNV | Missense_Mutation | | c.10711N>A | p.Val3571Ile | p.V3571I | Q709C8 | protein_coding | tolerated(1) | benign(0.015) | TCGA-A2-A0EU-01 | Breast | breast invasive carcinoma | Female | >=65 | I/II | Unknown | Unknown | SD |
| VPS13C | SNV | Missense_Mutation | | c.4351N>A | p.Glu1451Lys | p.E1451K | Q709C8 | protein_coding | tolerated(0.55) | benign(0.003) | TCGA-A2-A0YK-01 | Breast | breast invasive carcinoma | Female | <65 | I/II | Chemotherapy | cytoxan | SD |
| VPS13C | SNV | Missense_Mutation | rs150119821 | c.11150C>A | p.Ala3717Asp | p.A3717D | Q709C8 | protein_coding | tolerated(0.63) | benign(0) | TCGA-A2-A25A-01 | Breast | breast invasive carcinoma | Female | <65 | I/II | Unspecific | Cytoxan | SD |
| VPS13C | SNV | Missense_Mutation | | c.2519C>A | p.Ala840Asp | p.A840D | Q709C8 | protein_coding | tolerated(0.29) | benign(0) | TCGA-A2-A25A-01 | Breast | breast invasive carcinoma | Female | <65 | I/II | Unspecific | Cytoxan | SD |
| VPS13C | SNV | Missense_Mutation | novel | c.6325N>C | p.Ile2109Leu | p.I2109L | Q709C8 | protein_coding | deleterious(0.03) | benign(0.015) | TCGA-A2-A3XX-01 | Breast | breast invasive carcinoma | Female | <65 | I/II | Chemotherapy | cyclophosphamide | CR |
| VPS13C | SNV | Missense_Mutation | novel | c.6324N>T | p.Met2108Ile | p.M2108I | Q709C8 | protein_coding | tolerated(0.36) | benign(0.001) | TCGA-A2-A3XX-01 | Breast | breast invasive carcinoma | Female | <65 | I/II | Chemotherapy | cyclophosphamide | CR |
| VPS13C | SNV | Missense_Mutation | | c.4537N>T | p.Ala1513Ser | p.A1513S | Q709C8 | protein_coding | deleterious(0) | probably_damaging(0.997) | TCGA-A8-A09A-01 | Breast | breast invasive carcinoma | Female | <65 | I/II | Hormone Therapy | tamoxiphen | SD |
| VPS13C | SNV | Missense_Mutation | | c.436N>C | p.Asp146His | p.D146H | Q709C8 | protein_coding | deleterious(0.02) | possibly_damaging(0.533) | TCGA-A8-A0A2-01 | Breast | breast invasive carcinoma | Female | >=65 | I/II | Hormone Therapy | tamoxiphen | SD |
| VPS13C | SNV | Missense_Mutation | | c.7222G>C | p.Glu2408Gln | p.E2408Q | Q709C8 | protein_coding | deleterious(0.01) | possibly_damaging(0.766) | TCGA-AC-A23H-01 | Breast | breast invasive carcinoma | Female | >=65 | I/II | Unknown | Unknown | PD |
| VPS13C | SNV | Missense_Mutation | novel | c.5620G>C | p.Asp1874His | p.D1874H | Q709C8 | protein_coding | deleterious(0) | probably_damaging(0.999) | TCGA-AC-A5XS-01 | Breast | breast invasive carcinoma | Female | >=65 | I/II | Hormone Therapy | femara | SD |


